Datasheet
Year, pagecount:2017, 3 page(s)
Language:English
Downloads:4
Uploaded:February 28, 2022
Size:940 KB
Institution:
-
Comments:
Attachment:-
Download in PDF:Please log in!
Comments
No comments yet. You can be the first!Most popular documents in this category


Content extract
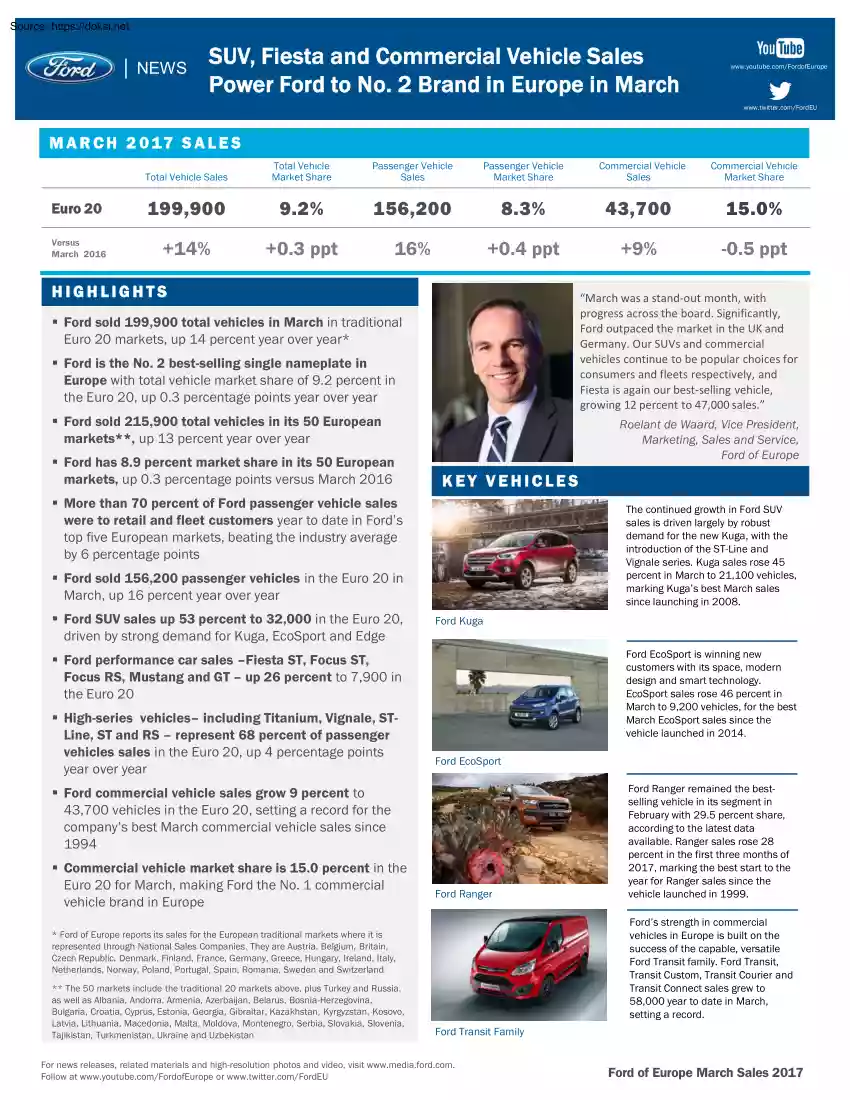
│ NEWS SUV, Fiesta and Commercial Vehicle Sales Power Ford to No. 2 Brand in Europe in March www.youtubecom/FordofEurope www.twittercom/FordEU M A R C H 2 0 17 S A L E S Total Vehicle Sales Total Vehicle Market Share Passenger Vehicle Sales Passenger Vehicle Market Share Euro 20 199,900 9.2% 156,200 8.3% 43,700 15.0% Versus March 2016 +14% +0.3 ppt 16% +0.4 ppt +9% -0.5 ppt HIGHLIGHTS Ford is the No. 2 best-selling single nameplate in Europe with total vehicle market share of 9.2 percent in the Euro 20, up 0.3 percentage points year over year Ford sold 215,900 total vehicles in its 50 European markets*, up 13 percent year over year Roelant de Waard, Vice President, Marketing, Sales and Service, Ford of Europe KEY VEHICLES More than 70 percent of Ford passenger vehicle sales were to retail and fleet customers year to date in Ford’s top five European markets, beating the industry average by 6 percentage points The continued growth in Ford SUV
sales is driven largely by robust demand for the new Kuga, with the introduction of the ST-Line and Vignale series. Kuga sales rose 45 percent in March to 21,100 vehicles, marking Kuga’s best March sales since launching in 2008. Ford sold 156,200 passenger vehicles in the Euro 20 in March, up 16 percent year over year Ford SUV sales up 53 percent to 32,000 in the Euro 20, driven by strong demand for Kuga, EcoSport and Edge Ford Kuga Ford EcoSport is winning new customers with its space, modern design and smart technology. EcoSport sales rose 46 percent in March to 9,200 vehicles, for the best March EcoSport sales since the vehicle launched in 2014. Ford performance car sales –Fiesta ST, Focus ST, Focus RS, Mustang and GT – up 26 percent to 7,900 in the Euro 20 High-series vehicles– including Titanium, Vignale, STLine, ST and RS – represent 68 percent of passenger vehicles sales in the Euro 20, up 4 percentage points year over year Ford EcoSport Ford
commercial vehicle sales grow 9 percent to 43,700 vehicles in the Euro 20, setting a record for the company’s best March commercial vehicle sales since 1994 Commercial vehicle market share is 15.0 percent in the Euro 20 for March, making Ford the No. 1 commercial vehicle brand in Europe Ford Ranger Ford Ranger remained the bestselling vehicle in its segment in February with 29.5 percent share, according to the latest data available. Ranger sales rose 28 percent in the first three months of 2017, marking the best start to the year for Ranger sales since the vehicle launched in 1999. Ford’s strength in commercial vehicles in Europe is built on the success of the capable, versatile Ford Transit family. Ford Transit, Transit Custom, Transit Courier and Transit Connect sales grew to 58,000 year to date in March, setting a record. * Ford of Europe reports its sales for the European traditional markets where it is represented through National Sales Companies. They are Austria,
Belgium, Britain, Czech Republic, Denmark, Finland, France, Germany, Greece, Hungary, Ireland, Italy, Netherlands, Norway, Poland, Portugal, Spain, Romania, Sweden and Switzerland * The 50 markets include the traditional 20 markets above, plus Turkey and Russia, as well as Albania, Andorra, Armenia, Azerbaijan, Belarus, Bosnia-Herzegovina, Bulgaria, Croatia, Cyprus, Estonia, Georgia, Gibraltar, Kazakhstan, Kyrgyzstan, Kosovo, Latvia, Lithuania, Macedonia, Malta, Moldova, Montenegro, Serbia, Slovakia, Slovenia, Tajikistan, Turkmenistan, Ukraine and Uzbekistan Commercial Vehicle Market Share “March was a stand-out month, with progress across the board. Significantly, Ford outpaced the market in the UK and Germany. Our SUVs and commercial vehicles continue to be popular choices for consumers and fleets respectively, and Fiesta is again our best-selling vehicle, growing 12 percent to 47,000 sales.” Ford sold 199,900 total vehicles in March in traditional Euro 20 markets, up 14
percent year over year* Ford has 8.9 percent market share in its 50 European markets, up 0.3 percentage points versus March 2016 Commercial Vehicle Sales Ford Transit Family For news releases, related materials and high-resolution photos and video, visit www.mediafordcom Follow at www.youtubecom/FordofEurope or wwwtwittercom/FordEU Ford of Europe March Sales 2017 M A R C H 2 0 17 S A L E S March 2017 Sales Volum e (registrations) Euro 20 1 March 17 YTD March 17 Industry 2,171,900 4,777,400 up 211,400 / 10.8 % vs Mar16 up 350,600 / 7.9 % vs YTD 16 Ford 199,900 397,800 up 25,100 / 14.3 % vs Mar16 up 34,200 / 9.4 % vs YTD 16 2,382,600 5,260,800 up 208,500 / 9.6 % vs Mar16 up 335,600 / 6.8 % vs YTD 16 Euro 22 2 Industry 212,700 426,000 up 23,600 / 12.5 % vs Mar16 up 31,300 / 7.9 % vs YTD 16 2,431,100 5,391,100 up 209,700 / 9.4 % vs Mar16 up 343,000 / 6.8 % vs YTD 16 215,900 434,500 up 24,400 / 12.7 % vs Mar16 up 33,200 / 8.3 % vs YTD 16 Ford
Total Euro 50 3 Industry Ford 1 The Euro 20 markets are: Austria, Belgium, Britain, Czech Republic, Denmark, Finland, France, Germany, Greece, Hungary, Ireland, Italy, Netherlands, Norw ay, Poland, Portugal, Spain, Romania, Sw eden and Sw itzerland. 2 The Euro 22 markets are: Euro 20 plus Russia and Turkey. 3 Total Euro 50 composed of EURO 22 registrations and EDM 28 retail sales, as total EDM 28 registrations figures are not available. Industry retail sales data not available. EDM 28 or European Direct Markets are: Albania, Andorra, Armenia, Azerbaijan, Belarus, Bosnia-Herzegovina, Bulgaria, Croatia, Cyprus, Estonia, Georgia, Gibraltar, Kazakhstan, Kyrgysztan, Kosovo, Latvia, Lithuania, Macedonia, Malta, Moldova, Montenegro, Serbia, Slovakia, Slovenia, Tajikistan, Turkmenistan, Ukraine and Uzbekistan Mar 2017 Market Share * Euro 20 Total Euro 22 Total Euro 50 March 17 YTD March 17 9.2% 8.3% up 0.3 ppts vs Mar16 up 0.1 ppts vs YTD 16 8.9% 8.1% up 0.2 ppts vs Mar16
up 0.1 ppts vs YTD 16 8.9% 8.1% up 0.3 ppts vs Mar16 up 0.2 ppts vs YTD 16 * Ford share calculated w ith preliminary industry results for some markets. Therefore, industry and share are subject to change slightly due to minor adjustments in some markets as official sources publish their final industry data. * Mar 2017 Retail Market Share Key European m arkets March 17 8.9% up 0.5 ppts vs YAGO YTD March 17 8.4% up 0.1 ppts vs YAGO * The Key European markets are: Britain, Germany, France, Italy and Spain. Ford volume and Industry in these markets represent 75 to 80% of the Europe 20 volume. C O N TAC T Jessica Enoch Ford of Europe +49 221 9018213 jenoch@ford.com 2 Ford of Europe March Sales 2017 M A R C H 2 0 17 S A L E S Ford Top 5 Markets ranked by Mar volum e (registrations) Market 1. Britain Volume 92,500 March 17 o/(u) 16 Share 11,400 14.6 % Market o/(u) 16 0.8 ppts 1. Britain Volume 137,200 YTD March 17 o/(u) 16 Share 11,500 14.8 % o/(u) 16 0.6 ppts 2.
Germany 31,600 3,700 8.0 % 0.1 2. Germany 72,200 5,500 7.8 % 0.2 3. Italy 19,000 3,100 7.7 % 0.0 3. Italy 47,700 5,400 7.6 % 0.1 4. France 12,900 900 4.7 % 0.0 4. France 32,000 3,400 4.8 % 0.2 5. Spain 11,400 3,600 7.7 % 1.7 5. Spain 23,700 4,300 6.6 % 0.7 Top 5 Markets ranked by Fords share in Mar Market Share March 17 o/(u) 16 Volume Market o/(u) 16 1. Britain 14.6 % 0.8 ppts 92,500 11,400 2. Hungary 13.2 % 0.8 1,600 400 YTD March 17 o/(u) 16 Volume Share o/(u) 16 1. Britain 14.8 % 0.6 ppts 137,200 11,500 2. Hungary 12.2 % (0.1) 3,700 500 3. Ireland 11.5 % (0.8) 2,700 (400) 3. Turkey 11.8 % (0.6) 18,800 (2,500) 4. Turkey 11.4 % (0.6) 8,600 (1,600) 4. Ireland 11.6 % (0.7) 10,300 (1,600) 5. Romania 11.2 % 3.1 1,100 400 9.7 % 1.4 2,900 900 5. Romania Mar Sales by vehicle line (Euro 20) Model March 17 KA KA+ o/(u) March 16 YTD March 17 o/(u) YTD March 16 (4,400) 100 (10,300) 6,900
6,900 14,600 14,600 Fiesta 47,000 4,900 90,900 7,500 B-MAX 5,700 - 10,800 (900) Ecosport 9,200 2,900 18,400 3,800 33,100 2,700 63,600 4,000 Focus C-MAX 10,000 (100) 21,400 (2,200) Kuga 21,100 6,500 40,300 9,700 Mondeo 7,900 (1,700) 16,800 (4,800) S-MAX 4,900 500 9,500 (1,200) Galaxy 2,900 700 4,900 (100) Mustang 2,000 100 3,600 (500) Edge 2,300 2,200 5,100 5,100 Tourneo Courier 1,600 200 3,900 200 Tourneo Connect 1,500 (100) 3,600 (100) Tourneo Custom 1,500 800 2,800 1,400 Transit Courier 2,500 800 5,300 1,100 Transit Connect 6,600 500 14,000 200 Transit Custom 17,500 2,400 32,700 3,400 Transit 10,600 (400) 22,500 1,300 Ranger 3,900 (100) 10,400 2,300 Other * Total Sales 1,100 (300) 2,700 (300) 199,900 25,100 397,800 34,200 * Figures largely include vehicles such as Car Derived Vans and imports. 3 Ford of Europe March Sales 2017