Datasheet
Year, pagecount:2017, 8 page(s)
Language:English
Downloads:3
Uploaded:November 20, 2017
Size:795 KB
Institution:
-
Comments:
EUROSTAT
Attachment:-
Download in PDF:Please log in!
Comments
No comments yet. You can be the first!Most popular documents in this category


Content extract
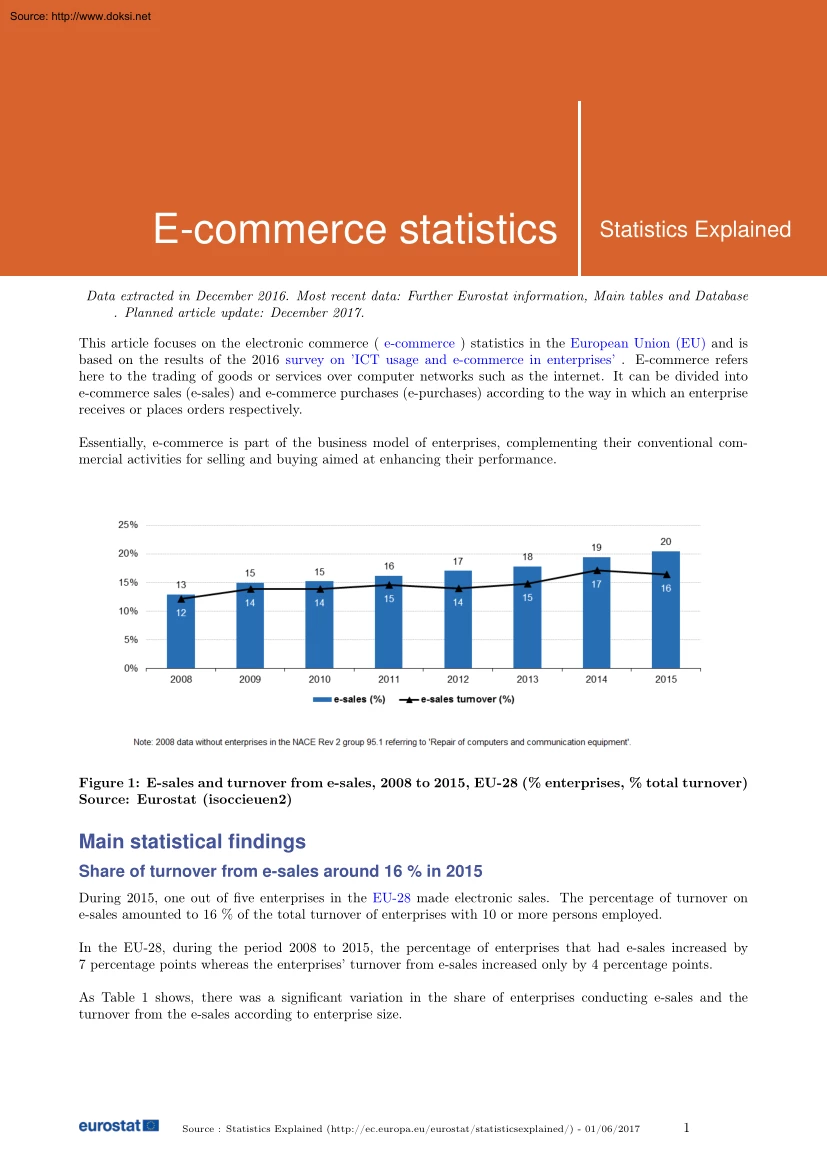
Source: http://www.doksinet E-commerce statistics Statistics Explained Data extracted in December 2016. Most recent data: Further Eurostat information, Main tables and Database . Planned article update: December 2017 This article focuses on the electronic commerce ( e-commerce ) statistics in the European Union (EU) and is based on the results of the 2016 survey on ’ICT usage and e-commerce in enterprises’ . E-commerce refers here to the trading of goods or services over computer networks such as the internet. It can be divided into e-commerce sales (e-sales) and e-commerce purchases (e-purchases) according to the way in which an enterprise receives or places orders respectively. Essentially, e-commerce is part of the business model of enterprises, complementing their conventional commercial activities for selling and buying aimed at enhancing their performance. Figure 1: E-sales and turnover from e-sales, 2008 to 2015, EU-28 (% enterprises, % total turnover) Source: Eurostat
(isoccieuen2) Main statistical findings Share of turnover from e-sales around 16 % in 2015 During 2015, one out of five enterprises in the EU-28 made electronic sales. The percentage of turnover on e-sales amounted to 16 % of the total turnover of enterprises with 10 or more persons employed. In the EU-28, during the period 2008 to 2015, the percentage of enterprises that had e-sales increased by 7 percentage points whereas the enterprises’ turnover from e-sales increased only by 4 percentage points. As Table 1 shows, there was a significant variation in the share of enterprises conducting e-sales and the turnover from the e-sales according to enterprise size. Source : Statistics Explained (http://ec.europaeu/eurostat/statisticsexplained/) - 01/06/2017 1 Source: http://www.doksinet Table 1: E-sales and turnover from e-sales, by size class, 2011-2015, EU-28 (% enterprises, % total turnover) Source: Eurostat (isoccieuen2) During 2015, 42 % of large enterprises made e-sales
corresponding to 23 % of total turnover in this size class. Similarly, 28 % of medium sized enterprises made e-sales corresponding to 12 % of total turnover in this size class. By contrast, 18 % of small enterprises engaged in e-sales, corresponding to only 6 % of the turnover of such enterprises. Wide variation in the share of e-sales among countries In 2015, among the EU-28 (Figure 2), the percentage of enterprises making e-sales ranged from 7 % in Romania to 30 % in Ireland, followed by Denmark (29 %) and Germany and Sweden (28 %). Figure 2: E-sales, 2015 (% enterprises) Source: Eurostat (isoceceseln2), see country codes Enterprises using the web dominated in the area of e-sales Specific methods for e-sales enable the ’sales process’ to take place in a faster and more efficient manner. These methods can be broadly divided into web sales and EDI -type sales referring to the way customers – private or business – place orders for the products that they wish to purchase.
Therefore, for the survey on ’ICT usage and e-commerce in enterprises’, respondents were asked to state whether they received orders via a website or apps (web sales) or in a format that allowed automated processing (EDItype sales) using Electronic Data Interchange or Extensible Markup Language (XML) format for example. Enterprises consider it important to be visible on the internet. Consequently, websites are increasingly offered by enterprises or third parties for various purposes In particular, websites allow customers to purchase by placing their orders electronically. E-commerce statistics 2 Source: http://www.doksinet Figure 3: E-sales broken down by web and EDI-type sales, 2015 (% enterprises with e-sales) Source: Eurostat (isoceceseln2) As shown in Figure 3, during 2015, 80 % of EU enterprises selling electronically used a website or apps, while 32 % used EDI-type sales. On the one hand, during 2015, the percentage of enterprises that used EDI-type sales ranged from 13
% of enterprises conducting e-sales in Greece to 49 % in Ireland, followed by the Czech Republic (46 %). On the other hand, the percentage of enterprises receiving orders over websites or via apps was considerably high for almost all Member States, ranging from 72 % in Portugal to 95 % in Greece. Figure 4: E-sales broken down by web and EDI-type sales, by economic activity and size, EU-28, 2015 (% enterprises with e-sales) Source: Eurostat (isoceceseln2) As shown in Figure 4, during 2015, almost all enterprises making e-sales in the ’Accommodation’ branch received orders via a website, while 11 % made e-sales via EDI-type messages. More than half of ’Manufacturing’ enterprises making e-sales reported that they received orders via EDI-type messages, followed by enterprises in the ’Transport and storage’ sector (46 %). The percentages for ’Manufacturing’ enterprises that conducted e-sales via a website or apps and via EDItype messages were very close, 61 % and 53 %
respectively. For all other economic activities, enterprises received their orders in most cases via websites or apps. It is noticeable that, among the small enterprises making e-sales, 84 % of enterprises tended to have web sales, whereas among the large enterprises 64 % received orders via websites. Web and EDI-type sales were almost equally reported by large enterprises (Figure 4). E-commerce statistics 3 Source: http://www.doksinet The share of turnover from EDI-type sales is greater than that from web sales In the EU-28, enterprises realised 16 % of their total turnover from e-sales during 2015, consisting of orders via a website or apps or via EDI-type messages. However, the turnover realised from EDI-type sales was 11 % of total turnover, while the turnover from web sales was only 5 %. From the 5 %, 3 % came from e-sales to other enterprises and public authorities while 2 % came from e-sales to private consumers (Figure 9). As Figure 5 shows, large enterprises – with 250
or more persons – rely in principle on ICT and standards that integrate EDI-type sales within their business processes. In fact, large enterprises reported the highest share of turnover from e-sales (23 %), most of it realised from EDI-type sales (16 %). In addition, enterprises in ’Accommodation’ and ’Manufacturing’ reported the highest shares of total turnover from e-sales (29 % and 22 % respectively). However, enterprises in ’Accommodation’ realised most of their turnover from web sales (26 %) whereas those in ’Manufacturing’ from EDI-type sales (19 %). The third highest share of turnover from e-sales has been reported by enterprises in ’Transport and storage’, almost equally realised from web sales and EDI-type sales (10 % and 11 % respectively). Figure 5: Turnover from e-sales broken down by web and EDI-type sales, by economic activity and size, 2015 (% total turnover) Source: Eurostat (isocecevaln2) Figure 6: Web sales and EDI-type sales broken down by
economic activity and size, 2015, (% turnover from e-sales) Source: Eurostat (isocecevaln2) E-commerce statistics 4 Source: http://www.doksinet Figure 7: Turnover from e-sales broken down by web and EDI-type sales, 2015 (% total turnover) Source: Eurostat (isocecevaln2) During 2015, among all Member States, the percentage of turnover realised from e-sales ranged from 4 % in Bulgaria and Cyprus to 35 % in Ireland, followed by Belgium and the Czech Republic (both 31 %), Denmark (23 %) and Sweden (21 %). Figure 7 shows the contribution of web sales and EDI-type sales to total turnover. In particular, the share of the total turnover realised from EDI-type sales ranged from less than 1 % in Greece to 24 % in the Czech Republic and 20 % in Ireland. In addition, the share of total turnover from web sales ranged from 1 % in Bulgaria to 15 % in Ireland. Figure 8: Web sales and EDI-type sales, 2015 (% turnover from e-sales) Source: Eurostat (isocecevaln2) Figure 8 shows the distribution of
e-sales turnover between web sales and EDI-type sales. In 2015, for the majority of countries, the share of e-sales turnover from EDI-type sales was greater than the share from sales via websites or apps. In particular, for Slovenian enterprises making e-sales, the percentage of turnover realised by EDI-type sales was more than five times that from web sales. E-commerce statistics 5 Source: http://www.doksinet Figure 9: Turnover from web sales broken down by B2BG and B2C, 2015 (% total turnover) Source: Eurostat (isocecevaln2) Cross border e-commerce sales not fully exploited by enterprises selling electronically (2015 survey) E-commerce enables enterprises to establish their presence in the market at national level and also to extend their economic activities beyond borders in order to pursue opportunities elsewhere. Moreover, e-commerce has the potential to reshape the European Single Market for enterprises and private consumers by enabling price and product-related comparisons
in a borderless market environment. Figure 10: E-commerce sales to own country and other EU countries, 2014 (% enterprises) Source: Eurostat (isoceceseln2) However, in 2014 in the EU-28, while almost all enterprises making electronic sales (19 %) reported that they sold to the markets in their own countries (18 %), only 8 % of enterprises made e-sales to other EU countries (Figure 10). In particular, the potential for cross-border e-sales to other EU countries was not fully exploited. While 32 % of enterprises in Ireland made e-sales ranking it first among the EU countries as many as 17 % of enterprises reported selling to customers in other EU countries. For many other countries, however, the potential was much higher For example, enterprises in Sweden and Denmark rank high in e-sales (28 % and 27 % respectively) but only 10 % (each) sold to other EU countries. Outside the EU, Norway has the highest potential for enterprises to expand into foreign markets, with 29 % of enterprises
making e-sales but only 5 % to customers in EU countries. E-commerce statistics 6 Source: http://www.doksinet Data sources and availability Data presented in this article are based on the results of the 2016 survey on ’ICT usage and e-commerce in enterprises’. Statistics were obtained from enterprise surveys conducted by National Statistical Authorities in the first months of 2016. The surveys’ reference period was the current situation of the survey period or for some questions (like e.g e-commerce) the year 2015 In 2016, 148 000 enterprises, with 10 or more persons employed, out of 1.6 million in EU-28 were surveyed Out of these 1.6 million enterprises approximately 83 % were enterprises with 10-49 persons employed, 14 % with 50-249 and 3 % with 250 or more. The observation statistical unit is the enterprise, as defined in the Regulation 696/1993 of 15 March 1993. The survey covered enterprises with at least 10 persons employed. Economic activities correspond to the
classification NACE Revision 2 The sectors covered are manufacturing, electricity, gas and steam, water supply, construction, wholesale and retail trades, repair of motor vehicles and motorcycles, transportation and storage, accommodation and food service activities, information and communication, real estate, professional, scientific and technical activities, administrative and support activities and repair of computers and communication equipment. Enterprises are broken down by size; small (10-49), medium (50-249) and large enterprises (250 or more persons employed). Data in tables shown as ’:’ refer to data that are unavailable, unreliable, confidential or not applicable. Unreliable data are included in the calculation of European aggregates Data presented in this article may differ from the data in the database on account of updates made after the data extractions used for this article. Figure 7 and Figure 8: only countries that have reported turnover for both, web sales and
EDI-type sales, are presented in the graphs. Figure 9: only countries that have reported web sales for both, to B2BG and B2C, are presented in the graph. Context The Digital Single Market for Europe is a major priority of the European Commission. The strategy is built on three pillars: (1) better access for consumers and businesses to digital goods and services across Europe; (2) creating the right conditions and a level playing field for digital networks and innovative services to flourish; (3) maximising the growth potential of the digital economy. More specifically, for the first pillar, the Digital Single Market strategy aims at removing the key differences between online and offline worlds, and to break down barriers to cross-border online activity. Boosting e-commerce in the EU includes actions related to making cross-border parcel delivery more affordable and efficient and promoting customer trust through better protection and enforcement. See also • Internet advertising of
businesses - statistics on usage of ads • ICT specialists - statistics on hard-to-fill vacancies in enterprises • E-business integration • ICT security in enterprises • Mobile connection to internet • Social media - statistics on the use by enterprises • Cloud computing - statistics on the use by enterprises • Digital economy and society statistics - enterprises E-commerce statistics 7 Source: http://www.doksinet Further Eurostat information Publications • Share of turnover from e-commerce stable at 14% in 2009 and 2010 - Statistics in focus 18/2012 Main tables • Digital economy and society Database • Digital economy and society , see: ICT usage in enterprises (isoce) Summary of EU aggregates (isoccieuen2) E-commerce (isocec) E-commerce sales (isoceceseln2) Value of e-commerce sales (isocecevaln2) Dedicated section • Digital economy and society Methodology / Metadata • ICT usage and e-commerce in enterprises (ESMS metadata file isoceesms) Other
information • Regulation (EC) No 808/2004 of 21 April 2004 concerning Community statistics on the information society • Regulation (EC) No 960/2008 of 30 September 2008 implementing Regulation (EC) No 808/2004 concerning Community statistics on the information society • Regulation (EC) No 1023/2009 of 29 October 2009 implementing Regulation (EC) No 808/2004 concerning Community statistics on the information society • Regulation (EU) No 821/2010 of 17 September 2010 implementing Regulation (EC) No 808/2004 concerning Community statistics on the information society • Regulation (EU) No 937/2011 of 21 September 2011 implementing Regulation (EC) No 808/2004 concerning Community statistics on the information society • Regulation (EU) No 1083/2012 of 19 November 2012 implementing Regulation (EC) No 808/2004 concerning Community statistics on the information society • Regulation (EU) No 859/2013 of 5 September 2013 implementing Regulation (EC) No 808/2004 concerning Community
statistics on the information society • Regulation (EU) No 1196/2014 of 30 October 2014 implementing Regulation (EC) No 808/2004 concerning Community statistics on the information society • Regulation (EU) 2015/2003 of 10 November 2015 implementing Regulation (EC) No 808/2004 concerning Community statistics on the information society • Regulation (EC) No 696/1993 of 15 March 1993 on the statistical units for the observation and analysis of the production system in the Community External links • Digital Agenda for Europe E-commerce statistics 8
 When reading, most of us just let a story wash over us, getting lost in the world of the book rather than paying attention to the individual elements of the plot or writing. However, in English class, our teachers ask us to look at the mechanics of the writing.