Datasheet
Year, pagecount:2017, 4 page(s)
Language:English
Downloads:2
Uploaded:November 20, 2017
Size:656 KB
Institution:
-
Comments:
Ministry for National Economy
Attachment:-
Download in PDF:Please log in!
Comments
No comments yet. You can be the first!Most popular documents in this category


Content extract
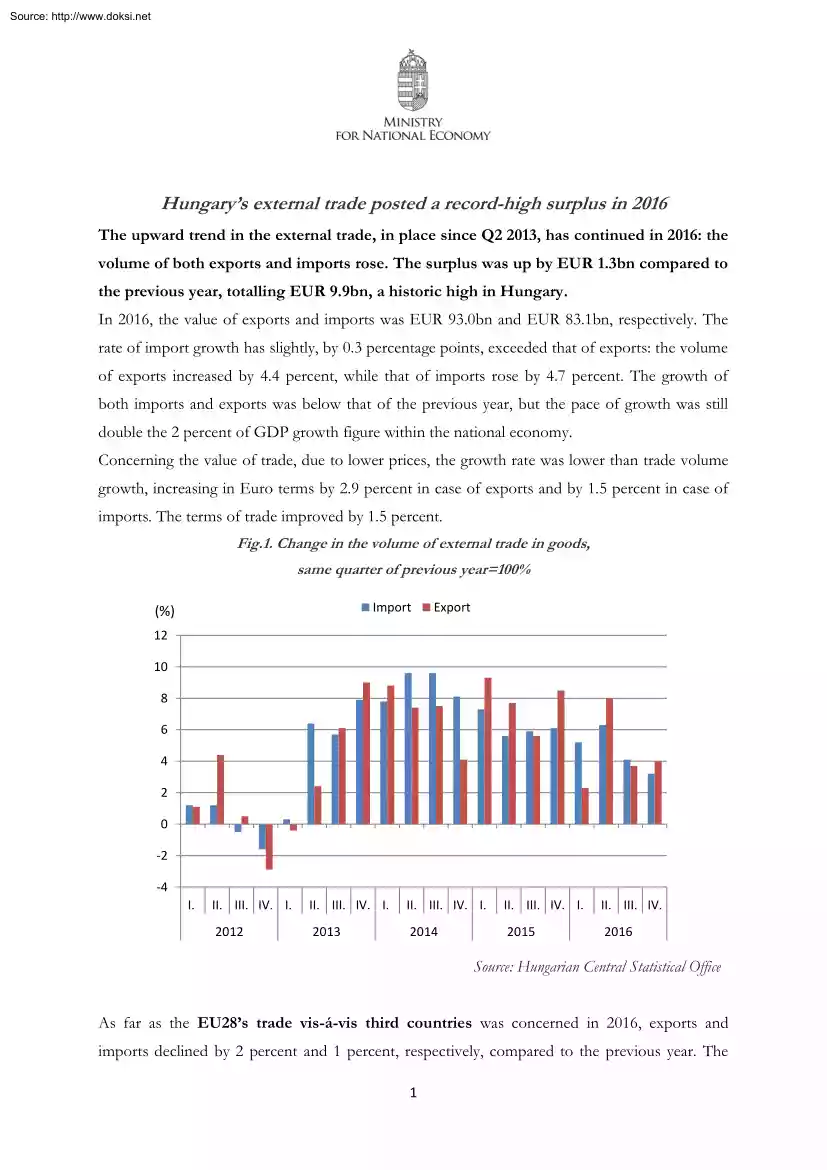
Source: http://www.doksinet Hungary’s external trade posted a record-high surplus in 2016 The upward trend in the external trade, in place since Q2 2013, has continued in 2016: the volume of both exports and imports rose. The surplus was up by EUR 13bn compared to the previous year, totalling EUR 9.9bn, a historic high in Hungary In 2016, the value of exports and imports was EUR 93.0bn and EUR 831bn, respectively The rate of import growth has slightly, by 0.3 percentage points, exceeded that of exports: the volume of exports increased by 4.4 percent, while that of imports rose by 47 percent The growth of both imports and exports was below that of the previous year, but the pace of growth was still double the 2 percent of GDP growth figure within the national economy. Concerning the value of trade, due to lower prices, the growth rate was lower than trade volume growth, increasing in Euro terms by 2.9 percent in case of exports and by 15 percent in case of imports. The terms of trade
improved by 15 percent Fig.1 Change in the volume of external trade in goods, same quarter of previous year=100% Import (%) Export 12 10 8 6 4 2 0 -2 -4 I. II. III IV I II. III IV I II. III IV I II. III IV I II. III IV 2012 2013 2014 2015 2016 Source: Hungarian Central Statistical Office As far as the EU28’s trade vis-á-vis third countries was concerned in 2016, exports and imports declined by 2 percent and 1 percent, respectively, compared to the previous year. The 1 Source: http://www.doksinet surplus was down by EUR 10.6bn, to EUR 393bn The trade conducted among EU countries, however, gained 1 percent in value in the observed period. The trade performance of Central and Eastern European countries was slightly better than the EU average (Fig.2) The exports of the three other Visegrad Four members increased by 3 percent each, while that of Romania soared by 5 percent and that of Austria was unchanged. Hungary’s external trade surplus was the second highest in
the region, after that of the Czech Republic. Fig.2 External trade balance in V4, Austria, Romania and Slovenia (year 2016, bn euro) 25 20 18,6 15 9,9 10 4,7 5 2,2 2,0 0 -5 -4,3 -10 -10 -15 Czech Republic Hungary Poland Slovakia Romania Slovenia Austria Source: Eurostat In 2016, the product categories of machinery and transport equipment as well as fuels and energy were the main determinants of Hungary’s external trade balance (Fig.3) The value of exports of machinery and transport equipment, which category accounts for 58 percent of total exports, increased by 3.9 percent, and that of imports was up by 29 percent Thus, its share within the total surplus has continued to rise. The primary driver of exports was the automotive industry and related product groups – road vehicles, power-generating machinery and equipment, professional-scientific and controlling instruments and apparatus. Fig.3 Top ten product groups with the largest share of exports (million Euro)
2 Source: http://www.doksinet 20 000 16 706 15 000 11 754 9 144 10 000 3 795 2 905 2 603 2 172 Manufactures of metals, n.es 4 250 Miscellaneous manufactured articles, n.es 4 448 5 000 Professional, scientific and controlling instruments and apparatus 6 330 Office machines and automatic data processing machines General industrial machinery and equipment Medical and pharmaceutical products Telecommunications and sound recording and reproducing apparatus and equipment Power generating machinery and equipment Electrical machinery, apparatus and appliances Road vehicles 0 Source: Hungarian Central Statistical Office (KSH) Fig.4 shows to what extent various product groups contributed to the external trade balance Thanks to low global crude oil and natural gas prices, the volume of respective imports was similar to that of the previous year, but their value was down by more than 20 percent, and this has also improved the balance. The imports of manufactured goods,
which account for 37 percent of total and are mainly used for production purposes, saw growth of 4.1 percent, higher than the increase of exports. While the imports of food, beverages and tobacco products increased by 6 percent, exports stagnated. Fig.4 External trade balance by main groups of commodities (million Euro) 3 Source: http://www.doksinet 2016 2015 12394 11557 Machinery and transport equipment -1309 -1017 Manufactured goods Fuels, electric energy -3593 -4619 338 316 Crude materials 2104 2359 Food, beverages, tobacco -6000 -4000 -2000 0 2000 4000 6000 8000 10000 12000 14000 Source: Hungarian Central Statistical Office (KSH) The share of imports and exports in 2016 conducted with EU member states was similar to that of recent years: they accounted for 78.1 percent and 794 percent of total, respectively The increase of export with the EU exceeded the pace of overall trade growth. Nine out of Hungary’s top ten export destinations were EU member states. On
top of the ranking is Germany, with an outstanding export share of 28 percent. Second- and third ranked Romania and Slovakia accounted for a much smaller share of about 5 percent each. Among non-EU countries, the United States of America was the most significant, with a share of 3 percent. The country, to which exports rose the fastest, 25 percent, was China, mainly thanks to the automotive industry. In light of international economic indicators analysts predict further expansion in the industrial sector and exports. Rising domestic investment and household consumption fuelled by real wages as well as higher oil prices are also believed to lead to import growth that exceeds last year’s figure and a slightly lower external trade surplus in 2017. 4