Datasheet
Year, pagecount:2005, 43 page(s)
Language:English
Downloads:3
Uploaded:January 11, 2018
Size:1 MB
Institution:
-
Comments:
Attachment:-
Download in PDF:Please log in!
Comments
No comments yet. You can be the first!


Content extract
Source: http://www.doksinet National Air Pollution Surveillance Network Quality Assurance and Quality Control Guidelines Report No. AAQD 2004- 1 Environmental Technology Centre Analysis and Air Quality Division Source: http://www.doksinet National Air Pollution Surveillance Network Quality Assurance and Quality Control Guidelines Environment Canada Environmental Protection Service Environmental Technology Advancement Directorate Analysis and Air Quality Division Environmental Technology Centre Ottawa, Ontario. K1A 0H3 Report No. AAQD 2004 - 1 (Originally published in December 1995 as PMD 95-8) Source: http://www.doksinet Notice This document has not undergone detailed technical review by the Environmental Technology Advancement Directorate and the content does not necessary reflect the views and policies of Environment Canada. Mention of trade names or commercial products does not constitute endorsement for use. Any comments concerning its content should be directed to:
Chief, Analysis and Air Quality Division Environment Canada Environmental Protection Service Environmental Technology Advancement Directorate Environmental Technology Centre Ottawa, Ontario K1A 0H3 Ce document est aussi disponible en français. Source: http://www.doksinet Acknowledgements This document was prepared by the staff of the Analysis and Air Quality Division of Environment Canada with the contributions of NAPS network agencies. We would like to thank all the individuals who have participated in completing this document. Source: http://www.doksinet Foreword This document is a revision of the manual entitled National Air Pollution Surveillance Network Quality Assurance and Quality Control Guidelines, first published in 1995. It contains management policies and monitoring protocols which specify how NAPS network agencies strive to produce quality-assured data of known and acceptable precision, accuracy, representativeness and completeness. Addendums, revisions and
corrections to this document will be issued periodically. A formal review of this document will be undertaken at five-year intervals. Source: http://www.doksinet Table of Contents 1. The National Air Pollution Surveillance (NAPS) Network 2. NAPS Network Agencies 3. NAPS Network Quality Assurance and Quality Control (QA/QC) Objectives 4. Purpose of the NAPS Network QA/QC Guidelines 5. NAPS Network QA/QC Program Elements 5.1 Network and QA Planning and Management Canadian Air Quality Standards and Objectives Measurement Methods, Analyzer Selection and Operating Specifications 5.2 Site Selection and Location 5.3 Sampling Systems Shelter Requirements Probe Siting Criteria Manifold Design 5.4 Station and Analyzer Operation Station Visits Analyzer Operation Data Acquisition Preventive Maintenance 5.5 Traceability of Calibration and Reference Standards 5.6 Calibrations Analyzer Calibration Frequency Calibration Procedure Analyzer Zero and Span Verifications 5.7 Inter-agency Testing and
Audits Inter-agency Testing Inter-agency Testing Procedures Analyzer Performance Audits Analyzer Performance Audit Procedures System Audits 5.8 Data Review and Validation 5.9 Documentation Site Documentation Station Log Books Analyzer Operation and Maintenance Manuals 5.10 Training Requirements Personnel Qualifications Training Suggested Training Courses 6. References 7. Abbreviations and Acronyms 8. Glossary 1 3 6 6 7 7 9 9 12 14 15 17 18 19 19 21 22 23 Source: http://www.doksinet Tables 5.0 NAPS Network QA/QC Components and Management 5.13 Measurement Methodology and Operating 7 8 Specifications of NAPS Network Analyzers 5.31 NAPS Network Sample Probe Location Criteria 11 5.32 Minimum Distance from Roadways for O3 and NO2 Analyzers 11 5.4 Summary of NAPS Station Work Activities 13 5.5 List of SRMs and Reference Standards for the NAPS Network 15 Appendices Appendix I Appendix II Appendix III Appendix IV Performance Specifications for Ambient Air Analyzers
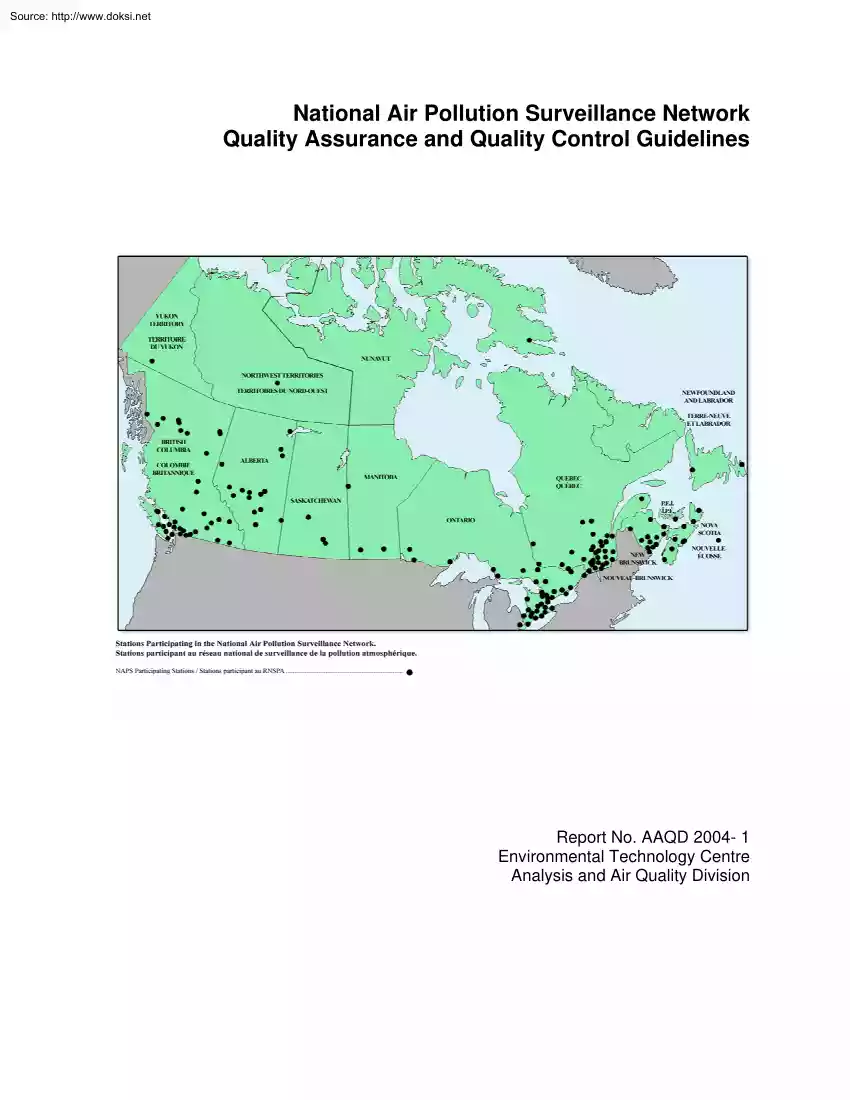
Manifold Design for NAPS Sampling System Zero and Span Verifications for Ambient Air Gas Analyzers Calibration Procedures for Continuous Ambient Air Analyzers 24 26 31 34 Source: http://www.doksinet 1. The National Air Pollution Surveillance (NAPS) Program The National Air Pollution Surveillance program, or NAPS, has been in existence since 1970 and is a cooperative partnership of federal, provincial, territorial and some regional governments measuring air quality throughout Canada. The NAPS program supports many air quality programs across Canada designed to protect human health and the environment. The goal of the NAPS program is to provide accurate and long-term air quality data of a uniform standard throughout Canada. Data from the NAPS program are included in the Canada-wide Air Quality Database and are published in annual air quality data summary reports, which are available on the internet at: http://www.etc-cteecgcca/publications/napsreports ehtml In 2003, the NAPS network
and associated provincial/territorial/regional monitoring networks reporting data to the Canada-wide Air Quality database consisted of approximately 290 monitoring stations in over 175 communities in Canada, equipped with approximately 600 continuous monitors measuring sulphur dioxide, carbon monoxide, nitrogen dioxide, ozone, and particulate matter, and over 160 air samplers measuring components of particulate matter, volatile organic compounds and other toxics substances. The Analysis and Air Quality Division of Environment Canada coordinates operation of the NAPS program, provides air monitoring instrumentation and reference standards, operates a laboratory for the chemical speciation of NAPS samples, directs a national quality assurance program, coordinates the development of equipment specifications for the monitoring network as a whole and maintains the Canada-wide Air Quality Database. The provincial, territorial and regional governments share in overall management of the NAPS
Program, support the development of standardized methods, and are responsible for the ongoing operation and maintenance of monitoring stations and instrumentation, data acquisition and validation, and reporting within their jurisdictions. Key objectives of the NAPS program include: 1. Determining the nature and levels of air pollutants affecting human health and the environment in Canada 2. Supporting near real-time reporting of air quality information to the public 3. Supporting air quality prediction and forecasting programs 4. Assessing long-term trends in air contaminants across Canada 5. Tracking the occurrence and extent of new contaminants in ambient air 6. Providing data to support scientific research into the effects of air pollution on health and environment 7. Supporting the development of air quality standards and objectives 8. Supporting evaluation of the success of pollution control strategies procedures 9. Supporting national and international air quality agreements and
initiatives 1 Source: http://www.doksinet 10. Supporting the development and evaluation of new monitoring technologies, and the development and application of quality assurance/quality control. The NAPS network supports data needs for joint air quality initiatives including the National Air Quality Objectives, the Air Toxics Program, the Canada-Wide Standards, the Canada-U.S Air Quality Agreement, the Quality Prediction Program, Special Studies, and other initiatives that may arise. 2 Source: http://www.doksinet 2. NAPS Network Agencies Newfoundland and Labrador Department of Environment Pollution Prevention Division 4th floor, Conference Bldg., PO Box 8700 St. Johns, NF A1B 4J6 Manager: Peter Haring Telephone: (709) 729-2564 Fax: (709) 729-6969 Email: daweg@mail.govnfca Web: www.govnfca/env/Env/defaultasp Prince Edward Island Department of Fisheries, Aquaculture and Environment Air Quality and Hazardous Materials Environmental Protection 11 Kent Street P.O Box 2000
Charlottetown, PE C1A 7N8 Manager: Todd Fraser Telephone: (902) 368-5037 Fax: (902) 368-5830 Email: ktfraser@gov.peca Web: www.govpeca/ Nova Scotia Environment & Labour Environment and Natural Areas Management Division Air Quality Branch P.O Box 697, Halifax, NS B3J 2T8 Manager: Johnny McPherson Telephone: (902) 424-2566 Fax: (902) 424-0503 Email: mcpherjp@gov.nsca Web: www.govnsca/enla/ New Brunswick Department of the Environment and Local Government Ministère de l’Environnement et Gouvernements locaux du Nouveau Brunswick Air Sciences Section / Section des sciences de lair P.O Box 6000, 364 Argyle Street Fredericton, NB E3B 5H1 Manager: Randy Piercey Telephone: (506) 457-4844 Fax: (506) 453-2265 Email: randy.piercey@gnbca Web: www.gnbca/elg-egl Gouvernement du Québec, Ministère de lEnvironnement Direction du suivi de l’état de l’environnement Édifice Marie-Guyart, 7ième étage 675, boul. René Lévesque Est Québec, QC G1R 5V7 Gestionnaire: Ghislain Jacques
Téléphone: (418) 521-3820 poste 4569 Fax: (418) 643-9591 Courriel: ghislain.jacques@menvgouvqcca Web: www.menvgouvqcca/ Ville de Montréal Direction de lenvironnement Boul. 827, Crémazie Est, Bureau 429 Ville de Montréal, QC H2M 2T8 Gestionnaire: Claude Gagnon 3 Source: http://www.doksinet Téléphone: Fax: Courriel: Web: (514) 280-4291 (514) 280-4285 claude.gagnon@cumqcca www.rsqaqcca/framvilleasp?url=framrsqfasp Ontario Ministry of Environment / Ministère de l’Environnement de l’Ontario Air Monitoring Section 125 Resources Road, West Wing Etobicoke, ON M9P 3V6 Supervisor: Phil Kiely Telephone: (416) 235-5780 Fax: (416) 235-6037 Email: kielyph@ene.govonca Web: www.enegovonca/ Manitoba Conservation, Air Quality Management Section 123 Main Street, Suite 160 Winnipeg, MB R3C 1A5 Manager: Don Regehr Telephone: (204) 945-7001 Fax: (204) 948-2357 Email: dregehr@gov.mbca Web: www.govmbca/environ/indexhtml Saskatchewan Environment Environmental Protection Branch 3211 Albert
Street Regina, SK S4S 5W6 Manager: Chris Gray Telephone: (306) 787-6196 Fax: (306) 787-0197 Email: CGray@serm.govskca Web: www.segovskca Alberta Environment Environmental Monitoring and Evaluation Branch, Environmental Assurance st 1 Floor, Twin Atria Building 4999-98th Avenue Edmonton, AB T6B 2X3 Manager: Albert Poulette Telephone: (780) 422-3035 Fax: (780) 427-3178 Email: albert.poulette@govabca Web: www.casadataorg Web: www.govabca/env/ British Columbia Ministry of Water, Land and Air Protection 2975 Jutland Road Victoria, BC V8W 9M1 Manager: Chris Jenkins Telephone: (250) 387-9944 Fax: (250) 356-7197 Email: Chris.Jenkins@gems7govbcca Web: wlapwww.govbcca/air/ Greater Vancouver Regional District (GVRD) Air Quality Department 4330 Kingsway, 6th Floor Burnaby, BC V5H 4G8 Manager: Kenneth P. Stubbs Telephone: (604) 436-6747 Fax: (604) 436-6707 Email: ken.stubbs@gvrdbcca 4 Source: http://www.doksinet Web: www.gvrdbcca Yukon Department of Environment Environmental Protection &
Assessment Branch P.O Box 2703 Whitehorse, YT Y1A 2C6 Manager: Janine Kostelnik Telephone: (867) 667-5456 Fax: (867) 393-6205 Email: janine.kostelnik@govykca Web: www.renresgovykca/ Northwest Territories Resources, Wildlife and Economic Development Environmental Protection Service P.O Box 21 Scotia Centre 600 - 5102 50th Avenue Yellowknife, NT X1A 3S8 Manager: Graham Veale Telephone: (867) 873-7654 Fax: (867) 873-0221 Email: graham veale@gov.ntca Web: www.govntca/RWED/eps/indexhtm Government of Nunavut Department of Sustainable Development Environmental Protection Services Manager: Gordon McKay Telephone: (867) 975-5917 Fax: (867) 975-5980 Email: gmckay@gov.nuca Web: www.govnuca/ Environment Canada, Meteorological Service of Canada / Environnement Canada, Service météorologique du Canada Canadian Air and Precipitation Monitoring Network (CAPMoN) / Réseau canadien déchantillonnage des précipitations et de lair (RCEPA) 4905 Dufferin St. Downsview, ON M3H 5T4 Manager: Dave MacTavish
Telephone: (416) 739-4450 Fax: (416) 739-5704 Email: dave.mactavish@ecgcca Web: www.mscecgcca/capmon/index ecfm Web: www.mscecgcca/capmon/index fcfm Environment Canada, Environmental Protection Service / Environnement Canada, Service de la protection de l’environnement Analysis and Air Quality Division / Division des analyses et de la qualité de l’air 335 River Road Ottawa, ON K1A 0H3 Manager: Richard Turle Telephone: (613) 990-8559 Fax: (613) 990-8568 Email: richard.turle@ecgcca Web: www.etc-cteecgcca 5 Source: http://www.doksinet 3. NAPS Network Quality Assurance and Quality Control (QA/QC) Objectives 3.1 It is the policy of the NAPS network agencies to provide sufficient quality assurance and quality control to ensure that the ambient air monitoring data collected from the NAPS network are of acceptable precision, accuracy, completeness, comparability, and representativeness. Every NAPS agency has in place a quality assurance and control program that is supplemented by a
federal quality assurance and control program. These programs are intended to support the policy that the data generated from the NAPS network be within ±15% of true values. 3.2 All data shall be traceable to a primary standard All calibration standards (including zeros and spans) used in the NAPS network are certified traceable to primary standards of the U.S National Institute of Standards and Technology (NIST) or Canada’s Institute for National Measurement Standards (INMS). 3.3 All data shall be of a known and documented quality 3.4 All data shall be comparable, meaning that the data shall be produced in a similar and scientific manner using standard methodologies for sampling, calibration, auditing, and collection of data. Where possible, methods used in the NAPS network are or pending to be designated reference or equivalent methods by the United States Environmental Protection Agency. 3.5 All data shall be representative of the parameters being measured with respect to time,
location, and the conditions from which the data are obtained. The use of standard methodologies contained in this manual should insure that the data generated is representative. 4. Purpose of the NAPS Network QA/QC Guidelines The QA/QC components specified are the minimum requirements and network agencies may have more stringent specifications or more elaborate QA/QC procedures, as they deem appropriate for their jurisdictional requirements. This manual will be reviewed and revised periodically to reflect changing needs and concerns to be addressed by air quality monitoring programs in Canada. 6 Source: http://www.doksinet 5. NAPS Network QA/QC Program Elements The NAPS network is a cooperative program with shared responsibilities between Environment Canada and the network agencies. The elements of the NAPS quality assurance program, which form the basis for assessing the quality of the published data, are listed in Table 5.0 Table 5.0 NAPS Network QA/QC Elements and Management
1 2 3 4 5 6 7 8 9 10 5.1 QA/QC Element Plan, establish, develop and manage monitoring network programs - Measurement Methodology, Equipment Selection, Operating Conditions Site Selection - Spatial Scale of Representativeness - Site Classification, Distribution, Location, Separation Sampling System - Shelter Requirements - Probe Siting Criteria - Manifold Design Station and Analyzer Operation - Station Visits - Operating Procedures - Preventive Maintenance Calibration - Calibration Frequency - Calibration Procedures - Zero and Span Verifications Calibration and Reference Standards Station Performance and System Audits, and Inter-agency Verifications Data Validation and Formats Documentation - Site Documentation - Station Activities Log Book - Analyzer Operation and Maintenance Manual - Quality Assurance and Quality Control Manual Personnel Training and Technical Support Network and QA Planning and Management The Analysis and Air Quality Division of Environment Canada
coordinates the operation of the NAPS program, provides air monitoring instrumentation and reference standards, operates a laboratory for the chemical speciation of NAPS samples, directs a national quality assurance program, coordinates the development of equipment specifications for the monitoring network as a whole and maintains the Canada-wide Air Quality Database. The provincial, territorial and regional governments share in overall management of the NAPS Program, support the development of standardized methods, and are responsible for the ongoing operation and maintenance of monitoring stations and instrumentation, data acquisition and validation, and reporting within their jurisdictions. All network agencies have managers designated with the responsibility of overseeing 7 Source: http://www.doksinet network operations and quality assurance activities within their respective jurisdictions. Canadian Air Quality Standards and Objectives One of the key components of the NAPS
network is supporting the development of air quality standards and objectives. The network focuses on monitoring the following criteria pollutants to characterize ambient air quality: Sulphur Dioxide, Particulate Matter (PM2.5, PM10), Carbon Monoxide, Ozone, and Nitrogen Dioxide Other pollutants such as polyaromatic hydrocarbons (PAHs), volatile organic compounds (VOCs), and acid aerosols are also monitored in NAPS stations although there are no air quality objectives established for these pollutants at the present time. This data provides valuable information on the conditions and trends of the Canadian atmosphere. Measurement Methods, Analyzer Selection and Operating Specifications There are many recognized methods for measuring the criteria pollutants. The methodologies used in the NAPS network are chosen based on proven reliability and performance, ease of field operation and maintenance, and cost effectiveness. Instruments are also acquired based on “Performance-based Methods”
meaning a method for measuring an air quality parameter that is based on a desired performance specification rather than a strict procedure or product. Analyzers that satisfy the requirements of the United States Environmental Protection Agency (EPA) as equivalent or as reference methods for ambient air monitoring are selected for use in the network. When no such analyzers are available, analyzers with demonstrated effectiveness and accuracy could be used in the network. The operating characteristics of these non-equivalent instruments are to be documented and their performance continuously evaluated both in the field and in the laboratory. The minimum performance specifications for the ambient air gas analyzers are summarized in Appendix I. Table 513 lists the measurement methods and operating characteristics of the analyzers used in the NAPS network. Newly installed analyzers are to be calibrated prior to reporting data which are to be reviewed and compared with historical data, if
available. Table 5.13 Measurement Methods and Operating Specifications of NAPS Network Analyzers Pollutant Measurement Method Infrared Gas Filter Correlation Monitor Type Continuous Automated Operating Range 50 ppm Operating Temperature 15 °C - 35 °C Minimum Detection Limit 0.1 ppm Sulphur Dioxide (SO2) UV Fluorescence Continuous Automated 15 °C - 35 °C 0.002 ppm Nitrogen oxides (NOx) Chemiluminescence Continuous Automated 1.0 ppm or 0.5 ppm 1.0 ppm or 0.5 ppm 15 °C - 35 °C 0.002 ppm Carbon Monoxide (CO) 8 Source: http://www.doksinet Ozone (O3) UV Absorption Continuous Automated Particulate Matter (PM10, PM2.5) Virtual Impactors; gravimetric/filter; microbalance/filter; beta radiation attenuation. Manual GC/MSD Continuous Automated and manual gravimetric Organic compounds 5.2 Manual Canister 1.0 ppm or 0.5 ppm Agency specific as per operators’ procedures NA 15 °C - 35 °C 0.002 ppm See operating procedures in Annex 1.0 µg/m3 N/A N/A Site
Selection and Location The selection of sites for the NAPS network is done in consultation with network agencies to meet the network objective of producing air quality data representative for the geographic area of interest. The sites in the network are selected based on the requirements for distribution, location, separation and spatial scale of representativeness. Sites in the network are generally selected to represent where the population lives, plays and works. Air monitoring stations at these sites are meant to measure air quality trends over the long term and therefore are intended to have some degree of permanency. There are also stations established to characterize long range transport and trans-boundary movement of air pollutants. Depending on the specific reasons and purpose for monitoring, some or all of the air quality criteria pollutants may be monitored. Some stations are used by jurisdictions for air quality index (AQI) reporting, other stations are used for CWS
achievement determination or for trans-boundary transport monitoring or for special studies of local air pollution problems. Some of the stations are air pollution oriented but not sourcespecific oriented The goal is to provide the best assessment of the air quality or of an air pollution problem, for the general population, with the most efficiency. Site selection criteria for the CWS achievement determination monitors are outlined in “Guidance Document on Achievement Determination: Canada Wide Standards for Particulate Matter and Ozone” and the accompanying document “Ambient Air Monitoring Protocol”. 5.3 Sampling System The proper design of the sampling system in a monitoring station is essential for ensuring data quality. The temperature stability of the shelter, location of the sampling probe, manifold system design, length and composition of sample lines, and the composition of filters and fittings all may affect the integrity of the air sample and the resulting data
quality. The probe, manifold and sampling lines must be either Teflon or borosilicate glass. Teflon inlet filters of 5µm pore size should be used for all gaseous pollutant instruments. 9 Source: http://www.doksinet Shelter Requirements The shelter must protect the instrumentation from precipitation and excessive dust and dirt, environmental stress including vibration, corrosive chemicals, intense light, or radiation. The station meet regulations for occupational health and safety under Part II of the Canada Labour Code, for federal agencies, or the applicable provincial/territorial regulations, for provincial/territorial agencies. The electrical power system should meet electrical codes. Ground–fault-circuit-interrupters (GFCIs) should be used for sampling and monitoring equipment that are not sheltered. In general, the shelter temperature should be maintained between 20 C to 30 C, since most designated analyzers have been tested and qualified over that temperature range.
However, for some particulate monitors it is advisable to keep the temperature of the shelter below 25 C. Temperature fluctuations can affect analyzer drift which should be detected during zeroing and spanning. The station should be accessible throughout the year, be secured from unauthorized access and meet the sampling probe and siting criteria. The shelter must be equipped with an ABC type fire extinguisher, a first-aid kit, and the appropriate signage. Telecommunication service and equipment are required for data and voice communication. Probe Siting Criteria Prove siting criteria for NAPS stations have been established for the following parameters and are listed in Table 5.31 : 1. Probe height 2. Probe distance from roadways and other sources 3. Probe distance from airflow restrictions 4. Probe distance from trees 5. Minimum distance from roadways for O3 and NO2 analyzers 10 Source: http://www.doksinet Table 5.31 NAPS Network Probe Siting Criteria Pollutant Height Above
Ground (metres) Particulate Matter : 2 to 15 PM10, PM2.5 Distance from Supporting Structure (metres) Other Spacing Criteria 1 Vertical Horizontal >2 a. b. c. d. 3 to 15 >1 >1 a. b. SO2 c. d. e. CO 3 to 10 >1 >1 a. b. c. 3 to 15 >1 >1 O3 a. b. c. d. 3-15 >1 >1 a. > 20 metres from trees. Distance from the sampler to any air flow obstacle, i.e buildings, must be > 2×height of obstacle above the sampler. Unrestricted air flow in 3 of the 4 wind quadrants. No nearby2 furnace or incineration flues. > 20 metres from trees. Distance from the sampler to any air flow obstacle, i.e buildings, must be > 2×height of obstacle above the sampler. Unrestricted air flow in 3 of the 4 wind quadrants. No nearby2 furnace or incineration flues. Probe height must be > 0.8 of the mean height of surrounding buildings. > 10 metres from street intersections or at mid-block location. 2-10 metres from roadway. unrestricted air flow in 3 of 4 wind
directions. > 20 metres from trees. Distance from the sampler to any air flow obstacle, i.e buildings, must be > 2×height of obstacle above the sampler. Unrestricted air flow in 3 of the 4 wind quadrants. Distance from roadway varies with road traffic as specified in Table 5.32 > 20 metres from trees. b. Distance from the sampler to any air flow obstacle, i.e buildings, must be > 2×height of obstacle above the sampler. c. Unrestricted air flow in 3 of the 4 wind quadrants. d. Distance from roadway varies with road traffic as specified in Table 5.32 1 When a probe is located on a rooftop, this separation distance is in reference to walls, parapets, or penthouses located on the roof. 2 Distance depends on the height of furnace or incinerator flues, type of waste or fuel burned, and quality of fuel (sulphur and ash content). This is to avoid undue influences from nearby sources NO2 Table 5.32 Minimum Distance from Roadways for O3 and NO2 Analyzers Average Traffic
(vehicles per day) < 10,000 15,000 20,000 40,000 70,000 > 110,000 Minimum Distance between Roadway and Analyzer (metres) > 10 20 30 50 100 >250 11 Source: http://www.doksinet If a station does not meet all the parameters of the siting criteria, the non-conforming parameters should be documented. Manifold A manifold system is the recommended alternative to separate, long sampling lines. It is used to remove excess moisture from outside air before presenting it to analyzers which are connected into ports along the manifold. Typically in the NAPS network, the manifold is made of Pyrex glass. The material used for the manifold must be non– reactive with the pollutants of interest. If particulates are measured through the manifold, there must be a minimum number of bends to avoid impaction with the walls. A water trap should be installed in the manifold to prevent water from entering in the analyzers or samplers. The airflow through the manifold, as determined
by the blower capacity, must be sufficient to keep the residence time of the air sampled in the manifold to below 20 seconds. The air flow through the manifold must not be so great as to cause the pressure inside the manifold to be more than one inch of water below ambient. These last two conditions are in opposition to each other, but can be assessed as follows. Construct the manifold. Use a pitot tube to measure the flow of the sample inside the manifold. At the same time, attach a water manometer to a sampling port Turn on the blower and measure the flow rate and the vacuum. (Remember to allow for the air demand of the instrumentation.) Adjust the flow rate to fit between these two parameters. If this is impossible, the diameter of the manifold is too small Another type of manifold that is widely used is the “ARB” type manifold. Further information on manifolds is found in Appendix II. 5.4 Station and Analyzer Operation Station and analyzer operation is the responsibility of
the network agencies and is overseen by the network manager. Operation of the station includes regularly scheduled station visits, instrument zero and span verifications, calibrations, preventive maintenance and documentation. Table 54 summarizes the recommended minimum frequency of NAPS Station Work Activities. 12 Source: http://www.doksinet Table 5.4 Summary of NAPS Station Work Activities Tasks in the Operation Work Performed By of NAPS Station Regular Site Visitation Station Operator Zero and Span Verification Station Operator or Calibration technician Analyzer Calibration Calibration Technician Internal Performance and System Audit Agency Auditor or Technician other than the operator of the station External Performance and Auditors from Environment System Audit Canada or other agency Minimum Frequency for this Work Weekly Weekly Every 6 months; after repairs are made to the analyzer; and when an analyzer is installed at the station Every 6 months Every two years Station
Visits One of the main purposes of monitoring station visits is to verify the proper operation of the monitoring equipment and of data acquisition systems to ensure the collection of valid and complete data. A second important purpose is to verify the continued safe and secure environment at the station. Regular visits on a minimum weekly basis are recommended to verify the safe unattended operation of the monitoring equipment using pumps and compressed gas cylinders and to verify the outdoor sampling and monitoring equipment. Diagnostic tests, which can be performed remotely on various monitoring equipment and station parameters, complement the station visit verifications. Station visits should be documented in the site logbook. The following is a list of activities to be performed at the station: • Examine the external station conditions including the inlet probe for damage or blockage. Periodically review the station characteristics for any change or modification to the station.
• Examine the manifold, the transfer lines and the inlet filters for dirt buildup and replace or clean as required. Examine the seals in the sampling system, the scrubbing and drying agents and replace as required. • Perform zero and span verifications on analyzers. Record values on the control chart. Note abnormal deviations Calibration is required when the instrument is out of control. Manual zero adjustments are acceptable when an appropriate zero source is used and the adjustments are documented and the telemetry system is re-configured as required. Refer to Appendix III for the construction of control charts. • Replace zero and span cylinders when pressure is below 1,500 13 Source: http://www.doksinet kPa (215 psig). • Perform preventive maintenance as prescribed in the operations and maintenance manuals. Analyzer Operation Monitoring and sampling instruments are to be operated according to procedures described in the operation manuals. The procedures are
requirements of the Quality Assurance and Quality Control guidelines. The general operating specifications of the analyzers are listed in Table 5.13 Data Acquisition Air quality data are collected using data acquisition systems. Some systems simply log data while others also display data numerically and graphically which serves as a diagnostic tool for analyzing unusual analyzer responses. Preventive Maintenance Preventive maintenance as specified in the operation and maintenance manuals should be followed. Some of the procedures should be preceded by and followed by a zero and span verification. Preventive maintenance increases data capture, improves system reliability, and assists in identifying any potential problems and corrections before failures occur. 5.5 Traceability of Calibration and Reference Standards Materials and devices used for calibrating NAPS analyzers, samplers and monitors must be certified for accuracy against reference standards that are traceable to recognized
national primary standards. Standard Reference Materials (SRMs) for gaseous pollutants, and traceable reference standards for ozone, temperature, pressure, flow rate, and voltage are maintained by the Analysis and Air Quality Division (AAQD) at Environment Canada’s Environmental Technology Centre (ETC). These serve as NAPS program reference standards, and periodic recertification of field standards against these reference standards is required in order for the field standards to serve as traceable NAPS transfer standards. Recertification of transfer standards for sulphur dioxide, carbon monoxide and nitric oxide against appropriate SRMs is required every two years. Recertification of field calibrators, ozone transfer standards, flow meters and other flow devices against NAPS reference standards is required annually. Environment Canada’s SRMs for gaseous pollutants, except ozone, are acquired from the United States National Institute of Standards and Technology (NIST). Traceability
of a standard reference photometer (SRP) for ozone measurement is maintained by periodic direct intercomparison to other, equivalent ozone photometers manufactured by 14 Source: http://www.doksinet NIST. Traceability of all other NAPS program reference standards is maintained by periodic recertification of these standards against higher level standards. NAPS reference standards for temperature, pressure, flow rate (low flow) and voltage are traceable to the corresponding national primary standards at the National Research Council of Canada’s Institute for National Measurement Standards (NRC-INMS). A high flow rate volumetric standard is referenced to a transfer standard at Industry Canada, which is traceable to the Industry Canada national primary standard. A list of the SRMs and reference standards is presented in Table 5.5 Table 5.5 List of SRMs and Reference Standards for the NAPS Network Calibration Material/Reference Standard Ozone Reference Standard Traceable Primary
Standard NIST Industry Canada 4 High Volume Rotary Flow Meter (0.5 to 20 m³/min.) Low Volume Flow Meter (2 cc/min. to 30,000 cc/min.) Voltage Standard 5 Temperature Standard NRC-INMS 6 Pressure Standard NRC-INMS 7 NO in N2 gas mixture NIST 8 SO2 in N2 gas mixture NIST 9 CO in N2 gas mixture NIST 10 SO2 permeation devices Traceable to Transfer Standard 1 2 3 NRC-INMS NRC-INMS Application Certification Frequency Certification of ozone transfer standards and ozone analyzers Certification of high volume transfer standards Certification of low volume transfer standards Certification of Voltmeters and in-lab instrument calibrations Certification of Transfer Thermometers and inlab instrument calibrations Certification of field barometers and in-lab instrument calibrations Calibration of field analyzers Calibration of field analyzers Calibration of field analyzers Spanning of field analyzers Annually and on request, ozone transfer standards in the field are
certified by Environment Canada in Ottawa. Annually and on request, high volume transfer devices are certified by Environment Canada in Ottawa Annually and on request, low volume transfer devices are certified by Environment Canada in Ottawa On request voltage transfer devices are certified by Environment Canada in Ottawa On request transfer thermometers are certified by Environment Canada in Ottawa On request transfer barometers are certified by Environment Canada in Ottawa Biennial certification by Environment Canada. Biennial certification by Environment Canada. Biennial certification by Environment Canada. Available on request from Environment Canada. Permeation devices are calibrated in situ by reference to the SO2 calibration gas transfer standard used in the field. 5.6 Calibrations Multipoint calibrations in combination with zero and span data are used in evaluating analyzer performance and establishing data validity. Network agencies perform multipoint calibrations at maximum
intervals of six months and following span drifts of greater than ±15%. When control charts are used, multipoint calibrations are performed following span drifts of greater than three standard deviations 15 Source: http://www.doksinet of the span control value. The accuracy of multipoint calibrations is considered to be within ±4% (worst case) of laboratory multipoint calibrations using primary standards (revised in 2004 from ±6%). Analyzer Calibration Frequencies The following is the minimum recommended calibration frequencies: • • • • • After initial installation before logging data. Six month intervals for all analyzers When span drifts exceed ±15%, or when using control charts, 3 standard deviations of the span control value. For new analyzers, recalibration after 3 months of operation is recommended. After major repairs. Calibration Procedures The calibration procedures in the analyzer operation manuals and the procedures in Appendix IV, which are part of these
QA/QC guidelines, should be followed. Analyzers are generally calibrated dynamically with one zero point and a minimum of three, but preferably four, upscale points covering the operating range. The upscale points can be at 20%, 40%, 60% and 80% of full scale or at 10%, 20%, 40% and 80% of operating range. These points are used to construct a calibration curve using regression analysis. Dynamic calibration is usually accomplished by means of a gas dilution system with gas phase titration or a permeation system. The calibration gas must be of certified concentration traceable to a primary standard reference material (SRM). The calibrator source gas and the diluent air flow readings must be certified traceable to a primary standard (see Table 5.5) The zero air source for gas dilution must be scrubbed of interfering pollutants by a properly maintained scrubbing system. Some dilution calibrators use gas cylinders as source materials while others use permeation devices or a combination of
both. Procedures for specific calibrators are complementary to the general recommended procedure and must be followed. Calibration of low volume samplers is accomplished by use of traceable flow standards, pressure standards and temperature standards. Calibration of continuous particulate matter monitors (e.g TEOM, BAM) must be accomplished as specified by the operating manual and the applicable standard operating procedures (SOP). Analyzer Zero and Span Verifications Zero and span verifications are used for assessing analyzer performance and calibration stability. The verifications should be done at least weekly on all continuous gas analyzers. A deviation of greater than ±15% from the control value of the last 16 Source: http://www.doksinet calibration requires a multipoint calibration. Automatic zero and span verifications should be scheduled during early morning hours unless pollutant levels at the site during those hours are of concern. Zero and span procedures described in
the analyzer operation manuals and Appendix VI should be followed. A zero and span control chart for the analyzer should be constructed as per the procedures in Appendix III. When the analyzer is out of control, recalibration is required The cause of the out of control event should be identified, rectified and documented. The analyzer should be serviced promptly or replaced to minimize the loss of data. 5.7 Inter-agency Testing and Audits Inter-agency Testing The purpose of inter-agency testing and performance audits is to detect any systematic bias in the measurements of the network agencies. An inter-agency testing program for gas concentration measurement is conducted periodically. Gas mixtures of NO, SO2 and CO are sent to all network agencies for blind analyses. The gas mixture concentrations being higher than the analyzer range requires the network agencies to use gas dilution systems for the analyses. The gas mixture concentrations which are verified against the NIST standards
at the NAPS QA laboratory are used as benchmarks for data comparisons. The results from these analyses provide a performance measure of the network agencies’ calibration systems and procedures. Deviations within ±6% of benchmark values are considered acceptable. Inter-agency Testing Procedures Test gases in aluminum cylinders are certified in the NAPS QA Laboratory against primary SRMs and their concentrations are verified for stability after storage at room temperature for one month. Values within ±3% of the test gases are considered of sufficient stability for the program. Test gases of NO in N2, SO2 in N2 and CO in N2 are used. Gases are certified once again before shipping to the network agencies. These values are taken as the out concentrations. Network agencies are requested to analyze the gases within a two week time frame and return the cylinders to the ETC in Ottawa immediately after analysis. Upon return, each test gas is re-verified to obtain the in concentration The
benchmark concentration is the average of the out and in concentrations. The set up requirements for the test are detailed in the Inter-agency Test Procedures that accompany the test gases. All network agencies are required to use this set up to avoid any procedural variation. 17 Source: http://www.doksinet Analyzer Performance Audits Performance audits are independent evaluations of data quality and are performed in addition to the normal quality control activities of the network agencies. In addition to auditing instrument performance, system audits are conducted at the site to verify compliance with siting criteria and sampling system requirements. Analyzer Performance Audit Procedures The audit procedures consist of challenging the analyzers with known gas concentrations at the zero and four upscale levels normally at 20%, 40%, 60% and 80% of the analyzer measurement range. No adjustments are made on the analyzer and inlet filters are not changed before the audit. The data
collected by the data acquisition system during the audit is either flagged or not logged. The operator is informed of the time intervals during which the instruments were audited. The audit gases and measurement devices used for auditing are certified against the SRM and reference standards maintained in the NAPS QA laboratory. Analyzer measurements are taken at the analyzer output terminals using a certified digital voltmeter and are compared with the data logger readings. Measurements are taken after a stabilization period of 20 minutes for each audit point. The audit points are used for regression analysis where the slope, intercept and correlation coefficient are calculated. A copy of the results is left with at the site for the operator. A more detailed report with observations by the auditors on the overall condition of the site and recommendations for corrective action if required, is sent to the operating agency normally within one month of the audit. The Pass/Fail criteria of
the analyzer performance are a slope within the range of 0.85 to 1.15 and an intercept of within ±3% of range The Pass/Fail criteria of particulate matter samplers and monitors are flow rates within ±10% of the specified value. Performance outside these ranges requires corrective action which is investigated jointly by Environment Canada and the operating agency, and documented. Normally, two to three sites from each operating agency are audited at two-year intervals and so scheduled to maximize the effectiveness of the Quality Assurance program. System Audits A system audit is performed concurrently with the performance audit and is a review of the site parameters that may be used for site characterization and site documentation and may also include a review of quality control activities. 5.8 Data Review and Validation This section and Appendix VIII are under revision. 18 Source: http://www.doksinet 5.9 Documentation Site Documentation The following site parameters will be
updated in the NAPS database: • • • • • • • • Station identification. Station name and address. City, including the borough or municipality. Analyzer type and ownership. Site description including scale of representativeness, land use, elevation, average building height, air flow restrictions, manifold, and the nearest meteorological station. Site influences including localized sources, roadway influences and major point sources. Site map or aerial photograph of the area. Photographs from the manifold inlet showing the north, east, south and west directions. The information in the NAPS database supersedes the information published in a document titled Site Documentation for NAPS Network Air Monitoring Stations, Environment Protection Directorate, Environment Canada, January 1988, (reference 6). Station Log Book A logbook and/or log sheets should be used to record any activity at the site or events and occurrences that may affect the air quality data. Analyzer
Operation and Maintenance Manuals The operation and maintenance procedures described in the operation manuals are a requirement of the QA/QC guidelines. A copy of the manuals should be kept at the station. 5.10 Training Requirements There is no formal training program specifically for NAPS network staff. Often, more experienced staff will provide training to newer staff. Most equipment manufacturers offer training classes and seminars in Canada or at their manufacturing facility. A host of air quality related training courses are offered through EPA’s Air Pollution Distance Learning Network (APDLN). The Analysis and Air Quality Division of Environment Canada periodically coordinates seminars in Canada offered by manufacturers or their Canadian distributors and offer some limited training more specifically on the installation and operation of new types of monitoring equipment. 19 Source: http://www.doksinet Personnel Qualifications Personnel assigned to ambient air monitoring
activities are expected to have met the educational, work experience, responsibility, personal attributes and training requirements for their positions. Training Adequate education and training are integral to any monitoring program that strives for reliable and comparable data. Training is aimed at increasing the effectiveness of employees and their organization. Appropriate training should be available to employees supporting the Ambient Air Quality Monitoring Program, commensurate with their duties. Such training may consist of classroom lectures, workshops, teleconferences and on-the-job training. Suggested Training Courses Over the years, a number of courses have been developed for personnel involved with ambient air monitoring and quality assurance aspects. Formal QA/QC training is offered through the following organizations: Air Pollution Training Institute (APTI) http://www.epagov/airprogm/oar/oaqps/eog/aptihtml Air & Waste Management Association (AWMA) http://www.awmaorg
American Society for Quality Control (ASQC) http://www.asqcorg/products/educathtml EPA Institute EPA Quality Assurance Division (QAD) http://es.epagov/ncerqa/qa/ The following provides a suggested sequence of core QA-related ambient air monitoring courses for ambient air monitoring staff, and QA managers (marked by asterisk). The suggested course sequences assume little or no experience in QA/QC or air monitoring. Course Title 1* Air Pollution Control Orientation Course (Revised), SI:422 APTI 2* Principles and Practices of Air Pollution Control, 452 APTI 3* Orientation to Quality Assurance Management QAD 4* Introduction to Ambient Air Monitoring (Under Revision 7/98), SI:434 APTI 5* General Quality Assurance Considerations for Ambient Air Monitoring (Under Revision 9/98), APTI SI:471 6* Quality Assurance for Air Pollution Measurement Systems (Under Revision 8/98), 470 APTI 7* Data Quality Objectives Workshop QAD 8* Quality Assurance Project Plan QAD 9 Atmospheric Sampling (Under
Revision 7/98), 435 APTI 10 Analytical Methods for Air Quality Standards, 464 APTI 11 Chain Of Custody Procedures for Samples and Data, SI:443 APTI * Data Quality Assessment QAD * Management Systems Review QAD * Beginning Environmental Statistical Techniques (Revised), SI:473A APTI 20 Source: http://www.doksinet * Introduction to Environmental Statistics, SI:473B APTI * Quality Audits for Improved Performance AWMA * Statistics for Effective Decision Making ASQC SI = self instructional 6. References 1. 2. Criteria for National Air Quality Objectives- Sulphur Dioxide, Suspended Particulates, Carbon Monoxide, Oxidants ( Ozone ) and Nitrogen Dioxide; Reports to the FederalProvincial Committee on Air Pollution (1971 and 1973) by The Subcommittee on Air Quality Objectives; Nov. 1976 Quality Assurance Handbook for Air Pollution Measurement Systems, Vol. I and II, US Environmental Protection Agency, EPA-600/4-77/027a. 3. GEMS/AIR Methodology Reviews Vol. 1: Quality Assurance in Urban
Air Quality Monitoring; WHO/EOS/94.1, UNEP/GEMS/94A2; UNEP Nairobi 4. GEMS/AIR Methodology Reviews Vol. 2: Primary Standard Calibration Methods and Network Calibrations for Air Quality Monitoring; WHO/EOS/94.2, UNEP/GEMS/94A3; UNEP Nairobi. GEMS/AIR Methodology Reviews Vol. 3: Measurement of Suspended Particulate Matter in Ambient Air; WHO/EOS/94.3, UNEP/GEMS/94A4; UNEP Nairobi Site Documentation for NAPS Network Air Monitoring Stations; Environment Protection Directorate, Environment Canada, January 1988. Interlaboratory Testing Procedures; Pollution Measurement Division, Environmental Technology Advancement Directorate, Environment Canada, 1995. Quality Assurance Manual for An Air Pollution Measurement System; Pollution Control Division, Air Quality Control Branch, Alberta Ministry of the Environment. Atmospheric Analyzer Audit and Calibration Manual; 3rd Edition, Instrumentation Unit, Air Resources Branch, Ontario Ministry of the Environment. McQuaker, N. R, Calibration and
Operation of Continuous Ambient Air Monitors; ISBN 07719-9211-4, British Columbia Ministry of the Environment 1983 Guidance Document on Achievement Determination - Canada-Wide Standards for Particulate Matter and Ozone; Canadian Council of Ministers of the Environment (CCME), 2001 5. 6. 7. 8. 9. 10. 11. 21 Source: http://www.doksinet 7. Abbreviations and Acronyms CMA CA CSD CWS EC EPA ETC GPT Hi-Vol INMS NAPS NCR NIST NRC ppm ppb QA/QC RA RSA SRM SSI TSP UV Census Metropolitan Area Census Agglomeration Census Sub-Division Canada Wide Standard Environment Canada Environmental Protection Agency Environmental Technology Centre Gas Phase Titration High Volume Institute for National Measurement Standards National Air Pollution Surveillance National Capital Region National Institute of Standards and Technology National Research Council parts per million parts per billion Quality Assurance/Quality Control Reporting Area Reporting Sub-Area Standard Reference Material Size Selective
Inlet Total Suspended Particulates Ultraviolet 22 Source: http://www.doksinet 8. Glossary Performance Audit An independent quantitative evaluation of a measurement system by an auditor to determine whether quality objectives are met. Quality Assurance A system of activities that assures a measurement meets a defined standard of quality. Quality Control The operational techniques and procedures used to achieve quality requirements. Reference Standard A gas mixture whose concentration or an instrument whose accuracy is known and is accepted as accurate within a defined degree of confidence by verifying it against a standard reference. It can be used as a laboratory standard or as a transfer standard but not for both purposes. Standard Reference Material A material or gas mixture whose composition is known and is taken as the standard to which all other gas mixtures are compared. In the NAPS network this refers to the NIST standard reference material. Transfer Standard A
material whose concentration or an instrument whose accuracy is known to a defined degree of confidence by verifying it against a standard reference. It is used in the field for comparison and analytical purposes. Validation Confirmation by examination and provision of objective evidence that particular requirements are met in obtaining the measurement. This involves checking every aspect of the measurement procedure including measurement method, calibration, quality control methods and data processing. Zero Air A gas mixture that is scrubbed of contaminants to a concentration below the detection limit of the analyzer being calibrated. It is used synonymously with zero gas 23 Source: http://www.doksinet Appendix I Performance Specifications for Ambient Air Gas Analyzers Where applicable, all analyzers in the network must be approved by the US EPA as an equivalent method of measurement for a specific pollutant. The typical performance specifications of NAPS ambient air gas
analyzers are shown in Table I-1. Table I-1 Performance Specifications for NAPS Ambient Air Gas Analyzers Performance Parameter Minimum Detection Limit Precision Linearity Zero Drift / 24 hours Span Drift / 24 hours Noise Rise Time ( 95% ) Fall Time ( 95% ) Operating Temperature Range Operating Humidity Range Maximum Cycling Time Normal Operating Ranges Operating Voltage Pollutant Carbon Monoxide 0.1 ppm ± 0.1 ppm 1% F.S ±0.2 ppm ± 1% F.S ± 0.05 ppm 90 sec. 90 sec. 10° - 40° C 100% 1 min. 50 ppm 105-125 vac / 60 Hz Ozone 0.002 ppm ± 0.002 ppm 1% F.S ±0.002 ppm ± 1% F.S ± 0.001 ppm 90 sec. 90 sec. 10° - 40° C 100% 1 min. 0.5 ppm or 10 ppm 105-125 vac / 60 Hz Oxides of Nitrogen 0.005 ppm ± 0.002 1% F.S ±0.002 ppm ± 1% F.S ± 0.002 ppm 180 sec. 180 sec. 10° - 40° C 100% 3 min. 0.5 ppm or 10 ppm 105-125 vac / 60 Hz SulphurDioxide 0.002 ppm ± 0.002 ppm 1% F.S ±0.002 ppm ± 1% F.S ± 0.001 ppm 180 sec. 180 sec. 10° - 40° C 100% 3 min. 0.5 ppm or 10 ppm 105-125 vac /
60 Hz Recommended measurement units of the analyzers are parts per million (ppm) or parts per billion (ppb) by volume. For conversion between mass units and volume the reference temperature and pressure are 25° C and 760 mmHg. The performance parameters are defined as follows: Minimum Detection Limit The lowest concentration that can be detected by the air analyzer with confidence. It is defined as twice the noise level of the analyzer. It is used synonymously with the lower detection limit in this document. Precision The degree of variation about the mean of repeated measurements of the same pollutant concentration by the analyzer, expressed as standard deviation about the mean. Linearity The maximum deviation between the actual analyzer output reading and the predicted analyzer output from a least square fit to the actual readings. Zero Drift The change in analyzer output response to a 24 Source: http://www.doksinet constant zero air input concentration over a period of
unadjusted continuous operation. Span Drift The percent change in analyzer output response to a constant upscale pollutant concentration over a period of unadjusted continuous operation. Noise Spontaneous short duration deviations in the analyzer output, about the mean output, which are not caused by input concentration changes. Rise Time To 95% The time interval between initial response (the first observable change in analyzer output) and a level of signal output which is 95% of the steady state output after a step increase in input concentration. Fall Time To 95% The time interval between initial response (the first observable change in analyzer output) and a level of signal output which is 95% of the steady state output after a step decrease in input concentration. Operating Temperature Range The minimum and maximum ambient temperature, of the environment surrounding the analyzer, in which the analyzer will meet all performance specifications. Operating Humidity Range The
maximum level of moisture content of the ambient air in the environment surrounding the analyzer, in which the analyzer will meet all performance specifications. Cycling Time The time required to complete the active measurement cycle (sample collection, analysis and measurement) and to produce an output. Operating Ranges The ranges which correspond to the full scale output of the analyzer. Operating Voltages The minimum and maximum line voltages in which the analyzer will meet all performance specifications. 25 Source: http://www.doksinet Appendix II Manifold Design for NAPS Sampling System The following information is from the US EPA Quality Assurance Handbook (reference 2): Some important variables affecting the sampling manifold design are the diameter, length, flow rate, pressure drop, and materials of construction. Considerations for these parameters are discussed below for both a vertical laminar flow and a conventional manifold design. Vertical laminar flow design - By
the proper selection of a large diameter vertical inlet probe and by maintaining a laminar flow throughout, the sample air is not permitted to react with the walls of the probe. Numerous materials such as glass, PVC plastic, galvanized steel, and stainless steel, can be used for constructing the probe. Removable sample lines constructed of Teflon or glass can be used to provide each device with sample air. Inlet probe diameters of 15 cm with a flow rate of 150 L/min are necessary if diffusion losses and pressure drops are to be minimized. The sampling rate should be maintained to insure laminar flow conditions. This configuration has the following advantages: • a 15-cm pipe can be cleaned easily by pulling a cloth through it with a string • sampling ports can be cut into the pipe at any location and, if unused, can be plugged with stoppers of similar composition • metal poses no breakage hazard < there is less potential for sample contamination than there is with smaller tubes
Conventional manifold design - In practice, it may be difficult to achieve vertical laminar flow because of the elbows within the intake manifold system. Therefore, a conventional horizontal manifold system should be constructed of inert materials such as Pyrex glass and/or Teflon, and in modular sections to enable frequent cleaning. The system consists of a vertical "candy cane" protruding through the roof of the shelter with a horizontal sampling manifold connected by a tee to the vertical section. Connected to the other vertical outlet of the tee is a bottle for collecting heavy particles and moisture before they enter the horizontal section. A small blower, 1700 L/min at 0 cm of water at static pressure, is at the exhaust end of the system to provide a flow through the system of approximately 85 to 140 L/min. Particulate monitoring instruments, such as BAMs and TEOMs, each have separate intake probes that are as short and as straight as possible to avoid particulate
losses due to impaction on the walls of the probe. In Figures II-1 and II-2, typical designs for a vertical and a horizontal sampling manifold are shown. 26 Source: http://www.doksinet 1 to 2 meters Roof Blower Motor Flexible Hose Water and Large Particulate Trap Stainless Steel Screens Inverted U Bend Inlet Vertical Inlet Both Vertical and Inverted Sampling Inlets are Acceptable Figure II-1 Typical Vertical Manifold 27 Source: http://www.doksinet 1 to 2 meters Blower motor Roof Water and Large Particulate Trap Stainless Steel Screens Inverted U Bend Inlet Vertical Inlet Both Vertical and Inverted Sampling Inlets are Acceptable Figure II-2 Typical Horizontal Manifold 28 Source: http://www.doksinet “ARB” Manifold Another type of manifold that is being widely used is known as the “ARB” style manifold. This manifold has a reduced profile, i.e, there is less volume in the cane and manifold, therefore, there is less of a need for bypass flow. These
manifolds allow the user more options than the other conventional manifolds. If the combined flow rates are high enough with the instruments at the monitoring location, by-pass flow devices such as blower motors are not required. Residence time Determination: The residence time of pollutants within the sampling manifold is critical. Residence time is defined as the amount of time that it takes for a sample of air to travel from the opening of the cane to the inlet of the instrument and is required to be less than 20 seconds for reactive gas monitors. It is recommended that the residence time within the manifold and sample lines to the instruments be less than 10 seconds. If the volume of the manifold does not allow this to occur, then a blower motor or other device (vacuum pump) can be used to decrease the residence time. The residence time for a manifold system is determined in the following way. First the volume of the cane, manifold and sample lines must be determined using the
following equation: Total Volume = Cv +Mv + Lv Where: Cv = Volume of the sample cane and extensions Mv = Volume of the sample manifold and trap Lv = Volume of the instrument lines Positions of calibration line in sampling manifold Each of the components of the sampling system must be measured individually. To measure the volume of the components, use the following calculation: V = pi * (d/2) L 2 Where: V = volume of the component pi = 3.14159 L = Length of the component d = inside diameter Once the total volume is determined, divide the volume by the flow rate of all instruments. This will give the residence time If the residence time is greater than 10 seconds, attach a blower or vacuum pump to increase the flow rate and decrease the residence time. It has been demonstrated that there are no significant losses of reactive gas (O3) concentrations in conventional 13 mm inside diameter sampling lines of glass or Teflon if the sample residence time is 10 seconds or less. This is true
even in sample lines up to 38 m in length, which collect substantial amounts of visible contamination due to ambient aerosols. However, when the sample residence time exceeds 20 seconds, loss is detectable, and at 60 seconds the loss is nearly complete. Placement of tubing on the Manifold: If the manifold that is employed at the station has multiple ports then placement of the instrument lines can be crucial. It is suggested 29 Source: http://www.doksinet that instruments requiring lower flows be placed towards the bottom of the manifold. The general rule of thumb states that the calibration line (if used) placement should be in a location so that the calibration gases flow past the instruments before the gas is evacuated out of the manifold. Placement of Probes and Manifolds Probes and manifolds must be placed to avoid introducing bias to the sample. Important considerations are probe height above the ground, probe length (for horizontal probes), and physical influences near the
probe. Some general guidelines for probe and manifold placement are: • probes should not be placed next to air outlets such as exhaust fan openings • horizontal probes must extend beyond building overhangs • probes should not be near physical obstructions such as chimneys which can affect the air flow in the vicinity of the probe • height of the probe above the ground depends on the pollutant being measured. 30 Source: http://www.doksinet Appendix III Zero and Span Verifications for Ambient Air Gas Analyzers A zero and span verification is an unofficial" check of an analyzers response. It may include dynamic checks made with uncertified test concentrations, artificial stimulation of the analyzers detector, electronic or other types of checks of a portion of the analyzer, etc. Zero and span checks are not to be used as a basis for analyzer zero or span adjustments, calibration updates, or adjustment of ambient data. They are intended as quick, convenient checks to be
used between calibrations to check for possible analyzer malfunction or calibration drift. Whenever a zero and span check indicates a possible calibration problem, a multipoint calibration should be carried out before any corrective action is taken. If a zero and span check is to be used in the quality control program, a “reference response” for the check should be obtained immediately following a multipoint calibration while the analyzers calibration is accurately known. Subsequent check responses should then be compared to the most recent reference response to determine if a change in response has occurred. For automatic zero and span checks, the first scheduled check following the calibration should be used for the reference response. It should be kept in mind that any check that involves only part of the analyzers system cannot provide information about the portions of the system not checked and therefore cannot be used as a verification of the overall analyzer calibration.
Physical Zero and Span Adjustments Almost all ambient monitoring instruments have physical means by which to make zero and span adjustments. These adjustments are used to obtain the desired nominal scale range (within the instruments specifications), to provide convenient (nominal) scale units, and to periodically adjust the instruments response to correct for calibration drift. Note: NO/NO /NO analyzers may not have individual zero and span controls for each channel. If that is the case, the zero and span controls must be adjusted only under the conditions specified in the calibration procedure provided in the analyzers operation/instruction manual. Precise adjustment of the zero and span controls may not be possible because of: (1) limited resolution of the controls, (2) interaction between the zero and span controls, and (3) possible delayed reaction to adjustment or a substantial stabilization period after adjustments are made. Precise adjustments may not be necessary because
calibration of the analyzer following zero and span adjustments will define the precise response characteristic (calibration curve). Accordingly, zero and span adjustments must always be followed by a calibration. Allow sufficient time between the adjustments and the calibration for the analyzer to fully stabilize. This stabilization time may be substantial for some analyzers. Also, obtain unadjusted response readings before adjustments are made. Zero and span adjustments do not necessarily need to be made at each calibration. In fact, where only relatively small adjustments would be made, it is probably more accurate not to make the adjustments because of the difficulty of making precise adjustments mentioned earlier. An appropriate question, then, is how much zero or span drift can be allowed before a physical zero or span adjustment should be made to an analyzer? Ideally, all ambient measurements obtained from an analyzer should be calculated or adjusted on the basis 31 Source:
http://www.doksinet of the most recent multipoint calibration or on the basis of both the previous and subsequent calibrations. Zero and Span Control Charts Zero and span control charts are used to monitor the performance of analyzers. Essentially they show analyzer response to zero and span gas, and alert the operator to conditions when corrective action is required. There are many ways to construct control charts. An example of control charts is shown in Figure III-1 For newly installed analyzers, a more frequent zero and span period is recommended to establish the drift characteristics of the instrument. A daily or biweekly period may be used. Once the drift characteristics are established, a less frequent schedule may be used. A minimum schedule of once per week is recommended for all continuous analyzers. In order to observe any negative zero drifts, the zero point of the calibration may be offset by a known positive amount. 32 Source: http://www.doksinet Zero and Span
Control Chart Station ID Pollutant Analyzer ID s/n DATE ZERO SPAN ( SPAN - ZERO ) 1 DRIFT PERIOD 2 3 4 5 6 7 8 9 10 11 12 13 14 15 16 17 18 19 20 21 22 23 24 25 26 27 Vertical Range 1 Division = ppb/ppm +5 Zero Drift 0 -5 +5 Span Drift -5 Vertical Scale 1 Division = 0 ppb/ppm/% Span Standard Concentration= ppm/ppb Zero Drift Control Limits ± ppb/ppm Date Analyzer Calibrated Span Drift Control Limits ± ppb/ppm/% Operator Figure III-1 33 28 29 30 31 32 33 34 Source: http://www.doksinet Appendix IV General Calibration Procedures for Ambient Air Gas Analyzers It is beyond the scope of these guidelines to provide detailed calibration procedures for all analyzers in use. The following are general procedures recommended for the calibration of analyzers in the NAPS
network. These are in addition to the procedures specified in analyzer operation manuals. Certified transfer standards traceable to the (U.S) National Institute of Standards and Technology (NIST) or the (Canadian) Institute of National Measurement Standards (INMS) must be used for all analyzer calibrations. 1. Allow the calibrator to warm up to its operating temperature prior to calibration For permeation systems, allow the system to equilibrate at operating conditions, can take up to 24 hours. 2. When using gas cylinders, purge the pressure regulator and lines as follows: a) Attach the regulator to the calibration gas cylinder and connect a transfer line of inert material of either stainless steel or Teflon from the regulator to the vacuum side of an air pump. Connect a transfer line to the pressure side of the pump to vent the high concentration calibration gas outside the station. b) Turn the pump on. c) Open the regulator valve to evacuate the regulator for 60 seconds. d) Close the
regulator valve and then slowly open the cylinder valve to fill the regulator with calibration gas. (The pump should be left running during this procedure.) e) Close the cylinder valve then open the regulator valve to evacuate the regulator again for 60 seconds. f) Repeat steps d, and e, twice. g) Close the regulator valve. h) Connect a 1/8” transfer line from the purged regulator to the gas inlet of the calibrator (stainless steel recommended for SO2). i) Slowly open the cylinder valve and verify that the regulator out pressure is within calibrator specifications. j) Slowly open the regulator valve. 3. Using a reducer, connect a 3/8” transfer line from one of the calibrator manifold ports to the atmosphere, outside the station, to vent the excess gas. For calibrators without manifolds, use a Tee reducer to connect the 3/8” vent line to the calibrator. Venting outside the station minimizes entrainment of ambient air and reduces the risk of exposure to high gas concentrations
which could be harmful. The length to diameter ratio of the vent line must be at least ten to prevent entrainment of ambient air. 4. Connect a ¼” transfer line from one of the calibrator ports to the analyzer inlet Plug extra manifold ports. For calibrators without manifolds, connect a ¼” transfer line from the Tee reducer to the analyzer inlet. 34 Source: http://www.doksinet 5. Set the calibrator total gas flow output to at least 15 times the intake flow rates of the analyzer(s) connected to the calibrator. The level of excess flow rate, and the length and diameter of the vent line affect system pressurization, which must be avoided. 6. Set the calibrator to produce zero gas 7. Measure the analyzer zero reading and, after verifying stability for 10 minutes, set the analyzer reading to zero. 8. Set the calibrator to generate a concentration equal to about 80% of the selected analyzer range. Measure the analyzer response and, after verifying stability for 10 minutes, set the
analyzer to read the generated concentration value. Verify that the reading remains stable within ± 1% of the set concentration value. 9. Set the calibrator to produce zero gas and re-verify the analyzer zero setting If an adjustment of the zero setting is required, repeat step 8. After the zero and the 80% of range responses are set, introduce gas concentrations of 80%, followed by 60%, 40%, and 20% of range, verifying stability for 10 minutes at each point. 10. Document the pertinent calibration results in the calibration report and in the station logbook. 11. After calibration, reconfigure the analyzer for normal operation 12. Zero and span the analyzer and record the values in the calibration report and station logbook. The span cylinder should be replaced if the span records indicate excessive instability, or if the pressure falls below 300 psi. If a new cylinder is used, its span value should be measured as above and recorded in the calibration report and station logbook. The
above also applies when permeation devices are used for zeroing and spanning. For NOX analyzers, the NO2 channel must also be calibrated, by gas phase titration (GPT) or permeation tube. Ozone analyzers in the NAPS Network are calibrated against a UV photometry ozone transfer standard. The above procedure also applies to ozone calibration, except as they relate to gas cylinders. Following calibration, the analyzer’s internal span function is used to determine the post-calibration span control value. Least Square Regression Analysis for Validation / Correction of Analyzer Data A regression analysis of calibration or audit results provides a quantitative assessment of analyzer performance. Portable calculators are available with regression analysis functions. The following summarizes the steps involved in this calculation 35 Source: http://www.doksinet For this analysis, it is necessary to define the dependent and independent variables. The correct form of the regression equation to
obtain corrected data values from raw analyzer values is when the true values are set as the dependent variable (y), and the analyzer values are set as the independent variable (x). The resultant equation is in the form of: y = ax+b where: y = true value a = slope of calibration or audit curve x = analyzer value b = intercept of calibration or audit curve Defining x and y as described above, a slope of 1.10 indicates that the analyzer reading is 10% low, whereas a slope of 0.95 indicates that the analyzer reading is 5% high The slope parameter is used to assess the accuracy of the instrument readings. The intercept value is used to assess whether the analyzer zero is within acceptable limits. The regression coefficient, R, is an indication of the degree of linearity of the calibration or audit points. These three parameters are rated as follows for assessing analyzer performance in an audit: Slope: Very Good Satisfactory Unsatisfactory 0.95 to 105 0.85 to 094 or 106 to 115 < 0.85
or >115 Intercept: Satisfactory Unsatisfactory < 3% of the full scale > 3% of the full scale Regression Coefficient: Satisfactory Unsatisfactory 0.995 to 1000 < 0.995 When audit results are unsatisfactory for any of these parameters, appropriate corrective action must be taken, and all data collected subsequent to the last satisfactory audit or calibration must be reviewed. Data determined to be valid with correction must be identified as such, with details of the correction documented. Data which cannot be corrected must be invalidated. 36
Chief, Analysis and Air Quality Division Environment Canada Environmental Protection Service Environmental Technology Advancement Directorate Environmental Technology Centre Ottawa, Ontario K1A 0H3 Ce document est aussi disponible en français. Source: http://www.doksinet Acknowledgements This document was prepared by the staff of the Analysis and Air Quality Division of Environment Canada with the contributions of NAPS network agencies. We would like to thank all the individuals who have participated in completing this document. Source: http://www.doksinet Foreword This document is a revision of the manual entitled National Air Pollution Surveillance Network Quality Assurance and Quality Control Guidelines, first published in 1995. It contains management policies and monitoring protocols which specify how NAPS network agencies strive to produce quality-assured data of known and acceptable precision, accuracy, representativeness and completeness. Addendums, revisions and
corrections to this document will be issued periodically. A formal review of this document will be undertaken at five-year intervals. Source: http://www.doksinet Table of Contents 1. The National Air Pollution Surveillance (NAPS) Network 2. NAPS Network Agencies 3. NAPS Network Quality Assurance and Quality Control (QA/QC) Objectives 4. Purpose of the NAPS Network QA/QC Guidelines 5. NAPS Network QA/QC Program Elements 5.1 Network and QA Planning and Management Canadian Air Quality Standards and Objectives Measurement Methods, Analyzer Selection and Operating Specifications 5.2 Site Selection and Location 5.3 Sampling Systems Shelter Requirements Probe Siting Criteria Manifold Design 5.4 Station and Analyzer Operation Station Visits Analyzer Operation Data Acquisition Preventive Maintenance 5.5 Traceability of Calibration and Reference Standards 5.6 Calibrations Analyzer Calibration Frequency Calibration Procedure Analyzer Zero and Span Verifications 5.7 Inter-agency Testing and
Audits Inter-agency Testing Inter-agency Testing Procedures Analyzer Performance Audits Analyzer Performance Audit Procedures System Audits 5.8 Data Review and Validation 5.9 Documentation Site Documentation Station Log Books Analyzer Operation and Maintenance Manuals 5.10 Training Requirements Personnel Qualifications Training Suggested Training Courses 6. References 7. Abbreviations and Acronyms 8. Glossary 1 3 6 6 7 7 9 9 12 14 15 17 18 19 19 21 22 23 Source: http://www.doksinet Tables 5.0 NAPS Network QA/QC Components and Management 5.13 Measurement Methodology and Operating 7 8 Specifications of NAPS Network Analyzers 5.31 NAPS Network Sample Probe Location Criteria 11 5.32 Minimum Distance from Roadways for O3 and NO2 Analyzers 11 5.4 Summary of NAPS Station Work Activities 13 5.5 List of SRMs and Reference Standards for the NAPS Network 15 Appendices Appendix I Appendix II Appendix III Appendix IV Performance Specifications for Ambient Air Analyzers
Manifold Design for NAPS Sampling System Zero and Span Verifications for Ambient Air Gas Analyzers Calibration Procedures for Continuous Ambient Air Analyzers 24 26 31 34 Source: http://www.doksinet 1. The National Air Pollution Surveillance (NAPS) Program The National Air Pollution Surveillance program, or NAPS, has been in existence since 1970 and is a cooperative partnership of federal, provincial, territorial and some regional governments measuring air quality throughout Canada. The NAPS program supports many air quality programs across Canada designed to protect human health and the environment. The goal of the NAPS program is to provide accurate and long-term air quality data of a uniform standard throughout Canada. Data from the NAPS program are included in the Canada-wide Air Quality Database and are published in annual air quality data summary reports, which are available on the internet at: http://www.etc-cteecgcca/publications/napsreports ehtml In 2003, the NAPS network
and associated provincial/territorial/regional monitoring networks reporting data to the Canada-wide Air Quality database consisted of approximately 290 monitoring stations in over 175 communities in Canada, equipped with approximately 600 continuous monitors measuring sulphur dioxide, carbon monoxide, nitrogen dioxide, ozone, and particulate matter, and over 160 air samplers measuring components of particulate matter, volatile organic compounds and other toxics substances. The Analysis and Air Quality Division of Environment Canada coordinates operation of the NAPS program, provides air monitoring instrumentation and reference standards, operates a laboratory for the chemical speciation of NAPS samples, directs a national quality assurance program, coordinates the development of equipment specifications for the monitoring network as a whole and maintains the Canada-wide Air Quality Database. The provincial, territorial and regional governments share in overall management of the NAPS
Program, support the development of standardized methods, and are responsible for the ongoing operation and maintenance of monitoring stations and instrumentation, data acquisition and validation, and reporting within their jurisdictions. Key objectives of the NAPS program include: 1. Determining the nature and levels of air pollutants affecting human health and the environment in Canada 2. Supporting near real-time reporting of air quality information to the public 3. Supporting air quality prediction and forecasting programs 4. Assessing long-term trends in air contaminants across Canada 5. Tracking the occurrence and extent of new contaminants in ambient air 6. Providing data to support scientific research into the effects of air pollution on health and environment 7. Supporting the development of air quality standards and objectives 8. Supporting evaluation of the success of pollution control strategies procedures 9. Supporting national and international air quality agreements and
initiatives 1 Source: http://www.doksinet 10. Supporting the development and evaluation of new monitoring technologies, and the development and application of quality assurance/quality control. The NAPS network supports data needs for joint air quality initiatives including the National Air Quality Objectives, the Air Toxics Program, the Canada-Wide Standards, the Canada-U.S Air Quality Agreement, the Quality Prediction Program, Special Studies, and other initiatives that may arise. 2 Source: http://www.doksinet 2. NAPS Network Agencies Newfoundland and Labrador Department of Environment Pollution Prevention Division 4th floor, Conference Bldg., PO Box 8700 St. Johns, NF A1B 4J6 Manager: Peter Haring Telephone: (709) 729-2564 Fax: (709) 729-6969 Email: daweg@mail.govnfca Web: www.govnfca/env/Env/defaultasp Prince Edward Island Department of Fisheries, Aquaculture and Environment Air Quality and Hazardous Materials Environmental Protection 11 Kent Street P.O Box 2000
Charlottetown, PE C1A 7N8 Manager: Todd Fraser Telephone: (902) 368-5037 Fax: (902) 368-5830 Email: ktfraser@gov.peca Web: www.govpeca/ Nova Scotia Environment & Labour Environment and Natural Areas Management Division Air Quality Branch P.O Box 697, Halifax, NS B3J 2T8 Manager: Johnny McPherson Telephone: (902) 424-2566 Fax: (902) 424-0503 Email: mcpherjp@gov.nsca Web: www.govnsca/enla/ New Brunswick Department of the Environment and Local Government Ministère de l’Environnement et Gouvernements locaux du Nouveau Brunswick Air Sciences Section / Section des sciences de lair P.O Box 6000, 364 Argyle Street Fredericton, NB E3B 5H1 Manager: Randy Piercey Telephone: (506) 457-4844 Fax: (506) 453-2265 Email: randy.piercey@gnbca Web: www.gnbca/elg-egl Gouvernement du Québec, Ministère de lEnvironnement Direction du suivi de l’état de l’environnement Édifice Marie-Guyart, 7ième étage 675, boul. René Lévesque Est Québec, QC G1R 5V7 Gestionnaire: Ghislain Jacques
Téléphone: (418) 521-3820 poste 4569 Fax: (418) 643-9591 Courriel: ghislain.jacques@menvgouvqcca Web: www.menvgouvqcca/ Ville de Montréal Direction de lenvironnement Boul. 827, Crémazie Est, Bureau 429 Ville de Montréal, QC H2M 2T8 Gestionnaire: Claude Gagnon 3 Source: http://www.doksinet Téléphone: Fax: Courriel: Web: (514) 280-4291 (514) 280-4285 claude.gagnon@cumqcca www.rsqaqcca/framvilleasp?url=framrsqfasp Ontario Ministry of Environment / Ministère de l’Environnement de l’Ontario Air Monitoring Section 125 Resources Road, West Wing Etobicoke, ON M9P 3V6 Supervisor: Phil Kiely Telephone: (416) 235-5780 Fax: (416) 235-6037 Email: kielyph@ene.govonca Web: www.enegovonca/ Manitoba Conservation, Air Quality Management Section 123 Main Street, Suite 160 Winnipeg, MB R3C 1A5 Manager: Don Regehr Telephone: (204) 945-7001 Fax: (204) 948-2357 Email: dregehr@gov.mbca Web: www.govmbca/environ/indexhtml Saskatchewan Environment Environmental Protection Branch 3211 Albert
Street Regina, SK S4S 5W6 Manager: Chris Gray Telephone: (306) 787-6196 Fax: (306) 787-0197 Email: CGray@serm.govskca Web: www.segovskca Alberta Environment Environmental Monitoring and Evaluation Branch, Environmental Assurance st 1 Floor, Twin Atria Building 4999-98th Avenue Edmonton, AB T6B 2X3 Manager: Albert Poulette Telephone: (780) 422-3035 Fax: (780) 427-3178 Email: albert.poulette@govabca Web: www.casadataorg Web: www.govabca/env/ British Columbia Ministry of Water, Land and Air Protection 2975 Jutland Road Victoria, BC V8W 9M1 Manager: Chris Jenkins Telephone: (250) 387-9944 Fax: (250) 356-7197 Email: Chris.Jenkins@gems7govbcca Web: wlapwww.govbcca/air/ Greater Vancouver Regional District (GVRD) Air Quality Department 4330 Kingsway, 6th Floor Burnaby, BC V5H 4G8 Manager: Kenneth P. Stubbs Telephone: (604) 436-6747 Fax: (604) 436-6707 Email: ken.stubbs@gvrdbcca 4 Source: http://www.doksinet Web: www.gvrdbcca Yukon Department of Environment Environmental Protection &
Assessment Branch P.O Box 2703 Whitehorse, YT Y1A 2C6 Manager: Janine Kostelnik Telephone: (867) 667-5456 Fax: (867) 393-6205 Email: janine.kostelnik@govykca Web: www.renresgovykca/ Northwest Territories Resources, Wildlife and Economic Development Environmental Protection Service P.O Box 21 Scotia Centre 600 - 5102 50th Avenue Yellowknife, NT X1A 3S8 Manager: Graham Veale Telephone: (867) 873-7654 Fax: (867) 873-0221 Email: graham veale@gov.ntca Web: www.govntca/RWED/eps/indexhtm Government of Nunavut Department of Sustainable Development Environmental Protection Services Manager: Gordon McKay Telephone: (867) 975-5917 Fax: (867) 975-5980 Email: gmckay@gov.nuca Web: www.govnuca/ Environment Canada, Meteorological Service of Canada / Environnement Canada, Service météorologique du Canada Canadian Air and Precipitation Monitoring Network (CAPMoN) / Réseau canadien déchantillonnage des précipitations et de lair (RCEPA) 4905 Dufferin St. Downsview, ON M3H 5T4 Manager: Dave MacTavish
Telephone: (416) 739-4450 Fax: (416) 739-5704 Email: dave.mactavish@ecgcca Web: www.mscecgcca/capmon/index ecfm Web: www.mscecgcca/capmon/index fcfm Environment Canada, Environmental Protection Service / Environnement Canada, Service de la protection de l’environnement Analysis and Air Quality Division / Division des analyses et de la qualité de l’air 335 River Road Ottawa, ON K1A 0H3 Manager: Richard Turle Telephone: (613) 990-8559 Fax: (613) 990-8568 Email: richard.turle@ecgcca Web: www.etc-cteecgcca 5 Source: http://www.doksinet 3. NAPS Network Quality Assurance and Quality Control (QA/QC) Objectives 3.1 It is the policy of the NAPS network agencies to provide sufficient quality assurance and quality control to ensure that the ambient air monitoring data collected from the NAPS network are of acceptable precision, accuracy, completeness, comparability, and representativeness. Every NAPS agency has in place a quality assurance and control program that is supplemented by a
federal quality assurance and control program. These programs are intended to support the policy that the data generated from the NAPS network be within ±15% of true values. 3.2 All data shall be traceable to a primary standard All calibration standards (including zeros and spans) used in the NAPS network are certified traceable to primary standards of the U.S National Institute of Standards and Technology (NIST) or Canada’s Institute for National Measurement Standards (INMS). 3.3 All data shall be of a known and documented quality 3.4 All data shall be comparable, meaning that the data shall be produced in a similar and scientific manner using standard methodologies for sampling, calibration, auditing, and collection of data. Where possible, methods used in the NAPS network are or pending to be designated reference or equivalent methods by the United States Environmental Protection Agency. 3.5 All data shall be representative of the parameters being measured with respect to time,
location, and the conditions from which the data are obtained. The use of standard methodologies contained in this manual should insure that the data generated is representative. 4. Purpose of the NAPS Network QA/QC Guidelines The QA/QC components specified are the minimum requirements and network agencies may have more stringent specifications or more elaborate QA/QC procedures, as they deem appropriate for their jurisdictional requirements. This manual will be reviewed and revised periodically to reflect changing needs and concerns to be addressed by air quality monitoring programs in Canada. 6 Source: http://www.doksinet 5. NAPS Network QA/QC Program Elements The NAPS network is a cooperative program with shared responsibilities between Environment Canada and the network agencies. The elements of the NAPS quality assurance program, which form the basis for assessing the quality of the published data, are listed in Table 5.0 Table 5.0 NAPS Network QA/QC Elements and Management
1 2 3 4 5 6 7 8 9 10 5.1 QA/QC Element Plan, establish, develop and manage monitoring network programs - Measurement Methodology, Equipment Selection, Operating Conditions Site Selection - Spatial Scale of Representativeness - Site Classification, Distribution, Location, Separation Sampling System - Shelter Requirements - Probe Siting Criteria - Manifold Design Station and Analyzer Operation - Station Visits - Operating Procedures - Preventive Maintenance Calibration - Calibration Frequency - Calibration Procedures - Zero and Span Verifications Calibration and Reference Standards Station Performance and System Audits, and Inter-agency Verifications Data Validation and Formats Documentation - Site Documentation - Station Activities Log Book - Analyzer Operation and Maintenance Manual - Quality Assurance and Quality Control Manual Personnel Training and Technical Support Network and QA Planning and Management The Analysis and Air Quality Division of Environment Canada
coordinates the operation of the NAPS program, provides air monitoring instrumentation and reference standards, operates a laboratory for the chemical speciation of NAPS samples, directs a national quality assurance program, coordinates the development of equipment specifications for the monitoring network as a whole and maintains the Canada-wide Air Quality Database. The provincial, territorial and regional governments share in overall management of the NAPS Program, support the development of standardized methods, and are responsible for the ongoing operation and maintenance of monitoring stations and instrumentation, data acquisition and validation, and reporting within their jurisdictions. All network agencies have managers designated with the responsibility of overseeing 7 Source: http://www.doksinet network operations and quality assurance activities within their respective jurisdictions. Canadian Air Quality Standards and Objectives One of the key components of the NAPS
network is supporting the development of air quality standards and objectives. The network focuses on monitoring the following criteria pollutants to characterize ambient air quality: Sulphur Dioxide, Particulate Matter (PM2.5, PM10), Carbon Monoxide, Ozone, and Nitrogen Dioxide Other pollutants such as polyaromatic hydrocarbons (PAHs), volatile organic compounds (VOCs), and acid aerosols are also monitored in NAPS stations although there are no air quality objectives established for these pollutants at the present time. This data provides valuable information on the conditions and trends of the Canadian atmosphere. Measurement Methods, Analyzer Selection and Operating Specifications There are many recognized methods for measuring the criteria pollutants. The methodologies used in the NAPS network are chosen based on proven reliability and performance, ease of field operation and maintenance, and cost effectiveness. Instruments are also acquired based on “Performance-based Methods”
meaning a method for measuring an air quality parameter that is based on a desired performance specification rather than a strict procedure or product. Analyzers that satisfy the requirements of the United States Environmental Protection Agency (EPA) as equivalent or as reference methods for ambient air monitoring are selected for use in the network. When no such analyzers are available, analyzers with demonstrated effectiveness and accuracy could be used in the network. The operating characteristics of these non-equivalent instruments are to be documented and their performance continuously evaluated both in the field and in the laboratory. The minimum performance specifications for the ambient air gas analyzers are summarized in Appendix I. Table 513 lists the measurement methods and operating characteristics of the analyzers used in the NAPS network. Newly installed analyzers are to be calibrated prior to reporting data which are to be reviewed and compared with historical data, if
available. Table 5.13 Measurement Methods and Operating Specifications of NAPS Network Analyzers Pollutant Measurement Method Infrared Gas Filter Correlation Monitor Type Continuous Automated Operating Range 50 ppm Operating Temperature 15 °C - 35 °C Minimum Detection Limit 0.1 ppm Sulphur Dioxide (SO2) UV Fluorescence Continuous Automated 15 °C - 35 °C 0.002 ppm Nitrogen oxides (NOx) Chemiluminescence Continuous Automated 1.0 ppm or 0.5 ppm 1.0 ppm or 0.5 ppm 15 °C - 35 °C 0.002 ppm Carbon Monoxide (CO) 8 Source: http://www.doksinet Ozone (O3) UV Absorption Continuous Automated Particulate Matter (PM10, PM2.5) Virtual Impactors; gravimetric/filter; microbalance/filter; beta radiation attenuation. Manual GC/MSD Continuous Automated and manual gravimetric Organic compounds 5.2 Manual Canister 1.0 ppm or 0.5 ppm Agency specific as per operators’ procedures NA 15 °C - 35 °C 0.002 ppm See operating procedures in Annex 1.0 µg/m3 N/A N/A Site
Selection and Location The selection of sites for the NAPS network is done in consultation with network agencies to meet the network objective of producing air quality data representative for the geographic area of interest. The sites in the network are selected based on the requirements for distribution, location, separation and spatial scale of representativeness. Sites in the network are generally selected to represent where the population lives, plays and works. Air monitoring stations at these sites are meant to measure air quality trends over the long term and therefore are intended to have some degree of permanency. There are also stations established to characterize long range transport and trans-boundary movement of air pollutants. Depending on the specific reasons and purpose for monitoring, some or all of the air quality criteria pollutants may be monitored. Some stations are used by jurisdictions for air quality index (AQI) reporting, other stations are used for CWS
achievement determination or for trans-boundary transport monitoring or for special studies of local air pollution problems. Some of the stations are air pollution oriented but not sourcespecific oriented The goal is to provide the best assessment of the air quality or of an air pollution problem, for the general population, with the most efficiency. Site selection criteria for the CWS achievement determination monitors are outlined in “Guidance Document on Achievement Determination: Canada Wide Standards for Particulate Matter and Ozone” and the accompanying document “Ambient Air Monitoring Protocol”. 5.3 Sampling System The proper design of the sampling system in a monitoring station is essential for ensuring data quality. The temperature stability of the shelter, location of the sampling probe, manifold system design, length and composition of sample lines, and the composition of filters and fittings all may affect the integrity of the air sample and the resulting data
quality. The probe, manifold and sampling lines must be either Teflon or borosilicate glass. Teflon inlet filters of 5µm pore size should be used for all gaseous pollutant instruments. 9 Source: http://www.doksinet Shelter Requirements The shelter must protect the instrumentation from precipitation and excessive dust and dirt, environmental stress including vibration, corrosive chemicals, intense light, or radiation. The station meet regulations for occupational health and safety under Part II of the Canada Labour Code, for federal agencies, or the applicable provincial/territorial regulations, for provincial/territorial agencies. The electrical power system should meet electrical codes. Ground–fault-circuit-interrupters (GFCIs) should be used for sampling and monitoring equipment that are not sheltered. In general, the shelter temperature should be maintained between 20 C to 30 C, since most designated analyzers have been tested and qualified over that temperature range.
However, for some particulate monitors it is advisable to keep the temperature of the shelter below 25 C. Temperature fluctuations can affect analyzer drift which should be detected during zeroing and spanning. The station should be accessible throughout the year, be secured from unauthorized access and meet the sampling probe and siting criteria. The shelter must be equipped with an ABC type fire extinguisher, a first-aid kit, and the appropriate signage. Telecommunication service and equipment are required for data and voice communication. Probe Siting Criteria Prove siting criteria for NAPS stations have been established for the following parameters and are listed in Table 5.31 : 1. Probe height 2. Probe distance from roadways and other sources 3. Probe distance from airflow restrictions 4. Probe distance from trees 5. Minimum distance from roadways for O3 and NO2 analyzers 10 Source: http://www.doksinet Table 5.31 NAPS Network Probe Siting Criteria Pollutant Height Above
Ground (metres) Particulate Matter : 2 to 15 PM10, PM2.5 Distance from Supporting Structure (metres) Other Spacing Criteria 1 Vertical Horizontal >2 a. b. c. d. 3 to 15 >1 >1 a. b. SO2 c. d. e. CO 3 to 10 >1 >1 a. b. c. 3 to 15 >1 >1 O3 a. b. c. d. 3-15 >1 >1 a. > 20 metres from trees. Distance from the sampler to any air flow obstacle, i.e buildings, must be > 2×height of obstacle above the sampler. Unrestricted air flow in 3 of the 4 wind quadrants. No nearby2 furnace or incineration flues. > 20 metres from trees. Distance from the sampler to any air flow obstacle, i.e buildings, must be > 2×height of obstacle above the sampler. Unrestricted air flow in 3 of the 4 wind quadrants. No nearby2 furnace or incineration flues. Probe height must be > 0.8 of the mean height of surrounding buildings. > 10 metres from street intersections or at mid-block location. 2-10 metres from roadway. unrestricted air flow in 3 of 4 wind
directions. > 20 metres from trees. Distance from the sampler to any air flow obstacle, i.e buildings, must be > 2×height of obstacle above the sampler. Unrestricted air flow in 3 of the 4 wind quadrants. Distance from roadway varies with road traffic as specified in Table 5.32 > 20 metres from trees. b. Distance from the sampler to any air flow obstacle, i.e buildings, must be > 2×height of obstacle above the sampler. c. Unrestricted air flow in 3 of the 4 wind quadrants. d. Distance from roadway varies with road traffic as specified in Table 5.32 1 When a probe is located on a rooftop, this separation distance is in reference to walls, parapets, or penthouses located on the roof. 2 Distance depends on the height of furnace or incinerator flues, type of waste or fuel burned, and quality of fuel (sulphur and ash content). This is to avoid undue influences from nearby sources NO2 Table 5.32 Minimum Distance from Roadways for O3 and NO2 Analyzers Average Traffic
(vehicles per day) < 10,000 15,000 20,000 40,000 70,000 > 110,000 Minimum Distance between Roadway and Analyzer (metres) > 10 20 30 50 100 >250 11 Source: http://www.doksinet If a station does not meet all the parameters of the siting criteria, the non-conforming parameters should be documented. Manifold A manifold system is the recommended alternative to separate, long sampling lines. It is used to remove excess moisture from outside air before presenting it to analyzers which are connected into ports along the manifold. Typically in the NAPS network, the manifold is made of Pyrex glass. The material used for the manifold must be non– reactive with the pollutants of interest. If particulates are measured through the manifold, there must be a minimum number of bends to avoid impaction with the walls. A water trap should be installed in the manifold to prevent water from entering in the analyzers or samplers. The airflow through the manifold, as determined
by the blower capacity, must be sufficient to keep the residence time of the air sampled in the manifold to below 20 seconds. The air flow through the manifold must not be so great as to cause the pressure inside the manifold to be more than one inch of water below ambient. These last two conditions are in opposition to each other, but can be assessed as follows. Construct the manifold. Use a pitot tube to measure the flow of the sample inside the manifold. At the same time, attach a water manometer to a sampling port Turn on the blower and measure the flow rate and the vacuum. (Remember to allow for the air demand of the instrumentation.) Adjust the flow rate to fit between these two parameters. If this is impossible, the diameter of the manifold is too small Another type of manifold that is widely used is the “ARB” type manifold. Further information on manifolds is found in Appendix II. 5.4 Station and Analyzer Operation Station and analyzer operation is the responsibility of
the network agencies and is overseen by the network manager. Operation of the station includes regularly scheduled station visits, instrument zero and span verifications, calibrations, preventive maintenance and documentation. Table 54 summarizes the recommended minimum frequency of NAPS Station Work Activities. 12 Source: http://www.doksinet Table 5.4 Summary of NAPS Station Work Activities Tasks in the Operation Work Performed By of NAPS Station Regular Site Visitation Station Operator Zero and Span Verification Station Operator or Calibration technician Analyzer Calibration Calibration Technician Internal Performance and System Audit Agency Auditor or Technician other than the operator of the station External Performance and Auditors from Environment System Audit Canada or other agency Minimum Frequency for this Work Weekly Weekly Every 6 months; after repairs are made to the analyzer; and when an analyzer is installed at the station Every 6 months Every two years Station
Visits One of the main purposes of monitoring station visits is to verify the proper operation of the monitoring equipment and of data acquisition systems to ensure the collection of valid and complete data. A second important purpose is to verify the continued safe and secure environment at the station. Regular visits on a minimum weekly basis are recommended to verify the safe unattended operation of the monitoring equipment using pumps and compressed gas cylinders and to verify the outdoor sampling and monitoring equipment. Diagnostic tests, which can be performed remotely on various monitoring equipment and station parameters, complement the station visit verifications. Station visits should be documented in the site logbook. The following is a list of activities to be performed at the station: • Examine the external station conditions including the inlet probe for damage or blockage. Periodically review the station characteristics for any change or modification to the station.
• Examine the manifold, the transfer lines and the inlet filters for dirt buildup and replace or clean as required. Examine the seals in the sampling system, the scrubbing and drying agents and replace as required. • Perform zero and span verifications on analyzers. Record values on the control chart. Note abnormal deviations Calibration is required when the instrument is out of control. Manual zero adjustments are acceptable when an appropriate zero source is used and the adjustments are documented and the telemetry system is re-configured as required. Refer to Appendix III for the construction of control charts. • Replace zero and span cylinders when pressure is below 1,500 13 Source: http://www.doksinet kPa (215 psig). • Perform preventive maintenance as prescribed in the operations and maintenance manuals. Analyzer Operation Monitoring and sampling instruments are to be operated according to procedures described in the operation manuals. The procedures are
requirements of the Quality Assurance and Quality Control guidelines. The general operating specifications of the analyzers are listed in Table 5.13 Data Acquisition Air quality data are collected using data acquisition systems. Some systems simply log data while others also display data numerically and graphically which serves as a diagnostic tool for analyzing unusual analyzer responses. Preventive Maintenance Preventive maintenance as specified in the operation and maintenance manuals should be followed. Some of the procedures should be preceded by and followed by a zero and span verification. Preventive maintenance increases data capture, improves system reliability, and assists in identifying any potential problems and corrections before failures occur. 5.5 Traceability of Calibration and Reference Standards Materials and devices used for calibrating NAPS analyzers, samplers and monitors must be certified for accuracy against reference standards that are traceable to recognized
national primary standards. Standard Reference Materials (SRMs) for gaseous pollutants, and traceable reference standards for ozone, temperature, pressure, flow rate, and voltage are maintained by the Analysis and Air Quality Division (AAQD) at Environment Canada’s Environmental Technology Centre (ETC). These serve as NAPS program reference standards, and periodic recertification of field standards against these reference standards is required in order for the field standards to serve as traceable NAPS transfer standards. Recertification of transfer standards for sulphur dioxide, carbon monoxide and nitric oxide against appropriate SRMs is required every two years. Recertification of field calibrators, ozone transfer standards, flow meters and other flow devices against NAPS reference standards is required annually. Environment Canada’s SRMs for gaseous pollutants, except ozone, are acquired from the United States National Institute of Standards and Technology (NIST). Traceability
of a standard reference photometer (SRP) for ozone measurement is maintained by periodic direct intercomparison to other, equivalent ozone photometers manufactured by 14 Source: http://www.doksinet NIST. Traceability of all other NAPS program reference standards is maintained by periodic recertification of these standards against higher level standards. NAPS reference standards for temperature, pressure, flow rate (low flow) and voltage are traceable to the corresponding national primary standards at the National Research Council of Canada’s Institute for National Measurement Standards (NRC-INMS). A high flow rate volumetric standard is referenced to a transfer standard at Industry Canada, which is traceable to the Industry Canada national primary standard. A list of the SRMs and reference standards is presented in Table 5.5 Table 5.5 List of SRMs and Reference Standards for the NAPS Network Calibration Material/Reference Standard Ozone Reference Standard Traceable Primary
Standard NIST Industry Canada 4 High Volume Rotary Flow Meter (0.5 to 20 m³/min.) Low Volume Flow Meter (2 cc/min. to 30,000 cc/min.) Voltage Standard 5 Temperature Standard NRC-INMS 6 Pressure Standard NRC-INMS 7 NO in N2 gas mixture NIST 8 SO2 in N2 gas mixture NIST 9 CO in N2 gas mixture NIST 10 SO2 permeation devices Traceable to Transfer Standard 1 2 3 NRC-INMS NRC-INMS Application Certification Frequency Certification of ozone transfer standards and ozone analyzers Certification of high volume transfer standards Certification of low volume transfer standards Certification of Voltmeters and in-lab instrument calibrations Certification of Transfer Thermometers and inlab instrument calibrations Certification of field barometers and in-lab instrument calibrations Calibration of field analyzers Calibration of field analyzers Calibration of field analyzers Spanning of field analyzers Annually and on request, ozone transfer standards in the field are
certified by Environment Canada in Ottawa. Annually and on request, high volume transfer devices are certified by Environment Canada in Ottawa Annually and on request, low volume transfer devices are certified by Environment Canada in Ottawa On request voltage transfer devices are certified by Environment Canada in Ottawa On request transfer thermometers are certified by Environment Canada in Ottawa On request transfer barometers are certified by Environment Canada in Ottawa Biennial certification by Environment Canada. Biennial certification by Environment Canada. Biennial certification by Environment Canada. Available on request from Environment Canada. Permeation devices are calibrated in situ by reference to the SO2 calibration gas transfer standard used in the field. 5.6 Calibrations Multipoint calibrations in combination with zero and span data are used in evaluating analyzer performance and establishing data validity. Network agencies perform multipoint calibrations at maximum
intervals of six months and following span drifts of greater than ±15%. When control charts are used, multipoint calibrations are performed following span drifts of greater than three standard deviations 15 Source: http://www.doksinet of the span control value. The accuracy of multipoint calibrations is considered to be within ±4% (worst case) of laboratory multipoint calibrations using primary standards (revised in 2004 from ±6%). Analyzer Calibration Frequencies The following is the minimum recommended calibration frequencies: • • • • • After initial installation before logging data. Six month intervals for all analyzers When span drifts exceed ±15%, or when using control charts, 3 standard deviations of the span control value. For new analyzers, recalibration after 3 months of operation is recommended. After major repairs. Calibration Procedures The calibration procedures in the analyzer operation manuals and the procedures in Appendix IV, which are part of these
QA/QC guidelines, should be followed. Analyzers are generally calibrated dynamically with one zero point and a minimum of three, but preferably four, upscale points covering the operating range. The upscale points can be at 20%, 40%, 60% and 80% of full scale or at 10%, 20%, 40% and 80% of operating range. These points are used to construct a calibration curve using regression analysis. Dynamic calibration is usually accomplished by means of a gas dilution system with gas phase titration or a permeation system. The calibration gas must be of certified concentration traceable to a primary standard reference material (SRM). The calibrator source gas and the diluent air flow readings must be certified traceable to a primary standard (see Table 5.5) The zero air source for gas dilution must be scrubbed of interfering pollutants by a properly maintained scrubbing system. Some dilution calibrators use gas cylinders as source materials while others use permeation devices or a combination of
both. Procedures for specific calibrators are complementary to the general recommended procedure and must be followed. Calibration of low volume samplers is accomplished by use of traceable flow standards, pressure standards and temperature standards. Calibration of continuous particulate matter monitors (e.g TEOM, BAM) must be accomplished as specified by the operating manual and the applicable standard operating procedures (SOP). Analyzer Zero and Span Verifications Zero and span verifications are used for assessing analyzer performance and calibration stability. The verifications should be done at least weekly on all continuous gas analyzers. A deviation of greater than ±15% from the control value of the last 16 Source: http://www.doksinet calibration requires a multipoint calibration. Automatic zero and span verifications should be scheduled during early morning hours unless pollutant levels at the site during those hours are of concern. Zero and span procedures described in
the analyzer operation manuals and Appendix VI should be followed. A zero and span control chart for the analyzer should be constructed as per the procedures in Appendix III. When the analyzer is out of control, recalibration is required The cause of the out of control event should be identified, rectified and documented. The analyzer should be serviced promptly or replaced to minimize the loss of data. 5.7 Inter-agency Testing and Audits Inter-agency Testing The purpose of inter-agency testing and performance audits is to detect any systematic bias in the measurements of the network agencies. An inter-agency testing program for gas concentration measurement is conducted periodically. Gas mixtures of NO, SO2 and CO are sent to all network agencies for blind analyses. The gas mixture concentrations being higher than the analyzer range requires the network agencies to use gas dilution systems for the analyses. The gas mixture concentrations which are verified against the NIST standards
at the NAPS QA laboratory are used as benchmarks for data comparisons. The results from these analyses provide a performance measure of the network agencies’ calibration systems and procedures. Deviations within ±6% of benchmark values are considered acceptable. Inter-agency Testing Procedures Test gases in aluminum cylinders are certified in the NAPS QA Laboratory against primary SRMs and their concentrations are verified for stability after storage at room temperature for one month. Values within ±3% of the test gases are considered of sufficient stability for the program. Test gases of NO in N2, SO2 in N2 and CO in N2 are used. Gases are certified once again before shipping to the network agencies. These values are taken as the out concentrations. Network agencies are requested to analyze the gases within a two week time frame and return the cylinders to the ETC in Ottawa immediately after analysis. Upon return, each test gas is re-verified to obtain the in concentration The
benchmark concentration is the average of the out and in concentrations. The set up requirements for the test are detailed in the Inter-agency Test Procedures that accompany the test gases. All network agencies are required to use this set up to avoid any procedural variation. 17 Source: http://www.doksinet Analyzer Performance Audits Performance audits are independent evaluations of data quality and are performed in addition to the normal quality control activities of the network agencies. In addition to auditing instrument performance, system audits are conducted at the site to verify compliance with siting criteria and sampling system requirements. Analyzer Performance Audit Procedures The audit procedures consist of challenging the analyzers with known gas concentrations at the zero and four upscale levels normally at 20%, 40%, 60% and 80% of the analyzer measurement range. No adjustments are made on the analyzer and inlet filters are not changed before the audit. The data
collected by the data acquisition system during the audit is either flagged or not logged. The operator is informed of the time intervals during which the instruments were audited. The audit gases and measurement devices used for auditing are certified against the SRM and reference standards maintained in the NAPS QA laboratory. Analyzer measurements are taken at the analyzer output terminals using a certified digital voltmeter and are compared with the data logger readings. Measurements are taken after a stabilization period of 20 minutes for each audit point. The audit points are used for regression analysis where the slope, intercept and correlation coefficient are calculated. A copy of the results is left with at the site for the operator. A more detailed report with observations by the auditors on the overall condition of the site and recommendations for corrective action if required, is sent to the operating agency normally within one month of the audit. The Pass/Fail criteria of
the analyzer performance are a slope within the range of 0.85 to 1.15 and an intercept of within ±3% of range The Pass/Fail criteria of particulate matter samplers and monitors are flow rates within ±10% of the specified value. Performance outside these ranges requires corrective action which is investigated jointly by Environment Canada and the operating agency, and documented. Normally, two to three sites from each operating agency are audited at two-year intervals and so scheduled to maximize the effectiveness of the Quality Assurance program. System Audits A system audit is performed concurrently with the performance audit and is a review of the site parameters that may be used for site characterization and site documentation and may also include a review of quality control activities. 5.8 Data Review and Validation This section and Appendix VIII are under revision. 18 Source: http://www.doksinet 5.9 Documentation Site Documentation The following site parameters will be
updated in the NAPS database: • • • • • • • • Station identification. Station name and address. City, including the borough or municipality. Analyzer type and ownership. Site description including scale of representativeness, land use, elevation, average building height, air flow restrictions, manifold, and the nearest meteorological station. Site influences including localized sources, roadway influences and major point sources. Site map or aerial photograph of the area. Photographs from the manifold inlet showing the north, east, south and west directions. The information in the NAPS database supersedes the information published in a document titled Site Documentation for NAPS Network Air Monitoring Stations, Environment Protection Directorate, Environment Canada, January 1988, (reference 6). Station Log Book A logbook and/or log sheets should be used to record any activity at the site or events and occurrences that may affect the air quality data. Analyzer
Operation and Maintenance Manuals The operation and maintenance procedures described in the operation manuals are a requirement of the QA/QC guidelines. A copy of the manuals should be kept at the station. 5.10 Training Requirements There is no formal training program specifically for NAPS network staff. Often, more experienced staff will provide training to newer staff. Most equipment manufacturers offer training classes and seminars in Canada or at their manufacturing facility. A host of air quality related training courses are offered through EPA’s Air Pollution Distance Learning Network (APDLN). The Analysis and Air Quality Division of Environment Canada periodically coordinates seminars in Canada offered by manufacturers or their Canadian distributors and offer some limited training more specifically on the installation and operation of new types of monitoring equipment. 19 Source: http://www.doksinet Personnel Qualifications Personnel assigned to ambient air monitoring
activities are expected to have met the educational, work experience, responsibility, personal attributes and training requirements for their positions. Training Adequate education and training are integral to any monitoring program that strives for reliable and comparable data. Training is aimed at increasing the effectiveness of employees and their organization. Appropriate training should be available to employees supporting the Ambient Air Quality Monitoring Program, commensurate with their duties. Such training may consist of classroom lectures, workshops, teleconferences and on-the-job training. Suggested Training Courses Over the years, a number of courses have been developed for personnel involved with ambient air monitoring and quality assurance aspects. Formal QA/QC training is offered through the following organizations: Air Pollution Training Institute (APTI) http://www.epagov/airprogm/oar/oaqps/eog/aptihtml Air & Waste Management Association (AWMA) http://www.awmaorg
American Society for Quality Control (ASQC) http://www.asqcorg/products/educathtml EPA Institute EPA Quality Assurance Division (QAD) http://es.epagov/ncerqa/qa/ The following provides a suggested sequence of core QA-related ambient air monitoring courses for ambient air monitoring staff, and QA managers (marked by asterisk). The suggested course sequences assume little or no experience in QA/QC or air monitoring. Course Title 1* Air Pollution Control Orientation Course (Revised), SI:422 APTI 2* Principles and Practices of Air Pollution Control, 452 APTI 3* Orientation to Quality Assurance Management QAD 4* Introduction to Ambient Air Monitoring (Under Revision 7/98), SI:434 APTI 5* General Quality Assurance Considerations for Ambient Air Monitoring (Under Revision 9/98), APTI SI:471 6* Quality Assurance for Air Pollution Measurement Systems (Under Revision 8/98), 470 APTI 7* Data Quality Objectives Workshop QAD 8* Quality Assurance Project Plan QAD 9 Atmospheric Sampling (Under
Revision 7/98), 435 APTI 10 Analytical Methods for Air Quality Standards, 464 APTI 11 Chain Of Custody Procedures for Samples and Data, SI:443 APTI * Data Quality Assessment QAD * Management Systems Review QAD * Beginning Environmental Statistical Techniques (Revised), SI:473A APTI 20 Source: http://www.doksinet * Introduction to Environmental Statistics, SI:473B APTI * Quality Audits for Improved Performance AWMA * Statistics for Effective Decision Making ASQC SI = self instructional 6. References 1. 2. Criteria for National Air Quality Objectives- Sulphur Dioxide, Suspended Particulates, Carbon Monoxide, Oxidants ( Ozone ) and Nitrogen Dioxide; Reports to the FederalProvincial Committee on Air Pollution (1971 and 1973) by The Subcommittee on Air Quality Objectives; Nov. 1976 Quality Assurance Handbook for Air Pollution Measurement Systems, Vol. I and II, US Environmental Protection Agency, EPA-600/4-77/027a. 3. GEMS/AIR Methodology Reviews Vol. 1: Quality Assurance in Urban
Air Quality Monitoring; WHO/EOS/94.1, UNEP/GEMS/94A2; UNEP Nairobi 4. GEMS/AIR Methodology Reviews Vol. 2: Primary Standard Calibration Methods and Network Calibrations for Air Quality Monitoring; WHO/EOS/94.2, UNEP/GEMS/94A3; UNEP Nairobi. GEMS/AIR Methodology Reviews Vol. 3: Measurement of Suspended Particulate Matter in Ambient Air; WHO/EOS/94.3, UNEP/GEMS/94A4; UNEP Nairobi Site Documentation for NAPS Network Air Monitoring Stations; Environment Protection Directorate, Environment Canada, January 1988. Interlaboratory Testing Procedures; Pollution Measurement Division, Environmental Technology Advancement Directorate, Environment Canada, 1995. Quality Assurance Manual for An Air Pollution Measurement System; Pollution Control Division, Air Quality Control Branch, Alberta Ministry of the Environment. Atmospheric Analyzer Audit and Calibration Manual; 3rd Edition, Instrumentation Unit, Air Resources Branch, Ontario Ministry of the Environment. McQuaker, N. R, Calibration and
Operation of Continuous Ambient Air Monitors; ISBN 07719-9211-4, British Columbia Ministry of the Environment 1983 Guidance Document on Achievement Determination - Canada-Wide Standards for Particulate Matter and Ozone; Canadian Council of Ministers of the Environment (CCME), 2001 5. 6. 7. 8. 9. 10. 11. 21 Source: http://www.doksinet 7. Abbreviations and Acronyms CMA CA CSD CWS EC EPA ETC GPT Hi-Vol INMS NAPS NCR NIST NRC ppm ppb QA/QC RA RSA SRM SSI TSP UV Census Metropolitan Area Census Agglomeration Census Sub-Division Canada Wide Standard Environment Canada Environmental Protection Agency Environmental Technology Centre Gas Phase Titration High Volume Institute for National Measurement Standards National Air Pollution Surveillance National Capital Region National Institute of Standards and Technology National Research Council parts per million parts per billion Quality Assurance/Quality Control Reporting Area Reporting Sub-Area Standard Reference Material Size Selective
Inlet Total Suspended Particulates Ultraviolet 22 Source: http://www.doksinet 8. Glossary Performance Audit An independent quantitative evaluation of a measurement system by an auditor to determine whether quality objectives are met. Quality Assurance A system of activities that assures a measurement meets a defined standard of quality. Quality Control The operational techniques and procedures used to achieve quality requirements. Reference Standard A gas mixture whose concentration or an instrument whose accuracy is known and is accepted as accurate within a defined degree of confidence by verifying it against a standard reference. It can be used as a laboratory standard or as a transfer standard but not for both purposes. Standard Reference Material A material or gas mixture whose composition is known and is taken as the standard to which all other gas mixtures are compared. In the NAPS network this refers to the NIST standard reference material. Transfer Standard A
material whose concentration or an instrument whose accuracy is known to a defined degree of confidence by verifying it against a standard reference. It is used in the field for comparison and analytical purposes. Validation Confirmation by examination and provision of objective evidence that particular requirements are met in obtaining the measurement. This involves checking every aspect of the measurement procedure including measurement method, calibration, quality control methods and data processing. Zero Air A gas mixture that is scrubbed of contaminants to a concentration below the detection limit of the analyzer being calibrated. It is used synonymously with zero gas 23 Source: http://www.doksinet Appendix I Performance Specifications for Ambient Air Gas Analyzers Where applicable, all analyzers in the network must be approved by the US EPA as an equivalent method of measurement for a specific pollutant. The typical performance specifications of NAPS ambient air gas
analyzers are shown in Table I-1. Table I-1 Performance Specifications for NAPS Ambient Air Gas Analyzers Performance Parameter Minimum Detection Limit Precision Linearity Zero Drift / 24 hours Span Drift / 24 hours Noise Rise Time ( 95% ) Fall Time ( 95% ) Operating Temperature Range Operating Humidity Range Maximum Cycling Time Normal Operating Ranges Operating Voltage Pollutant Carbon Monoxide 0.1 ppm ± 0.1 ppm 1% F.S ±0.2 ppm ± 1% F.S ± 0.05 ppm 90 sec. 90 sec. 10° - 40° C 100% 1 min. 50 ppm 105-125 vac / 60 Hz Ozone 0.002 ppm ± 0.002 ppm 1% F.S ±0.002 ppm ± 1% F.S ± 0.001 ppm 90 sec. 90 sec. 10° - 40° C 100% 1 min. 0.5 ppm or 10 ppm 105-125 vac / 60 Hz Oxides of Nitrogen 0.005 ppm ± 0.002 1% F.S ±0.002 ppm ± 1% F.S ± 0.002 ppm 180 sec. 180 sec. 10° - 40° C 100% 3 min. 0.5 ppm or 10 ppm 105-125 vac / 60 Hz SulphurDioxide 0.002 ppm ± 0.002 ppm 1% F.S ±0.002 ppm ± 1% F.S ± 0.001 ppm 180 sec. 180 sec. 10° - 40° C 100% 3 min. 0.5 ppm or 10 ppm 105-125 vac /
60 Hz Recommended measurement units of the analyzers are parts per million (ppm) or parts per billion (ppb) by volume. For conversion between mass units and volume the reference temperature and pressure are 25° C and 760 mmHg. The performance parameters are defined as follows: Minimum Detection Limit The lowest concentration that can be detected by the air analyzer with confidence. It is defined as twice the noise level of the analyzer. It is used synonymously with the lower detection limit in this document. Precision The degree of variation about the mean of repeated measurements of the same pollutant concentration by the analyzer, expressed as standard deviation about the mean. Linearity The maximum deviation between the actual analyzer output reading and the predicted analyzer output from a least square fit to the actual readings. Zero Drift The change in analyzer output response to a 24 Source: http://www.doksinet constant zero air input concentration over a period of
unadjusted continuous operation. Span Drift The percent change in analyzer output response to a constant upscale pollutant concentration over a period of unadjusted continuous operation. Noise Spontaneous short duration deviations in the analyzer output, about the mean output, which are not caused by input concentration changes. Rise Time To 95% The time interval between initial response (the first observable change in analyzer output) and a level of signal output which is 95% of the steady state output after a step increase in input concentration. Fall Time To 95% The time interval between initial response (the first observable change in analyzer output) and a level of signal output which is 95% of the steady state output after a step decrease in input concentration. Operating Temperature Range The minimum and maximum ambient temperature, of the environment surrounding the analyzer, in which the analyzer will meet all performance specifications. Operating Humidity Range The
maximum level of moisture content of the ambient air in the environment surrounding the analyzer, in which the analyzer will meet all performance specifications. Cycling Time The time required to complete the active measurement cycle (sample collection, analysis and measurement) and to produce an output. Operating Ranges The ranges which correspond to the full scale output of the analyzer. Operating Voltages The minimum and maximum line voltages in which the analyzer will meet all performance specifications. 25 Source: http://www.doksinet Appendix II Manifold Design for NAPS Sampling System The following information is from the US EPA Quality Assurance Handbook (reference 2): Some important variables affecting the sampling manifold design are the diameter, length, flow rate, pressure drop, and materials of construction. Considerations for these parameters are discussed below for both a vertical laminar flow and a conventional manifold design. Vertical laminar flow design - By
the proper selection of a large diameter vertical inlet probe and by maintaining a laminar flow throughout, the sample air is not permitted to react with the walls of the probe. Numerous materials such as glass, PVC plastic, galvanized steel, and stainless steel, can be used for constructing the probe. Removable sample lines constructed of Teflon or glass can be used to provide each device with sample air. Inlet probe diameters of 15 cm with a flow rate of 150 L/min are necessary if diffusion losses and pressure drops are to be minimized. The sampling rate should be maintained to insure laminar flow conditions. This configuration has the following advantages: • a 15-cm pipe can be cleaned easily by pulling a cloth through it with a string • sampling ports can be cut into the pipe at any location and, if unused, can be plugged with stoppers of similar composition • metal poses no breakage hazard < there is less potential for sample contamination than there is with smaller tubes
Conventional manifold design - In practice, it may be difficult to achieve vertical laminar flow because of the elbows within the intake manifold system. Therefore, a conventional horizontal manifold system should be constructed of inert materials such as Pyrex glass and/or Teflon, and in modular sections to enable frequent cleaning. The system consists of a vertical "candy cane" protruding through the roof of the shelter with a horizontal sampling manifold connected by a tee to the vertical section. Connected to the other vertical outlet of the tee is a bottle for collecting heavy particles and moisture before they enter the horizontal section. A small blower, 1700 L/min at 0 cm of water at static pressure, is at the exhaust end of the system to provide a flow through the system of approximately 85 to 140 L/min. Particulate monitoring instruments, such as BAMs and TEOMs, each have separate intake probes that are as short and as straight as possible to avoid particulate
losses due to impaction on the walls of the probe. In Figures II-1 and II-2, typical designs for a vertical and a horizontal sampling manifold are shown. 26 Source: http://www.doksinet 1 to 2 meters Roof Blower Motor Flexible Hose Water and Large Particulate Trap Stainless Steel Screens Inverted U Bend Inlet Vertical Inlet Both Vertical and Inverted Sampling Inlets are Acceptable Figure II-1 Typical Vertical Manifold 27 Source: http://www.doksinet 1 to 2 meters Blower motor Roof Water and Large Particulate Trap Stainless Steel Screens Inverted U Bend Inlet Vertical Inlet Both Vertical and Inverted Sampling Inlets are Acceptable Figure II-2 Typical Horizontal Manifold 28 Source: http://www.doksinet “ARB” Manifold Another type of manifold that is being widely used is known as the “ARB” style manifold. This manifold has a reduced profile, i.e, there is less volume in the cane and manifold, therefore, there is less of a need for bypass flow. These
manifolds allow the user more options than the other conventional manifolds. If the combined flow rates are high enough with the instruments at the monitoring location, by-pass flow devices such as blower motors are not required. Residence time Determination: The residence time of pollutants within the sampling manifold is critical. Residence time is defined as the amount of time that it takes for a sample of air to travel from the opening of the cane to the inlet of the instrument and is required to be less than 20 seconds for reactive gas monitors. It is recommended that the residence time within the manifold and sample lines to the instruments be less than 10 seconds. If the volume of the manifold does not allow this to occur, then a blower motor or other device (vacuum pump) can be used to decrease the residence time. The residence time for a manifold system is determined in the following way. First the volume of the cane, manifold and sample lines must be determined using the
following equation: Total Volume = Cv +Mv + Lv Where: Cv = Volume of the sample cane and extensions Mv = Volume of the sample manifold and trap Lv = Volume of the instrument lines Positions of calibration line in sampling manifold Each of the components of the sampling system must be measured individually. To measure the volume of the components, use the following calculation: V = pi * (d/2) L 2 Where: V = volume of the component pi = 3.14159 L = Length of the component d = inside diameter Once the total volume is determined, divide the volume by the flow rate of all instruments. This will give the residence time If the residence time is greater than 10 seconds, attach a blower or vacuum pump to increase the flow rate and decrease the residence time. It has been demonstrated that there are no significant losses of reactive gas (O3) concentrations in conventional 13 mm inside diameter sampling lines of glass or Teflon if the sample residence time is 10 seconds or less. This is true
even in sample lines up to 38 m in length, which collect substantial amounts of visible contamination due to ambient aerosols. However, when the sample residence time exceeds 20 seconds, loss is detectable, and at 60 seconds the loss is nearly complete. Placement of tubing on the Manifold: If the manifold that is employed at the station has multiple ports then placement of the instrument lines can be crucial. It is suggested 29 Source: http://www.doksinet that instruments requiring lower flows be placed towards the bottom of the manifold. The general rule of thumb states that the calibration line (if used) placement should be in a location so that the calibration gases flow past the instruments before the gas is evacuated out of the manifold. Placement of Probes and Manifolds Probes and manifolds must be placed to avoid introducing bias to the sample. Important considerations are probe height above the ground, probe length (for horizontal probes), and physical influences near the
probe. Some general guidelines for probe and manifold placement are: • probes should not be placed next to air outlets such as exhaust fan openings • horizontal probes must extend beyond building overhangs • probes should not be near physical obstructions such as chimneys which can affect the air flow in the vicinity of the probe • height of the probe above the ground depends on the pollutant being measured. 30 Source: http://www.doksinet Appendix III Zero and Span Verifications for Ambient Air Gas Analyzers A zero and span verification is an unofficial" check of an analyzers response. It may include dynamic checks made with uncertified test concentrations, artificial stimulation of the analyzers detector, electronic or other types of checks of a portion of the analyzer, etc. Zero and span checks are not to be used as a basis for analyzer zero or span adjustments, calibration updates, or adjustment of ambient data. They are intended as quick, convenient checks to be
used between calibrations to check for possible analyzer malfunction or calibration drift. Whenever a zero and span check indicates a possible calibration problem, a multipoint calibration should be carried out before any corrective action is taken. If a zero and span check is to be used in the quality control program, a “reference response” for the check should be obtained immediately following a multipoint calibration while the analyzers calibration is accurately known. Subsequent check responses should then be compared to the most recent reference response to determine if a change in response has occurred. For automatic zero and span checks, the first scheduled check following the calibration should be used for the reference response. It should be kept in mind that any check that involves only part of the analyzers system cannot provide information about the portions of the system not checked and therefore cannot be used as a verification of the overall analyzer calibration.
Physical Zero and Span Adjustments Almost all ambient monitoring instruments have physical means by which to make zero and span adjustments. These adjustments are used to obtain the desired nominal scale range (within the instruments specifications), to provide convenient (nominal) scale units, and to periodically adjust the instruments response to correct for calibration drift. Note: NO/NO /NO analyzers may not have individual zero and span controls for each channel. If that is the case, the zero and span controls must be adjusted only under the conditions specified in the calibration procedure provided in the analyzers operation/instruction manual. Precise adjustment of the zero and span controls may not be possible because of: (1) limited resolution of the controls, (2) interaction between the zero and span controls, and (3) possible delayed reaction to adjustment or a substantial stabilization period after adjustments are made. Precise adjustments may not be necessary because
calibration of the analyzer following zero and span adjustments will define the precise response characteristic (calibration curve). Accordingly, zero and span adjustments must always be followed by a calibration. Allow sufficient time between the adjustments and the calibration for the analyzer to fully stabilize. This stabilization time may be substantial for some analyzers. Also, obtain unadjusted response readings before adjustments are made. Zero and span adjustments do not necessarily need to be made at each calibration. In fact, where only relatively small adjustments would be made, it is probably more accurate not to make the adjustments because of the difficulty of making precise adjustments mentioned earlier. An appropriate question, then, is how much zero or span drift can be allowed before a physical zero or span adjustment should be made to an analyzer? Ideally, all ambient measurements obtained from an analyzer should be calculated or adjusted on the basis 31 Source:
http://www.doksinet of the most recent multipoint calibration or on the basis of both the previous and subsequent calibrations. Zero and Span Control Charts Zero and span control charts are used to monitor the performance of analyzers. Essentially they show analyzer response to zero and span gas, and alert the operator to conditions when corrective action is required. There are many ways to construct control charts. An example of control charts is shown in Figure III-1 For newly installed analyzers, a more frequent zero and span period is recommended to establish the drift characteristics of the instrument. A daily or biweekly period may be used. Once the drift characteristics are established, a less frequent schedule may be used. A minimum schedule of once per week is recommended for all continuous analyzers. In order to observe any negative zero drifts, the zero point of the calibration may be offset by a known positive amount. 32 Source: http://www.doksinet Zero and Span
Control Chart Station ID Pollutant Analyzer ID s/n DATE ZERO SPAN ( SPAN - ZERO ) 1 DRIFT PERIOD 2 3 4 5 6 7 8 9 10 11 12 13 14 15 16 17 18 19 20 21 22 23 24 25 26 27 Vertical Range 1 Division = ppb/ppm +5 Zero Drift 0 -5 +5 Span Drift -5 Vertical Scale 1 Division = 0 ppb/ppm/% Span Standard Concentration= ppm/ppb Zero Drift Control Limits ± ppb/ppm Date Analyzer Calibrated Span Drift Control Limits ± ppb/ppm/% Operator Figure III-1 33 28 29 30 31 32 33 34 Source: http://www.doksinet Appendix IV General Calibration Procedures for Ambient Air Gas Analyzers It is beyond the scope of these guidelines to provide detailed calibration procedures for all analyzers in use. The following are general procedures recommended for the calibration of analyzers in the NAPS
network. These are in addition to the procedures specified in analyzer operation manuals. Certified transfer standards traceable to the (U.S) National Institute of Standards and Technology (NIST) or the (Canadian) Institute of National Measurement Standards (INMS) must be used for all analyzer calibrations. 1. Allow the calibrator to warm up to its operating temperature prior to calibration For permeation systems, allow the system to equilibrate at operating conditions, can take up to 24 hours. 2. When using gas cylinders, purge the pressure regulator and lines as follows: a) Attach the regulator to the calibration gas cylinder and connect a transfer line of inert material of either stainless steel or Teflon from the regulator to the vacuum side of an air pump. Connect a transfer line to the pressure side of the pump to vent the high concentration calibration gas outside the station. b) Turn the pump on. c) Open the regulator valve to evacuate the regulator for 60 seconds. d) Close the
regulator valve and then slowly open the cylinder valve to fill the regulator with calibration gas. (The pump should be left running during this procedure.) e) Close the cylinder valve then open the regulator valve to evacuate the regulator again for 60 seconds. f) Repeat steps d, and e, twice. g) Close the regulator valve. h) Connect a 1/8” transfer line from the purged regulator to the gas inlet of the calibrator (stainless steel recommended for SO2). i) Slowly open the cylinder valve and verify that the regulator out pressure is within calibrator specifications. j) Slowly open the regulator valve. 3. Using a reducer, connect a 3/8” transfer line from one of the calibrator manifold ports to the atmosphere, outside the station, to vent the excess gas. For calibrators without manifolds, use a Tee reducer to connect the 3/8” vent line to the calibrator. Venting outside the station minimizes entrainment of ambient air and reduces the risk of exposure to high gas concentrations
which could be harmful. The length to diameter ratio of the vent line must be at least ten to prevent entrainment of ambient air. 4. Connect a ¼” transfer line from one of the calibrator ports to the analyzer inlet Plug extra manifold ports. For calibrators without manifolds, connect a ¼” transfer line from the Tee reducer to the analyzer inlet. 34 Source: http://www.doksinet 5. Set the calibrator total gas flow output to at least 15 times the intake flow rates of the analyzer(s) connected to the calibrator. The level of excess flow rate, and the length and diameter of the vent line affect system pressurization, which must be avoided. 6. Set the calibrator to produce zero gas 7. Measure the analyzer zero reading and, after verifying stability for 10 minutes, set the analyzer reading to zero. 8. Set the calibrator to generate a concentration equal to about 80% of the selected analyzer range. Measure the analyzer response and, after verifying stability for 10 minutes, set the
analyzer to read the generated concentration value. Verify that the reading remains stable within ± 1% of the set concentration value. 9. Set the calibrator to produce zero gas and re-verify the analyzer zero setting If an adjustment of the zero setting is required, repeat step 8. After the zero and the 80% of range responses are set, introduce gas concentrations of 80%, followed by 60%, 40%, and 20% of range, verifying stability for 10 minutes at each point. 10. Document the pertinent calibration results in the calibration report and in the station logbook. 11. After calibration, reconfigure the analyzer for normal operation 12. Zero and span the analyzer and record the values in the calibration report and station logbook. The span cylinder should be replaced if the span records indicate excessive instability, or if the pressure falls below 300 psi. If a new cylinder is used, its span value should be measured as above and recorded in the calibration report and station logbook. The
above also applies when permeation devices are used for zeroing and spanning. For NOX analyzers, the NO2 channel must also be calibrated, by gas phase titration (GPT) or permeation tube. Ozone analyzers in the NAPS Network are calibrated against a UV photometry ozone transfer standard. The above procedure also applies to ozone calibration, except as they relate to gas cylinders. Following calibration, the analyzer’s internal span function is used to determine the post-calibration span control value. Least Square Regression Analysis for Validation / Correction of Analyzer Data A regression analysis of calibration or audit results provides a quantitative assessment of analyzer performance. Portable calculators are available with regression analysis functions. The following summarizes the steps involved in this calculation 35 Source: http://www.doksinet For this analysis, it is necessary to define the dependent and independent variables. The correct form of the regression equation to
obtain corrected data values from raw analyzer values is when the true values are set as the dependent variable (y), and the analyzer values are set as the independent variable (x). The resultant equation is in the form of: y = ax+b where: y = true value a = slope of calibration or audit curve x = analyzer value b = intercept of calibration or audit curve Defining x and y as described above, a slope of 1.10 indicates that the analyzer reading is 10% low, whereas a slope of 0.95 indicates that the analyzer reading is 5% high The slope parameter is used to assess the accuracy of the instrument readings. The intercept value is used to assess whether the analyzer zero is within acceptable limits. The regression coefficient, R, is an indication of the degree of linearity of the calibration or audit points. These three parameters are rated as follows for assessing analyzer performance in an audit: Slope: Very Good Satisfactory Unsatisfactory 0.95 to 105 0.85 to 094 or 106 to 115 < 0.85
or >115 Intercept: Satisfactory Unsatisfactory < 3% of the full scale > 3% of the full scale Regression Coefficient: Satisfactory Unsatisfactory 0.995 to 1000 < 0.995 When audit results are unsatisfactory for any of these parameters, appropriate corrective action must be taken, and all data collected subsequent to the last satisfactory audit or calibration must be reviewed. Data determined to be valid with correction must be identified as such, with details of the correction documented. Data which cannot be corrected must be invalidated. 36
 When reading, most of us just let a story wash over us, getting lost in the world of the book rather than paying attention to the individual elements of the plot or writing. However, in English class, our teachers ask us to look at the mechanics of the writing.