Datasheet
Year, pagecount:2016, 8 page(s)
Language:English
Downloads:3
Uploaded:March 08, 2018
Size:518 KB
Institution:
-
Comments:
Attachment:-
Download in PDF:Please log in!
Comments
No comments yet. You can be the first!Most popular documents in this category


Content extract
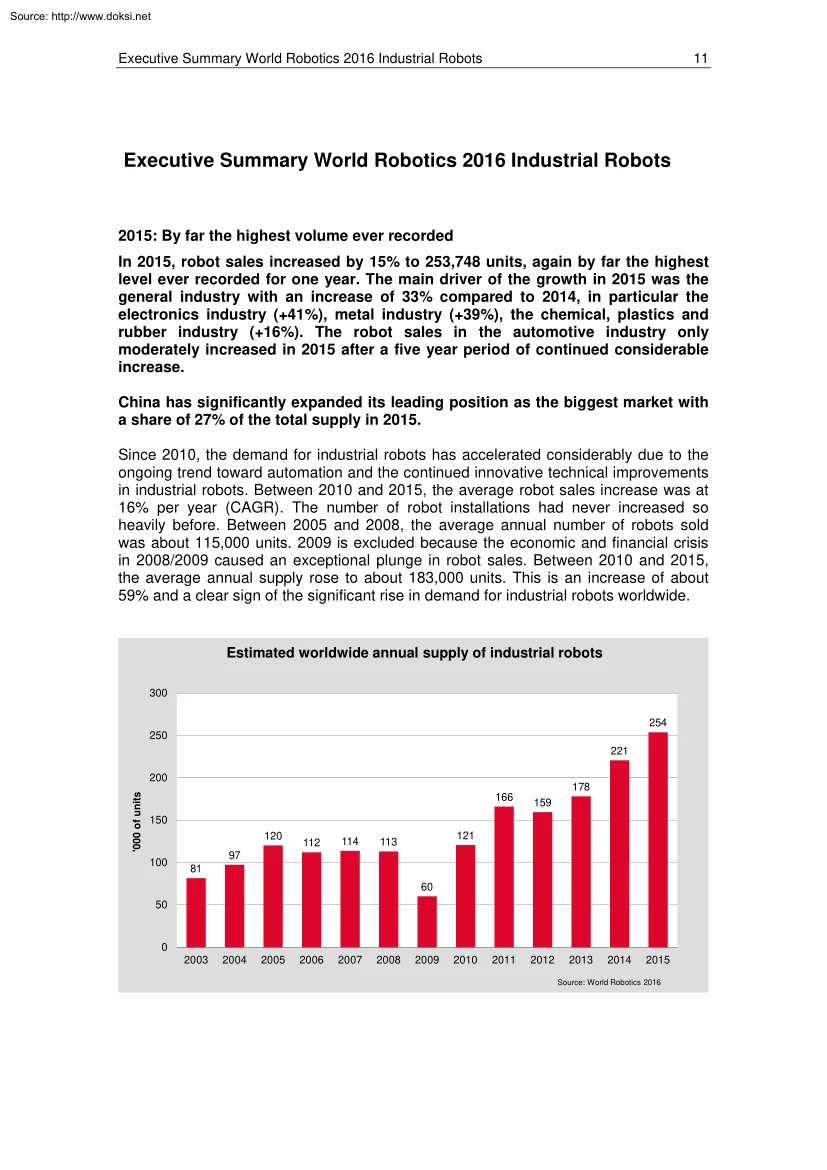
Source: http://www.doksinet Executive Summary World Robotics 2016 Industrial Robots 11 Executive Summary World Robotics 2016 Industrial Robots 2015: By far the highest volume ever recorded In 2015, robot sales increased by 15% to 253,748 units, again by far the highest level ever recorded for one year. The main driver of the growth in 2015 was the general industry with an increase of 33% compared to 2014, in particular the electronics industry (+41%), metal industry (+39%), the chemical, plastics and rubber industry (+16%). The robot sales in the automotive industry only moderately increased in 2015 after a five year period of continued considerable increase. China has significantly expanded its leading position as the biggest market with a share of 27% of the total supply in 2015. Since 2010, the demand for industrial robots has accelerated considerably due to the ongoing trend toward automation and the continued innovative technical improvements in industrial robots. Between 2010
and 2015, the average robot sales increase was at 16% per year (CAGR). The number of robot installations had never increased so heavily before. Between 2005 and 2008, the average annual number of robots sold was about 115,000 units. 2009 is excluded because the economic and financial crisis in 2008/2009 caused an exceptional plunge in robot sales. Between 2010 and 2015, the average annual supply rose to about 183,000 units. This is an increase of about 59% and a clear sign of the significant rise in demand for industrial robots worldwide. Estimated worldwide annual supply of industrial robots 300 254 250 221 000 of units 200 178 166 159 150 120 100 112 114 121 113 97 81 60 50 0 2003 2004 2005 2006 2007 2008 2009 2010 2011 2012 2013 2014 2015 Source: World Robotics 2016 Source: http://www.doksinet 12 Executive Summary World Robotics 2016 Industrial Robots Asia, the most important region Asia (Australia and New Zealand included in the category) is still the
worlds strongest growth market. This region saw a total of 160,600 units sold in 2015 – a rise of 19% This was the highest sales level ever recorded for the fourth year in a row. Industrial robot sales to the second largest market, Europe, increased by 10% to 50,100 units (again a new peak like in 2014). About 38,100 industrial robots were shipped to the Americas, 17% more than in 2014, establishing a new peak for the fourth year in a row. 75% of the global robot sales in five countries There are five major markets representing 75% of the total sales volume in 2015: China, the Republic of Korea, Japan, the United States, and Germany. Sales volume increased from 70% in 2014. Since 2013 China is the biggest robot market in the world with a continued dynamic growth. With sales of about 68,600 industrial robots in 2015 – an increase of 20% compared to 2014 - China alone surpassed Europe’s total sales volume (50,100 units). Chinese robot suppliers installed about 20,400 units
according to the information from the China Robot Industry Alliance (CRIA). Their sales volume was about 29% higher than in 2014. Foreign robot suppliers increased their sales by 17% to 48,100 units (including robots produced by international robot suppliers in China). The market share of Chinese robot suppliers grew from 25% in 2013 to 29% in 2015. Between 2010 and 2015, total supply of industrial robots increased by about 36% per year on average. (For more details see chapter 331) About 38,300 units were sold to the Republic of Korea, 55% more than in 2014. The increase is partly due to a number of companies which started to report their data only in 2015. The actual growth rate in 2015 is estimated at about 30% to 35% (For more details see chapter 3.35) In 2015, robot sales in Japan increased by 20% to about 35,000 units reaching the highest level since 2007 (36,100 units). Robot sales in Japan followed a decreasing trend between 2005 (reaching the peak at 44,000 units) and 2009
(when sales dropped to only 12,767 units). Between 2010 and 2015, robot sales increased by 10% on average per year (CAGR). (For more details see chapter 334) Increase in robot installations in the United States continued in 2015, by 5% to the peak of 27,504 units. Driver of this continued growth since 2010 was the ongoing trend to automate production in order to strengthen American industries on the global market and to keep manufacturing at home, and in some cases, to bring back manufacturing that had previously been sent overseas. (For more details see chapter 322) Germany is the fifth largest robot market in the world. In 2015, the number of robots sold increased slightly to a new record high at 20,105 units compared to 2014 (20,051 units). In spite of the high robot density of 301 units per 10,000 employees, annual sales are still very high in Germany. Between 2010 and 2015, annual sales of industrial robots increased by an average of 7% in Germany (CAGR). (For more details see
chapter 3.31) Other important Asian markets Since 2013, Taiwan has ranked sixth among the most important robot markets in the world with regard to the annual supply. Robot installations increased considerably Source: http://www.doksinet Executive Summary World Robotics 2016 Industrial Robots 13 between 2010 and 2015, by 17% on average per year (CAGR). In 2015, robot sales increased by 4% to about 7,200 units, a new peak. However, the number of units in Taiwan is far below the number in Germany, which ranked fifth with 20,100 units. Thailand is also a growing robot market in Asia. In 2015, the supply of industrial robots declined by 30% to about 2,600 units. The peak was reached in 2012 with about 4,000 units. Robot sales to India slightly decreased to about 2,100 units in 2015 This is slightly lower than the peak level of 2014. Robot supplies to other Southeast Asian countries like Malaysia, Singapore and Vietnam increased considerably in 2015. (For more details see chapter 3.3)
Other important European markets Italy is the second largest robot market in Europe after Germany. Worldwide, it ranked 7th in 2015 like in 2014. Robot investments continued to increase in 2015 Total sales of industrial robots were up by 7%, to almost 6,700 units, which is a new peak. Between 2010 and 2013, annual robot sales to Italy were rather weak due to the critical economic situation. The French robot market continued to increase in 2015, by 3% to almost 3,045 units. In Spain, sales of industrial robots surged by 63% to about 3,800 units, the highest number ever recorded. Sales of industrial robots to the United Kingdom further decreased in 2015 to 1,645 units. Robot installations in all other Western European and Nordic countries as well as in the Czech Republic and in Poland were considerably up in 2015. Sales to Turkey continued to increase in 2015 (For more details see chapter 3.4) Other important American markets Mexico has become an important emerging market for industrial
robots. Robot sales more than doubled, to about 5,500 units in 2015, by far the highest sales volume ever registered for the country. In Canada, robot sales surged by 49% to about 3,500 units in 2015, a new peak. In 2015, robot sales to Brazil recovered by 11% to 1,400 units (For more details see chapter 3.2) Main drivers of the growth: electrical/electronics industry, metal industry and rubber and plastics industry Between 2010 and 2014, the automotive industry – the most important customer of industrial robots – had considerably increased investments in industrial robots worldwide. In 2015, robot sales increased by 4% to about 97,500 units establishing again a new peak for the fifth time in a row. The share of the total supply in 2015 was about 38%. Between 2010 and 2015, robot sales to the automotive industry increased by 20% on average per year (CAGR). Since 2010, investments in new production capacities in the emerging markets as well as investments in production modernization
in major car producing countries have caused the number of robot installations to rise. Using new materials, developing energy efficient drive systems, as well as high competition in all major car markets, pushed for investments despite the existing overcapacities. Robot sales to the electrical/electronics industry (including computers and equipment, radio, TV and communication devices, medical equipment, precision and optical instruments) were significantly up in 2015, by 41% to 64,600 units, establishing again a new peak. This was more than double the sales volume in 2010 Share of the total supply in 2015 was about 25%. The rising demand for electronic products and new products, as well as the need to automate production (particularly in low wage countries), were the driving factors for the boost in sales. Source: http://www.doksinet 14 Executive Summary World Robotics 2016 Industrial Robots In 2015, sales to the metal and machinery industry were significantly up by 39% to
29,450 units, a new peak, for the third year in a row. The share of the total supply was 12%. Since 2010, sales of all subsectors (basic metals, metal products, industrial machinery) have followed an increasing trend. Between 2010 and 2015, the average annual growth rate was 26%. The rubber and plastics industry has continuously increased the number of robot installations since 2009 from about 5,800 units to 17,300 units in 2015, again a new peak. Share of the total supply in 2015 was about 7% Between 2010 and 2015, sales were up by 14% on average per year. Estimated worldwide annual supply of industrial robots at year-end by industries 2013 - 2015 Automotive industry Electrical/electronics Metal 2015 2014 Chemical, rubber and plastics 2013 Food Others Unspecified 0 20,000 40,000 60,000 80,000 units 100,000 120,000 Source: World Robotics 2016 Sales to all industries, except for automotive and electrical/electronics, increased by 27% in 2015. Between 2010 and 2015, the
average growth rate per year was 19% The respective growth rate for the automotive industry was 20% and for the electrical/electronics industry 15%. This is a clear sign that not only the main customer industries (automotive industry and electrical/electronics industry) have increased robot installations considerably in recent years, but other industries have done so as well. Continued considerable increase of worldwide operational stock The total worldwide stock of operational industrial robots at the end of 2015 increased by 11% to about 1.6 million units Since 2010, the stock has been increasing considerably by 9% on average per year. Value of the global market was up to US$11.1 billion In 2015, the sales value increased by 9% to a new peak at US$11.1 billion It should be noted that the figures cited above generally do not include the cost of software, peripherals and systems engineering. Including the mentioned costs might result in the actual robot systems’ market value to be
about three times as high. The Source: http://www.doksinet Executive Summary World Robotics 2016 Industrial Robots 15 worldwide market value for robot systems in 2015 is therefore estimated to be US$35 billion. High potential for robot installations in many countries When comparing the distribution of multipurpose industrial robots in various countries, the robot stock, expressed in the total number of units, can sometimes be a misleading measure. In order to take into account the differences in the size of the manufacturing industry in various countries, it is preferable to use a measure of robot density. One such measure of robot density is the number of multipurpose industrial robots per 10,000 persons employed in manufacturing industry or in the automotive industry or in the “general industry” (which is all industries excluding the automotive industry). The average global robot density is about 69 industrial robots installed per 10,000 employees in the manufacturing
industry in 2015. The most automated markets are the Republic of Korea, Singapore, Japan and Germany. The Republic of Korea has by far the highest robot density in the manufacturing industry. 531 industrial robots were in operation in 2015 per 10,000 employees. The rate increased from 241 units in 2009 due to continued installation of a large volume of robots since 2010, particularly in the electrical/electronics industry and in the automotive industry. It is followed by Singapore with a rate of 398 robots in 2016. The robot density was calculated for the first time in the 2015 survey. Due to a very low number of employees in the manufacturing industry and the increasing number of installed robots, the robot density is very high. The robot density in Japan further decreased to 305 units, and in Germany it continued to increase to 301 units. The United States which is one of the five the biggest robot markets regarding annual supply has a robot density of 176 units in 2015. The robot
density in China, the biggest robot market since 2013, reached 49 units in 2015 unveiling the huge potential for robot installations in this market. In 2015, the average robot density in the following regions was: 92 units in Europe, 86 in the Americas and only 57 in Asia. The considerable high rate of automation of the automotive industry compared to all other sectors is demonstrated in the evaluation of the number of industrial robots in operation per 10,000 employees in automotive industry and in all other industries. Despite its shrinking robot density, Japan had still the highest robot density in the automotive industry. 1,276 industrial robots were installed per 10,000 employees in Japan’s automotive industry. It is followed by the Republic of Korea with 1,218 units, the United States also with 1,218 units and Germany with 1,147 units. The robot density in the automotive industry in China has increased significantly since 2007 but compared to countries like Korea, Germany, and
the United States, it is still on a rather moderate level (392 units). The reason is the large number of employees working in the automotive industry. According to the China Statistical Yearbook about 35 million people worked in the automotive industry (including automotive parts) in 2014. The number increased from 3.4 million in 2013 In 2015, about 21 million cars were produced in China, the highest volume of cars produced in a country, accounting for about 30% of the global car production. The need to modernize and to further increase capacities will boost robot installations in the coming years. The robot density in the automotive industry in the United States increased only moderately between 2011 and 2015 (from 1,103 to 1,218 units), while the operational stock rose considerably in the same period. The reason is the remarkable rise in employment in the automotive industry in the same period. The employment rate in the automotive industry increased by 27% in 2015 compared to 2011.
Source: http://www.doksinet 16 Executive Summary World Robotics 2016 Industrial Robots The robot density in the general industry (all industries excluding automotive) is still comparatively low. However, countries with an important electronics industry have a higher rate. The Republic of Korea is on top with 411 robots installed per 10,000 employees. It is followed by Japan with 213 robots, Germany with 170, Taiwan with 159, and Sweden with 154 units. Germany and Sweden do not have any important production sites regarding the electronics industry. The comparatively high rate in both countries is due to a more diversified distribution of industrial robots in all industries. The increasing automation in the production of electronic devices will push robot installations within the related production hubs, particularly in Asian countries. Italy ranks sixth with a robot density of 126 units. It is followed by Austria with 95 units and the United States with 93 units. Most of the
emerging robot markets have a robot density rate below 30. The United Kingdom also has a rather low rate in the general industry; only 33 robots are installed per 10,000 employees. The overall conclusion indicates that in almost all the surveyed countries, the potential for robot installations in the general industry is still tremendous. It is also considerably high in the automotive industry among the emerging markets and in some traditional markets as well. Continued necessary modernization and retooling also guarantee further robot investments in already highly automated countries. Relocation of productions may result in declining investments in that country. However, robot investments will be shifted to the new production base in another country. Double-digit growth between 2016 and 2019 Industry 4.0, linking the real-life factory with virtual reality, will play an increasingly important role in global
manufacturing. Human-robot collaboration will have a breakthrough in this period. Compact and easy-to-use collaborative robots will drive the market in the coming years. Global competition requires continued modernization of production facilities. Energy-efficiency and using new materials, e.g carbon-composites, require continued retooling of production. Growing consumer markets require expansion of production capacities. Decline in products’ life cycle and an increase in the variety of products require flexible automation. Continuous quality improvement requires sophisticated high tech robot systems. Robots improve the quality of work by taking over dangerous, tedious and dirty jobs that are not possible or safe for humans to perform. Continued strong demand from the automotive industry. Accelerating demand from the electrical/electronics industry. Increasing demand from the metal and machinery industry, the rubber and plastics industry, the food and beverage industry. Small and
medium sized companies will increasingly use industrial robots. China will remain the main driver of the growth and will expand its dominance. By 2019, almost 40% of the global supply will be installed in China. Continued increase of robot installations in all major Asian robot markets: Korea, Japan, Taiwan and other Southeast Asian markets. Continued growth in North America – recovering sales in the near future in Brazil. Accelerating growth of robot sales in Central and Eastern Europe. Moderate growth of robot sales in Western Europe. Source: http://www.doksinet Executive Summary World Robotics 2016 Industrial Robots 17 Global robot installations are estimated to increase at least by 14%, to about 290,000 units in 2016. Robot supplies in the Americas will increase by 5%, in Asia/Australia by 18%, and in Europe by 8%. From 2017 to 2019, robot installations are estimated to increase by at least 13% on average per year (CAGR): 8% in the Americas and in Europe and 15% in
Asia/Australia. Total global sales will reach about 413,000 units in 2019 Between 2016 and 2019, it is estimated that more than 1.4 million new industrial robots will be installed in factories around the world. The global robotics industry is prepared for this challenge. Production capacities have been expanded and some suppliers have established or will establish robot production assemblies in the most important market, China, or in the United States. In terms of units, it is estimated that the worldwide stock of operational industrial robots will increase from about 1,631,600 units at the end of 2015 to 2,589,000 units at the end of 2019, representing an average annual growth rate of 12% between 2016 and 2019. In 2015, the stock increased by 12% to about 18 million units The operational stock of robots in 2016 is estimated to increase by 9% in the Americas, by 16% in Asia/Australia, and by 6% in Europe. Between 2017 and 2019, the stock will increase by 9% on average per year in the
Americas, by 16% in Asia/Australia, and by 6% in Europe. Annual supply of industrial robots 2014-2015 and forecast for 2016-2019 300,000 250,000 units 200,000 150,000 100,000 50,000 0 2014 2015 2016* Asia/Australia 2017* Europe America 2018* 2019* Source: World Robotics 2016 Source: http://www.doksinet 18 Executive Summary World Robotics 2016 Industrial Robots Table 1 Estimated yearly shipments of multipurpose industrial robots in selected countries. Number of units Country America Brazil North America Rest of South America Asia/Australia 2014 32,616 2015 38,134 2016* 40,200 2019* 50,700 1,266 1,407 1,800 3,500 31,029 36,444 38,000 46,000 321 283 400 1,200 134,444 160,558 190,200 285,700 China 57,096 68,556 90,000 160,000 India 2,126 2,065 2,600 6,000 Japan 29,297 35,023 38,000 43,000 Republic of Korea 24,721 38,285 40,000 46,000 Taiwan 6,912 7,200 9,000 13,000 Thailand 3,657 2,556 3,000 4,500 other
Asia/Australia Europe 10,635 6,873 7,600 13,200 45,559 50,073 54,200 68,800 11,300 Central/Eastern Europe 4,643 5,976 7,550 France 2,944 3,045 3,300 4,500 20,051 20,105 21,000 25,000 Italy 6,215 6,657 7,200 9,000 Spain 2,312 3,766 4,100 5,100 United Kingdom other Europe 2,094 7,300 1,645 8,879 1,800 9,250 2,500 11,400 Germany Africa not specified by countries* Total 428 348 400 800 7,524 4,635 5,000 8,000 220,571 253,748 290,000 414,000 Sources: IFR, national robot associations. *forecast * reported and estimated sales which could not be specified by countries
 Just like you draw up a plan when you’re going to war, building a house, or even going on vacation, you need to draw up a plan for your business. This tutorial will help you to clearly see where you are and make it possible to understand where you’re going.