Datasheet
Year, pagecount:2012, 8 page(s)
Language:English
Downloads:4
Uploaded:February 05, 2018
Size:1 MB
Institution:
-
Comments:
Attachment:-
Download in PDF:Please log in!
Comments
No comments yet. You can be the first!What did others read after this?


Content extract
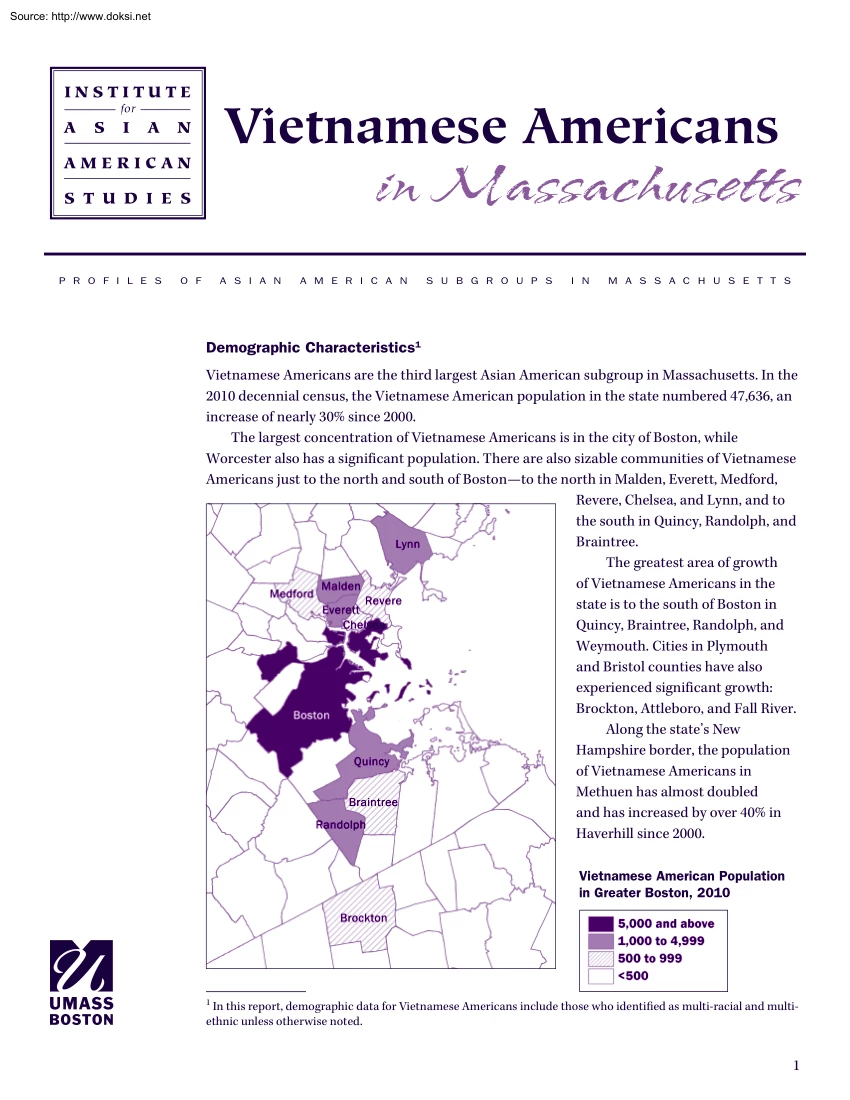
Source: http://www.doksinet INSTITUTE Vietnamese Americans for A S I A N in Massachusetts AMERICAN S T U D I E S P R O F I L E S O F A S I A N A M E R I C A N S U B G R O U P S I N M A S S A C H U S E T T S Demographic Characteristics1 Vietnamese Americans are the third largest Asian American subgroup in Massachusetts. In the 2010 decennial census, the Vietnamese American population in the state numbered 47,636, an increase of nearly 30% since 2000. The largest concentration of Vietnamese Americans is in the city of Boston, while Worcester also has a significant population. There are also sizable communities of Vietnamese Americans just to the north and south of Bostonto the north in Malden, Everett, Medford, Revere, Chelsea, and Lynn, and to the south in Quincy, Randolph, and Braintree. The greatest area of growth of Vietnamese Americans in the state is to the south of Boston in Quincy, Braintree, Randolph, and Weymouth. Cities in Plymouth and Bristol counties have
also experienced significant growth: Brockton, Attleboro, and Fall River. Along the state’s New Hampshire border, the population of Vietnamese Americans in Methuen has almost doubled and has increased by over 40% in Haverhill since 2000. Vietnamese American Population in Greater Boston, 2010 1 In this report, demographic data for Vietnamese Americans include those who identified as multi-racial and multiethnic unless otherwise noted. 1 Source: http://www.doksinet Population and Growth of Vietnamese Americans in Selected Cities and Towns in Massachusetts, 2000 and 2010 Boston Worcester Quincy Randolph Lowell Springfield Malden Lynn Everett Revere Lawrence Brockton Methuen Medford Braintree Chelsea 2000 11,376 5,061 1,850 762 1,769 1,601 1,434 1,255 736 437 779 387 292 342 148 901 2010 11,670 5,759 3,297 2,150 2,057 1,997 1,874 1,117 1,051 750 702 598 573 516 501 501 % change 2.6% 13.8% 78.2% 182.2% 16.3% 24.7% 30.7% -11.0% 42.8% 71.6% -9.9% 54.5% 96.2% 50.9% 238.5% -44.4%
Vietnamese Americans are considerably younger than the general population; the statewide median age for Vietnamese Americans is 32.3 years as compared to 391 years for the overall population. However, the median age of Vietnamese Americans rose considerably in the last decade, from 28.1 to 323 In 2010, 65% of the Vietnamese American population was over the age of 65, as opposed to only 3.4% in 2000 Vietnamese Americans are a multi-faceted group with varied ethnic, linguistic, and socio-economic backgrounds. They include members of ethnic groups such as Chinese, Khmer, and Cham, and they may speak Cantonese, Mandarin, and Khmer as well as Vietnamese American Population by Vietnamese.2 Cross-cultural influences are Age and Sex in Massachusetts, 2010 evident in areas such as Boston’s Chinatown, where some business signs are in both Male Female Vietnamese and Chinese, and in Lowell, 0–4 years 1,886 1,851 where some business owners and employees 5–17 4,928 4,666 speak both Vietnamese
and Khmer. There 18–24 2,572 2,829 25–34 3,036 3,914 are also Amerasians, whose parents are 35–44 4,196 4,472 American mensoldiers stationed in 45–54 2,956 2,689 Vietnam during the warand Vietnamese 55–64 2,102 2,441 women. 65–74 1,148 1,090 Different waves of immigration 75+ 394 466 also brought Vietnamese with particular TOTAL 23,218 24,418 characteristics to the U.S For example, the 2 Le, C.N Asian American Assimilation: Ethnicity, Immigration, and Socioeconomic Attainment New York: LFB Scholarly Publishing, 2007. See chapter 3 2 Source: http://www.doksinet Vietnamese American Population in Massachusetts, 2010 Vietnamese alone (one race, one subgroup) 42,915 Vietnamese alone or in combination with one or more other Asian subgroups 45,380 Vietnamese alone or in any combination (one or more races and Asian subgroups) 47,636 first wave of Vietnamese Americans came immediately after the Vietnam War ended in 1975 and contained many high ranking governmental and
military officials and their families. The second wave in the late 1970s and early 1980s was a diverse group generally of more modest socio-economic backgrounds, many of whom escaped Vietnam under harrowing circumstances.3 While earlier migration of Vietnamese to the U.S included large numbers of refugees, immigration in the last decade has been primarily through family sponsorship by Vietnamese Americans.4 Population growth in Massachusetts has also occurred due to domestic migration as Vietnamese Americans have moved from other states to join established communities here and to seek economic opportunities. Socio-Economic Characteristics5 Vietnamese Americans in Massachusetts by Nativity and Citizenship, 2008–2010 Not a U.S citizen 18% Native born 32% Naturalized citizen 50% Decade of Entry for Foreign-born Vietnamese Americans in Massachusetts, 2008–2010 Entered 2000 or later 1990–1999 Before 1990 20.4% 45.9% 33.7% This section presents an overview of social and economic
characteristics for Vietnamese Americans in the state using the 2008–2010 American Community Survey 3-year estimates. Currently, approximately 68% of Vietnamese Americans in Massachusetts are foreign born, a significantly smaller proportion than 2000, when over three-quarters were foreign-born. A much larger percentage of the Vietnamese American population are citizens now than ten years ago: eight in ten as compared to six in ten in 2000. Nearly one in eight foreign-born Vietnamese Americans arrived in the U.S twenty years ago or more. One in five arrived in the past decade English proficiency for immigrants has always been an important factor in their social and economic well-being in the United States. In Massachusetts, limited English-speaking ability is an issue for a significant number of Vietnamese Americans. Almost 58% of Vietnamese Americans aged five and older who speak a language other than English speak English “less 3 Ibid. Ibid., 36 (see Table 21) 5 Socio-economic
data are for Vietnamese Americans who indicated they are Vietnamese only, that is, of one racial group and one Asian subgroup. 4 3 Source: http://www.doksinet than very well”. This is a moderate improvement from 2000 when 64% of the same cohort spoke English “less than very well.” Economic status indicators for Vietnamese Americans as a group lag significantly behind those for the general population. For example, the median household income for Vietnamese Americans in the state is $48,252, only 75% of the median household income for total population, $63,961. Additionally, the per capita income for Vietnamese Americans is $19,303, only 57% of the per capita income for the total population, $33,969. The median earnings for males and females in the Vietnamese American population are $40,539 and $31,510 respectivelyabout 70% that of all males and all females. The poverty rates for Vietnamese Americans are also higher than those of the total population: 16.4% of Vietnamese
American families’ incomes fall below the poverty rate as compared to 7.5% for families in the total population For all Vietnamese American people, the poverty rate is 17.5 % as compared to 108% in the total population However, Vietnamese Americans experienced a large drop in poverty since 2000, when their poverty rates were 21.2% for families, and 242% for individuals In contrast, poverty rates for the total population increased by about 1 percentage point since 2000. The largest discrepancies in broad U.S census occupational categories between Vietnamese Americans and the total population are in the management, business, science and arts category, where Vietnamese Americans are much less concentrated, and the production, transportation, and material moving category, where Vietnamese Americans are much more highly concentrated. The management, business, science, and arts category used by the U.S Census Bureau, it should be noted, is very broad and includes several subcategories such
as computer, education, legal, social service, and entertainment occupations, as well as healthcare practitioners and technicians. Vietnamese Americans are well represented in the service category, which includes healthcare support, food preparation and serving-related, and personal care occupations. It has been well documented that Vietnamese Americans are highly concentrated in nailcare services nationally. A nails industry magazine reported that 45% of nail technicians nationally are of Vietnamese descent.6 Massachusetts is not an exception: a search by New Ecology Inc in 2006 found more than 4,000 licensed Vietnamese American nail technicians in “Boston and surrounding suburbs.”7 Nail salons are a viable source of employment for many Vietnamese Broad Occupational Categories for Vietnamese Americans and Total Population in Massachusetts for Civilian Employed Persons Aged 16 Years and Over, 2008–2010 Management, business, science, and arts Service Sales and office Natural
resources, construction, and maintenance Production, transportation, and material moving 6 Vietnamese American Total Population 27.4% 26.3% 15.9% 6.7% 23.6% 42.9% 16.9% 24.0% 7.1% 9.0% Nails Magazine, 2011–2012 Industry Statistics, www.nailsmagcom Doan, Tam. “Toxicity, Safety and Performance Evaluation of Alternative Nail Products” Cambridge, MA: New Ecology Inc., January 2006 7 4 Source: http://www.doksinet Americans who are not fluent in English and do not have a high level of education. In the area of educational attainment, a much larger portion of Vietnamese Americans aged 25 or older, 36%, have less than a high school education than the general population, 11%. On the other end of the spectrum, only 7% of Vietnamese Americans have advanced degrees, less than half the rate of the general population. Educational Attainment of Vietnamese Americans and Total Population in Massachusetts Aged 25 Years and Over, 2008–2010 Less than high school degree High school
degree or higher Bachelor’s degree or higher Graduate or professional degree Vietnamese American Total Population 36.4% 63.6% 22.5% 7.2% 11.1% 88.9% 38.5% 16.5% 100% 90% 80% 70% 60% 50% 40% 30% 20% 10% 0% Less than high High school Bachelors degree school degree degree or higher or higher Vietnamese American Graduate or professional degree Total Population Vietnamese Americans in Boston8 Home to Vietnamese American non-profit organizations, over 100 Vietnamese-owned businesses,9 numerous Vietnamese religious institutions, the first Vietnamese American community center in the country built from the ground up, and the first Vietnamese-language voting ballot on the East Coast, Boston has been the core of many Vietnamese American community building and entrepreneurial efforts in the Northeast. More specifically, the Vietnamese American community in Boston is centered in the neighborhood of Dorchester, where seven out of ten Vietnamese Americans in Boston live. The Fields Corner
area, located around the intersection of Dorchester Avenue and Adams Street, is the center for many Vietnamese American social and economic activities, but businesses and residents are also located beyond this area as well, with Vietnamese travel agencies, medical offices, supermarkets, and bakeries stretched along Dorchester Avenue from Columbia Road to Gallivan Boulevard. For nearly two decades, there have been two major Vietnamese American community organizations in Fields Corner, a social service agency and a community development corporation (CDC). The CDC, Viet-AID, was responsible for the construction of the first Vietnamese American community center in the country, which was built in 2002. 8 Census data for Vietnamese Americans in Boston and other cities and towns is from the 2006–2010 American Community Survey 5-year estimates. 9 Borges-Mendez, Liu, and Watanabe. Immigrant Entrepreneurs and Neighborhood Revitalization Malden, MA: Immigrant Learning Center, December 2005, p.
21 5 Source: http://www.doksinet Census data for the Vietnamese American population in Boston can be found in the 2006–2010 American Community Survey 5-year estimates and is not directly comparable to the 3-year estimates used for the statewide data above. The 2006–2010 data set clearly includes information collected prior to the 2008 economic crisiseven so, the data shows that Vietnamese Americans in Boston are more economically disadvantaged than in the state overall. A look at the social characteristics of this population indicates that Vietnamese Americans in Boston are slightly more likely to be foreign-born than statewide (70.4%) and are also more likely to have arrived in the U.S in 2000 or later (276%) A higher percentage of those five years and older who speak a language other than English, 67.2%, speak English “less than very well” Economic status indicators show significant discrepancies between Boston and statewide data. The median household income for
Vietnamese Americans in Boston is only $32,969 and the per capita income only $14,268. The poverty rates for Vietnamese American families and individuals in Boston Income for Vietnamese Americans in Boston are double that of the statewide rates (see and Statewide, 2006–2010* chart at bottom left). $60,000 In terms of educational attainment, $48,252 $50,000 Vietnamese Americans in Boston lag somewhat behind the statewide Vietnamese $40,000 $32,969 American population: 41.3% have less than $30,000 $19,303 a high school degree, and only 17.4% have a $20,000 $14,268 bachelor’s degree or higher. $10,000 Not surprisingly, the percentage of $0 Vietnamese American homeowners in Median Household Per Capita Income Boston is significantly lower than statewide. Income Statewide, nearly half of VietnameseBoston Statewide occupied housing units are owned (48.8%) while in Boston, only about a quarter are *In 2010 inflation-adjusted dollars. (27.3%) Poverty Rates for Vietnamese Americans in Boston
and Statewide, 2006–2010 40% 35% 30% 25% 20% 15% 10% 5% 0% 36.3% 32.8% 16.4% Families Boston 6 17.5% Individuals Statewide Vietnamese Americans in Worcester Worcester, Massachusetts’ second largest city, is also home to the second largest concentration of Vietnamese Americans in the state. The Vietnamese American population in the city numbers just over 5,700 with an increase of 14% since 2000. As in Boston, the Catholic community in Worcester was active in helping to resettle Vietnamese refugees after the Vietnam War ended in 1975. Vietnamese Americans have had a significant presence in Worcester, representing approximately 50% of the Asian American population in the city in the past Source: http://www.doksinet two decades. Vietnamese American businesses are primarily clustered around Green Street, South Main Street and Park Avenue. Community-based organizing efforts in the city have often encompassed Southeast Asian Americans rather than only Vietnamese. There is
currently only one social service organization that serves primarily Southeast Asian Americans in Central Massachusetts, the Southeast Asian Coalition which was established in 2001. It serves Cambodians and Lao as well as Vietnamese Americans and offers translation services, ESL classes, youth and civic engagement programs and cultural events.10 Like Vietnamese Americans in Boston, Vietnamese Americans in Worcester face significant social and economic challenges. One in seven who speak a language other than English speak English “less than very well.” While about the same percent have less than a high school education as Vietnamese Americans statewide, fewer Vietnamese Americans in Worcester have bachelor’s or graduate degrees. The median household income of Vietnamese Americans in Worcester is $35,114, about 78% of that of the total population in the city. Per capita income is $15,386, about 63% of that of the total population. Poverty rates for Vietnamese Americans in Worcester
are also quite high24.5% for families, and 27% for all peoplealthough not as high as the poverty rates for Vietnamese Americans in Boston. A noticable difference of Vietnamese Americans in Worcester as compared to Boston or statewide is in occupational categories. There is a higher percentage of Vietnamese Americans working in service occupations, 34.7%, and in production, transportation, and material moving areas, 36.6%, than in Boston or statewide One advantage to living in Worcester is that real estate is more affordablenearly 4 in 10 (38.8%) housing units occupied by Vietnamese Americans are owned rather than rented, a considerably higher rate than in Boston. Other Concentrations in Massachusetts There are smaller but sizable Vietnamese American communities in Springfield and Lowell that date back over 30 years. But the greatest growth in the Vietnamese American population is not in these historic, urban communities but in the suburbs of Boston, particularly to the south. Data from
the American Community Survey, although not highly reliable when sample sizes are small, indicates that Vietnamese Americans in Quincy and Randolph are relatively affluent. The median household income for Vietnamese Americans in Quincy is $61,354, well above the statewide median of $48,252. Vietnamese Americans in Quincy are also more concentrated in sales and office occupations (25.9%), less in production, transportation, and material moving occupations (16.3%), and less in service (194%) than Vietnamese Americans statewide. Notable demographic, social and economic changes have occurred in the Vietnamese American population in Massachusetts since 2000. Continued study of developments in this population is neededboth to recognize their social and economic contributions to the state and to address ongoing challenges. This report was written by Shauna Lo, Assistant Director at the Institute for Asian American Studies, and Thao Tran, former graduate assistant at the Institute for Asian
American Studies. 10 Interview with Thuha Le by Shauna Lo, June 26, 2012. 7 Source: http://www.doksinet INSTITUTE FOR ASIAN AMERICAN STUDIES University of Massachusetts Boston The Institute for Asian American Studies at the University of Massachusetts Boston conducts community-based research on Asian American issues, provides resources to Asian American communities in Massachusetts, and expands opportunities on campus for the study of Asian American experiences. 100 Morrissey Boulevard Boston, MA 02125-3393 (617) 287-5650 www.iaasumbedu asianaminst@umb.edu August 2012 8