Datasheet
Year, pagecount:2018, 3 page(s)
Language:English
Downloads:2
Uploaded:April 02, 2018
Size:774 KB
Institution:
-
Comments:
Attachment:-
Download in PDF:Please log in!
Comments
No comments yet. You can be the first!Most popular documents in this category


Content extract
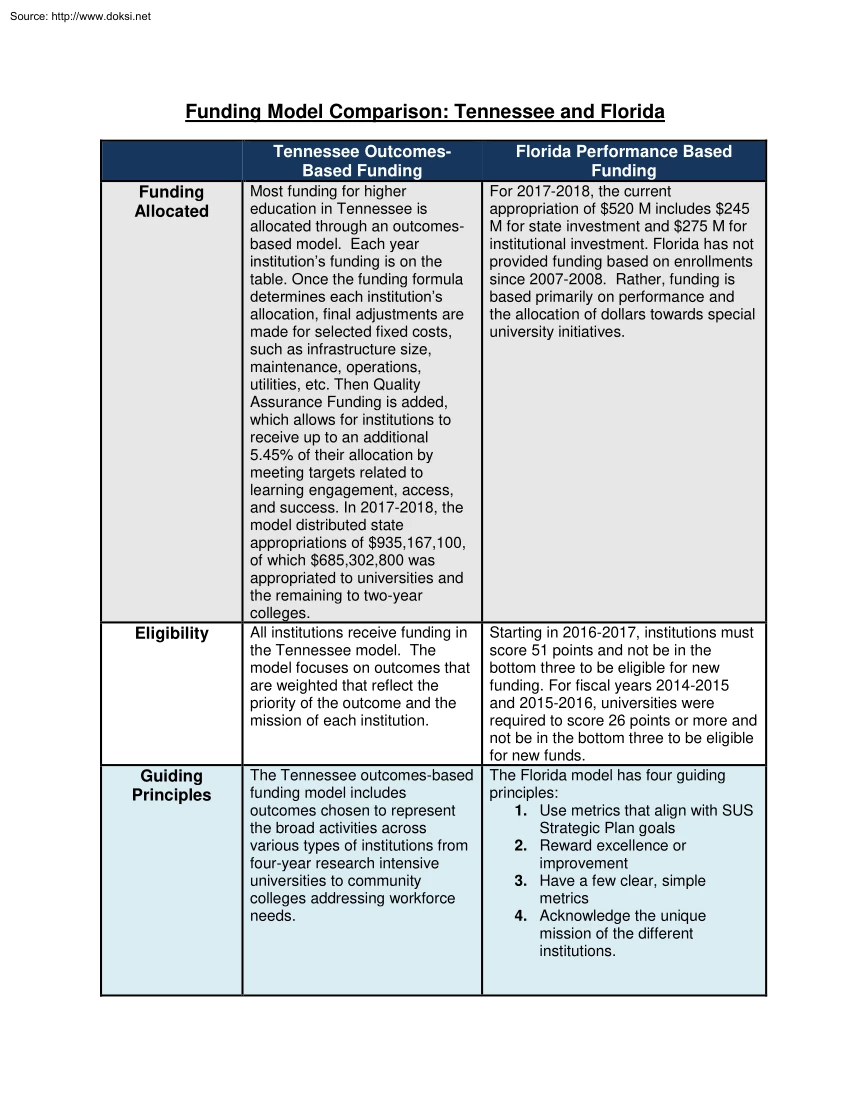
Source: http://www.doksinet Funding Model Comparison: Tennessee and Florida Funding Allocated Eligibility Guiding Principles Tennessee OutcomesBased Funding Florida Performance Based Funding Most funding for higher education in Tennessee is allocated through an outcomesbased model. Each year institution’s funding is on the table. Once the funding formula determines each institution’s allocation, final adjustments are made for selected fixed costs, such as infrastructure size, maintenance, operations, utilities, etc. Then Quality Assurance Funding is added, which allows for institutions to receive up to an additional 5.45% of their allocation by meeting targets related to learning engagement, access, and success. In 2017-2018, the model distributed state appropriations of $935,167,100, of which $685,302,800 was appropriated to universities and the remaining to two-year colleges. All institutions receive funding in the Tennessee model. The model focuses on outcomes that are
weighted that reflect the priority of the outcome and the mission of each institution. For 2017-2018, the current appropriation of $520 M includes $245 M for state investment and $275 M for institutional investment. Florida has not provided funding based on enrollments since 2007-2008. Rather, funding is based primarily on performance and the allocation of dollars towards special university initiatives. The Tennessee outcomes-based funding model includes outcomes chosen to represent the broad activities across various types of institutions from four-year research intensive universities to community colleges addressing workforce needs. Starting in 2016-2017, institutions must score 51 points and not be in the bottom three to be eligible for new funding. For fiscal years 2014-2015 and 2015-2016, universities were required to score 26 points or more and not be in the bottom three to be eligible for new funds. The Florida model has four guiding principles: 1. Use metrics that align with
SUS Strategic Plan goals 2. Reward excellence or improvement 3. Have a few clear, simple metrics 4. Acknowledge the unique mission of the different institutions. Source: http://www.doksinet Metrics The Tennessee outcomes-based funding model rewards institutions for achieving goals set out in the state Master Plan. The model includes outcomes chosen to represent the broad activities across various types of institutions from four-year research intensive universities to community colleges addressing workforce needs. Outcome metrics measure the universities on the following: Students Accumulating 30hrs Bachelor and Associate Degrees Students Accumulating 60hrs Masters and Ed Specialist Degrees Students Accumulating 90hrs Doctoral and Law Degrees Research and Service Expenditures Degrees per 100 FTE Six‐Year Graduation Rate Before weights are added, 40% premiums are awarded for the production of certain outcomes by Pell Grant or Adult Students. Florida’s 10-Metric Model:
1. Percent of Bachelors Graduates Employed ($25,000+) and/or Continuing their Education Further 1 year after graduation 2. Median Wages of Bachelor’s Graduates Employed Fulltime One Year After Graduation 3. Net Tuition and Fees per 120 Credit Hours 4. Six Year Graduation Rate (Full-time and Part-time FTIC) 5. Academic Progress Rate (2nd Year Retention with GPA Above 2.0) 6. Bachelors Degrees Awarded in Areas of Strategic Emphasis (includes STEM) 7. University Access Rate (Percent of Undergraduates with a Pell-grant) 8a. Graduate Degrees Awarded in Areas of Strategic Emphasis (includes STEM) (NCF Excluded) 8b. Freshman in Top 10% of Graduating High School Class (NCF Alternative Metric) 9. Board of Governors Choice 10. Board of Trustees Choice Weighting and Improvement Scores The Tennessee outcomes-based funding model has outcomes weighted according to institutional mission, reflecting an institution’s Basic Carnegie classification. Metrics that play a larger role in an
institution’s mission have a larger weight Presently the Florida 10-Metric Model is not weighted but the Board reserves the option to weight specific metrics such as the Six Year Graduation Rates and the Academic Progress Rate. Improvement points are determined after reviewing data trends for each metric. If the improvement score is Source: http://www.doksinet than others. Weights can be different for each institution. Institutional Control Tennessee institutions have a level of control in terms of focusing on the areas included in the formula. Since there are no benchmarks or targets, institutions are not penalized for not meeting a specific goal but rather are encouraged to continue productivity in areas identified by the Master Plan. higher than the excellence score, the improvement points are counted. This can result in a university scoring lowest in one metric but getting the most points for that metric because of their improvement in the metric. Florida institutions do
not have control over appropriation levels and institutions can control performance on outcomes within reason. However, the Florida 10-Metric Model does give institutions some control given that there is a metric chosen by institutional boards as part of the model. https://www.tngov/thec/bureaus/finance-and-administration/fiscal-policy/redirect-fiscalpolicy/outcomes-based-funding-formula-resources/redirect-outcomes-based-funding-formularesources/2015-20-outcomes-based-funding-formulahtml
 When reading, most of us just let a story wash over us, getting lost in the world of the book rather than paying attention to the individual elements of the plot or writing. However, in English class, our teachers ask us to look at the mechanics of the writing.