Datasheet
Year, pagecount:2012, 4 page(s)
Language:English
Downloads:2
Uploaded:April 18, 2019
Size:630 KB
Institution:
-
Comments:
Attachment:-
Download in PDF:Please log in!
Comments
No comments yet. You can be the first!


Content extract
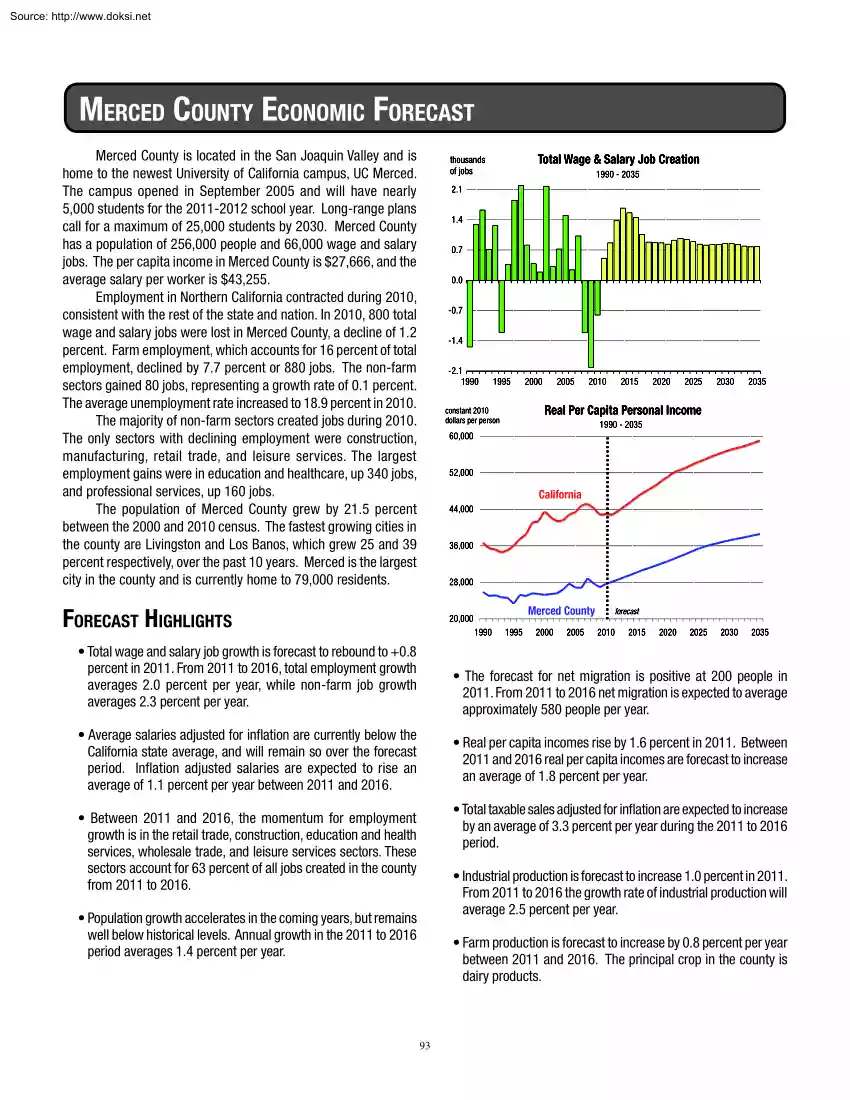
Source: http://www.doksinet Merced county econoMic Forecast Merced County is located in the San Joaquin Valley and is home to the newest University of California campus, UC Merced. The campus opened in September 2005 and will have nearly 5,000 students for the 2011-2012 school year. Long-range plans call for a maximum of 25,000 students by 2030. Merced County has a population of 256,000 people and 66,000 wage and salary jobs. The per capita income in Merced County is $27,666, and the average salary per worker is $43,255. Employment in Northern California contracted during 2010, consistent with the rest of the state and nation. In 2010, 800 total wage and salary jobs were lost in Merced County, a decline of 1.2 percent. Farm employment, which accounts for 16 percent of total employment, declined by 7.7 percent or 880 jobs The non-farm sectors gained 80 jobs, representing a growth rate of 0.1 percent The average unemployment rate increased to 18.9 percent in 2010 The majority of
non-farm sectors created jobs during 2010. The only sectors with declining employment were construction, manufacturing, retail trade, and leisure services. The largest employment gains were in education and healthcare, up 340 jobs, and professional services, up 160 jobs. The population of Merced County grew by 21.5 percent between the 2000 and 2010 census. The fastest growing cities in the county are Livingston and Los Banos, which grew 25 and 39 percent respectively, over the past 10 years. Merced is the largest city in the county and is currently home to 79,000 residents. Total Wage & Salary Job Creation thousands of jobs 1990 - 2035 2.1 1.4 0.7 0.0 -0.7 -1.4 -2.1 1990 1995 2000 2005 2010 2015 2020 2025 2030 2035 Real Per Capita Personal Income constant 2010 dollars per person 1990 - 2035 60,000 52,000 California 44,000 36,000 28,000 Forecast HigHligHts Merced County 20,000 1990 • Total wage and salary job growth is forecast to rebound to +0.8 percent
in 2011. From 2011 to 2016, total employment growth averages 2.0 percent per year, while non-farm job growth averages 2.3 percent per year 1995 2000 2005 forecast 2010 2015 2020 2025 2030 2035 • The forecast for net migration is positive at 200 people in 2011. From 2011 to 2016 net migration is expected to average approximately 580 people per year. • Average salaries adjusted for inflation are currently below the California state average, and will remain so over the forecast period. Inflation adjusted salaries are expected to rise an average of 1.1 percent per year between 2011 and 2016 • Real per capita incomes rise by 1.6 percent in 2011 Between 2011 and 2016 real per capita incomes are forecast to increase an average of 1.8 percent per year • Total taxable sales adjusted for inflation are expected to increase by an average of 3.3 percent per year during the 2011 to 2016 period. • Between 2011 and 2016, the momentum for employment growth is in the retail
trade, construction, education and health services, wholesale trade, and leisure services sectors. These sectors account for 63 percent of all jobs created in the county from 2011 to 2016. • Industrial production is forecast to increase 1.0 percent in 2011 From 2011 to 2016 the growth rate of industrial production will average 2.5 percent per year • Population growth accelerates in the coming years, but remains well below historical levels. Annual growth in the 2011 to 2016 period averages 1.4 percent per year • Farm production is forecast to increase by 0.8 percent per year between 2011 and 2016. The principal crop in the county is dairy products. 93 Source: http://www.doksinet Merced County Economic Forecast 2006-2010 History, 2011-2040 Forecast Net Registered New Homes Total Taxable Personal Real Per Inflation Rate Real Farm Real Industrial UnemployPopulation Migration Vehicles Households Permitted Sales Income Capita Income (% change Crop Value Production ment Rate
(people) (people) (thousands) (thousands) (homes) (billions) (billions) (dollars) in CPI) (billions) (billions) (percent) ----------------------------------------------------------------------------------------------------------------------------------------------------------------------------------------------------------------------2006 246,154 539 204 74.9 2,147 $2.62 $6.1 $26,795 3.2 2.49 1.92 9.5 2007 249,753 232 203 78.0 725 $2.52 $6.9 $28,880 3.4 3.16 1.90 10.0 2008 252,048 -749 202 79.1 473 $2.39 $6.8 $27,739 3.0 3.06 2.14 12.5 2009 254,039 -871 202 79.5 87 $2.05 $6.8 $26,925 0.8 2.49 2.22 17.0 2010 256,046 -822 203 79.5 167 $2.15 $7.1 $27,666 1.3 2.53 2.21 18.9 2011 259,237 219 205 80.6 342 $2.35 $7.5 $28,105 3.3 2.61 2.19 17.5 2012 262,638 346 207 81.2 400 $2.50 $7.9 $28,628 2.3 2.64 2.20 16.1 2013 266,368 588 210 81.7 983 $2.64 $8.4 $29,146 2.3 2.67 2.26 14.2 2014 270,353
766 212 82.5 1,479 $2.78 $8.9 $29,637 2.4 2.69 2.32 12.1 2015 274,420 791 215 83.6 1,757 $2.93 $9.4 $30,170 2.1 2.68 2.38 10.4 2016 278,544 797 218 85.1 1,973 $3.08 $9.9 $30,704 2.1 2.71 2.48 9.1 2017 282,609 695 221 86.8 2,011 $3.21 $10.4 $31,129 2.1 2.74 2.58 8.4 7.8 2018 286,709 690 224 88.6 2,071 $3.35 $10.9 $31,625 2.0 2.76 2.67 2019 290,888 744 227 90.6 2,185 $3.50 $11.4 $32,137 1.9 2.80 2.75 7.2 2020 295,119 775 230 92.6 2,214 $3.66 $12.0 $32,606 1.7 2.78 2.84 6.8 2021 299,356 753 233 94.7 2,188 $3.81 $12.6 $33,139 1.7 2.76 2.93 6.7 2022 303,670 802 236 96.8 2,234 $3.98 $13.2 $33,691 2.2 2.80 3.03 6.7 2023 308,059 841 238 99.0 2,294 $4.15 $13.9 $34,229 2.2 2.83 3.13 6.6 2024 312,497 857 241 101.2 2,252 $4.34 $14.7 $34,822 2.1 2.87 3.23 6.5 2025 316,982 866 245 103.4 2,127 $4.54 $15.4 $35,375 2.1 2.90 3.34 6.5 2026 321,496 872
248 105.5 2,005 $4.74 $16.2 $35,789 2.1 2.92 3.46 6.4 2027 326,044 884 251 107.5 1,900 $4.95 $16.9 $36,188 2.1 2.92 3.58 6.4 2028 330,641 908 255 109.5 1,840 $5.17 $17.7 $36,547 2.1 2.95 3.71 6.4 2029 335,291 928 258 111.3 1,770 $5.41 $18.5 $36,881 2.1 2.96 3.84 6.3 2030 339,996 954 262 113.1 1,819 $5.64 $19.3 $37,187 2.1 2.94 3.98 6.3 2031 344,748 975 266 114.9 1,821 $5.89 $20.2 $37,476 2.2 2.92 4.12 6.2 2032 349,543 992 270 116.7 1,836 $6.15 $21.0 $37,721 2.2 2.97 4.26 6.2 2033 354,372 999 275 118.5 1,737 $6.41 $22.0 $38,003 2.1 3.01 4.40 6.1 2034 359,242 1,013 279 120.2 1,678 $6.69 $22.9 $38,282 2.2 3.04 4.54 6.1 2035 364,156 1,034 283 121.9 1,626 $6.99 $23.9 $38,581 2.2 3.05 4.69 6.1 2036 369,110 1,054 288 123.5 1,562 $7.29 $25.0 $38,878 2.1 3.10 4.84 6.0 2037 374,114 1,082 292 125.1 1,608 $7.61 $26.0 $39,186 2.2 3.13 5.00 6.0
2038 379,160 1,104 297 126.6 1,571 $7.95 $27.2 $39,514 2.1 3.09 5.16 5.9 2039 384,251 1,128 301 128.2 1,614 $8.29 $28.4 $39,854 2.1 3.12 5.33 5.9 2040 389,383 1,148 306 129.7 1,576 $8.66 $29.6 $40,198 2.1 3.15 5.51 5.9 Population Growth percent change 5 New Residential Units units permitted 1990 - 2035 1990 - 2035 4,000 4 3,200 3 2,400 2 1,600 1 800 0 -1 1990 1995 2000 2005 2010 2015 2020 2025 2030 0 1990 2035 94 1995 2000 2005 2010 2015 2020 2025 2030 2035 Source: http://www.doksinet Merced County Employment Forecast 2006-2010 History, 2011-2040 Forecast Total Wage Manufac- Transportation Wholesale & Financial Professional Health & & Salary Farm Construction turing & Utilities Retail Trade Activities Services Information Education Leisure Government -------------------------------------------------------------------------------employment (thousands of
jobs)--------------------------------------------------------------------------------------2006 69.0 10.9 3.6 9.7 2.1 9.3 2.0 3.8 1.4 5.3 4.8 14.7 2007 70.1 11.1 3.2 9.3 2.3 9.7 1.9 4.0 1.4 5.6 5.0 15.2 2008 68.9 11.0 2.4 9.3 2.3 9.4 1.8 3.8 1.3 5.6 5.0 15.5 2009 66.8 11.4 1.6 8.6 2.2 9.4 1.6 3.5 1.2 5.6 4.7 15.8 2010 66.0 10.5 1.6 8.2 2.3 9.2 1.6 3.6 1.2 5.9 4.6 15.9 2011 66.5 10.5 1.6 7.9 2.4 9.6 1.6 3.7 1.2 6.1 4.7 15.8 2012 67.4 10.5 1.7 7.8 2.4 10.0 1.7 3.8 1.3 6.2 4.8 15.8 2013 68.8 10.6 2.0 7.9 2.5 10.4 1.7 3.9 1.4 6.3 4.9 15.8 2014 70.5 10.6 2.3 8.0 2.6 10.9 1.8 4.0 1.5 6.4 5.0 15.8 2015 72.0 10.6 2.6 8.2 2.8 11.3 1.8 4.1 1.6 6.5 5.2 15.9 2016 73.5 10.6 2.9 8.3 2.9 11.7 1.9 4.1 1.7 6.6 5.3 16.0 2017 74.5 10.6 3.0 8.4 2.9 11.9 1.9 4.2 1.8 6.8 5.3 16.1 2018 75.4 10.6 3.1 8.4 3.0 12.0 1.9 4.2 1.9 6.9 5.4 16.2 2019
76.3 10.6 3.2 8.4 3.1 12.2 1.9 4.2 1.9 7.1 5.5 16.3 2020 77.2 10.7 3.3 8.4 3.3 12.4 2.0 4.3 1.9 7.3 5.6 16.4 2021 78.0 10.7 3.3 8.4 3.4 12.5 2.0 4.3 2.0 7.5 5.6 16.6 2022 78.9 10.7 3.3 8.4 3.5 12.7 2.0 4.3 2.0 7.7 5.7 16.7 2023 79.9 10.7 3.3 8.5 3.6 13.0 2.0 4.4 2.1 7.9 5.7 16.9 2024 80.9 10.7 3.3 8.5 3.7 13.2 2.0 4.4 2.1 8.2 5.8 17.0 2025 81.7 10.7 3.3 8.5 3.9 13.4 2.1 4.4 2.1 8.4 5.8 17.2 2026 82.6 10.7 3.3 8.6 4.0 13.6 2.1 4.5 2.2 8.6 5.8 17.3 2027 83.4 10.8 3.2 8.6 4.0 13.8 2.1 4.5 2.2 8.7 5.9 17.5 2028 84.2 10.8 3.2 8.7 4.1 14.0 2.1 4.6 2.3 8.9 5.9 17.6 2029 85.1 10.8 3.2 8.7 4.2 14.2 2.2 4.6 2.3 9.1 6.0 17.7 2030 85.9 10.8 3.2 8.8 4.3 14.4 2.2 4.6 2.3 9.3 6.0 17.9 2031 86.7 10.8 3.2 8.8 4.4 14.6 2.2 4.7 2.4 9.4 6.1 18.0 2032 87.6 10.8 3.2 8.8 4.5 14.8 2.3 4.7 2.4 9.6 6.1 18.1 2033 88.4 10.8 3.2 8.8
4.5 15.0 2.3 4.7 2.5 9.7 6.2 18.3 2034 89.1 10.8 3.2 8.9 4.6 15.2 2.3 4.8 2.5 9.9 6.2 18.4 2035 89.9 10.9 3.1 8.9 4.7 15.4 2.3 4.8 2.6 10.0 6.3 18.5 2036 90.7 10.9 3.1 8.9 4.8 15.6 2.4 4.8 2.6 10.2 6.3 18.7 2037 91.5 10.9 3.1 8.9 4.9 15.9 2.4 4.9 2.7 10.3 6.4 18.8 2038 92.4 10.9 3.1 8.9 5.0 16.1 2.4 4.9 2.7 10.5 6.4 18.9 2039 93.2 10.9 3.1 8.9 5.1 16.3 2.5 4.9 2.7 10.6 6.5 19.1 2040 94.1 10.9 3.1 8.9 5.2 16.5 2.5 4.9 2.8 10.8 6.5 19.2 Manufacturing Employment thousands of jobs Employment in Professional Services thousands of jobs 5.0 1990 - 2035 1990 - 2035 12 4.5 11 4.0 10 3.5 9 3.0 8 7 1990 1995 2000 2005 2010 2015 2020 2025 2030 2.5 1990 2035 95 1995 2000 2005 2010 2015 2020 2025 2030 2035 Source: http://www.doksinet thousands of constant 2010 dollars per worker Real Retail Sales Growth percent change 12 1990 - 2035 Real Earnings Per Worker 1990
- 2035 80 8 70 4 California 60 0 -4 50 -8 Merced County 40 -12 -16 1990 forecast 30 1995 2000 2005 inmigrants minus outmigrants 2010 2015 2020 2025 2030 2035 1990 Net Migration 1995 2005 2010 2015 2020 2025 2030 2035 2030 2035 Industrial and Farm Production Indices inflation adjusted index (1990=100) 1990 - 2035 2000 1990 - 2035 575 4,800 3,600 475 2,400 375 1,200 0 Industrial 275 -1,200 175 -2,400 -3,600 1990 Farm 75 1995 2000 2005 2010 2015 2020 2025 2030 2035 1990 1995 2000 2005 forecast 2010 2015 2020 2025 County Economic and Demographic Indicators Projected Economic Growth (2011-2016) Expected retail sales growth: Expected job growth: Fastest growing jobs sector: Expected personal income growth: 17.4 % 10.4 % Construction 17.4 % Expected population growth: Net migration to account for: Expected growth in number of vehicles: 7.4 % 17.0 % 6.3 % Demographics (2011) Unemployment rate (June 2011): County Rank* in
California (58 counties): Working age (16-64) population: 18.7 % 54th 61.7 % Population with B.A Degree or higher: Median Home Selling Price: Median Household Income: 12.1 % $116,000 $42,452 Quality of Life Violent Crime rate (2009): 647 per 100,000 persons County Rank* in California (58 counties): 55th Average Commute Time to work (2011): 26.8 minutes High School drop out rate (2009): Households at/below poverty line: 18.5 % 18.6 % * The county ranked 1st corresponds to the lowest rate in California 96
 Just like you draw up a plan when you’re going to war, building a house, or even going on vacation, you need to draw up a plan for your business. This tutorial will help you to clearly see where you are and make it possible to understand where you’re going.