Datasheet
Year, pagecount:2018, 5 page(s)
Language:English
Downloads:2
Uploaded:April 29, 2019
Size:613 KB
Institution:
-
Comments:
Cornell Engineering Career Center
Attachment:-
Download in PDF:Please log in!
Comments
No comments yet. You can be the first!


Content extract
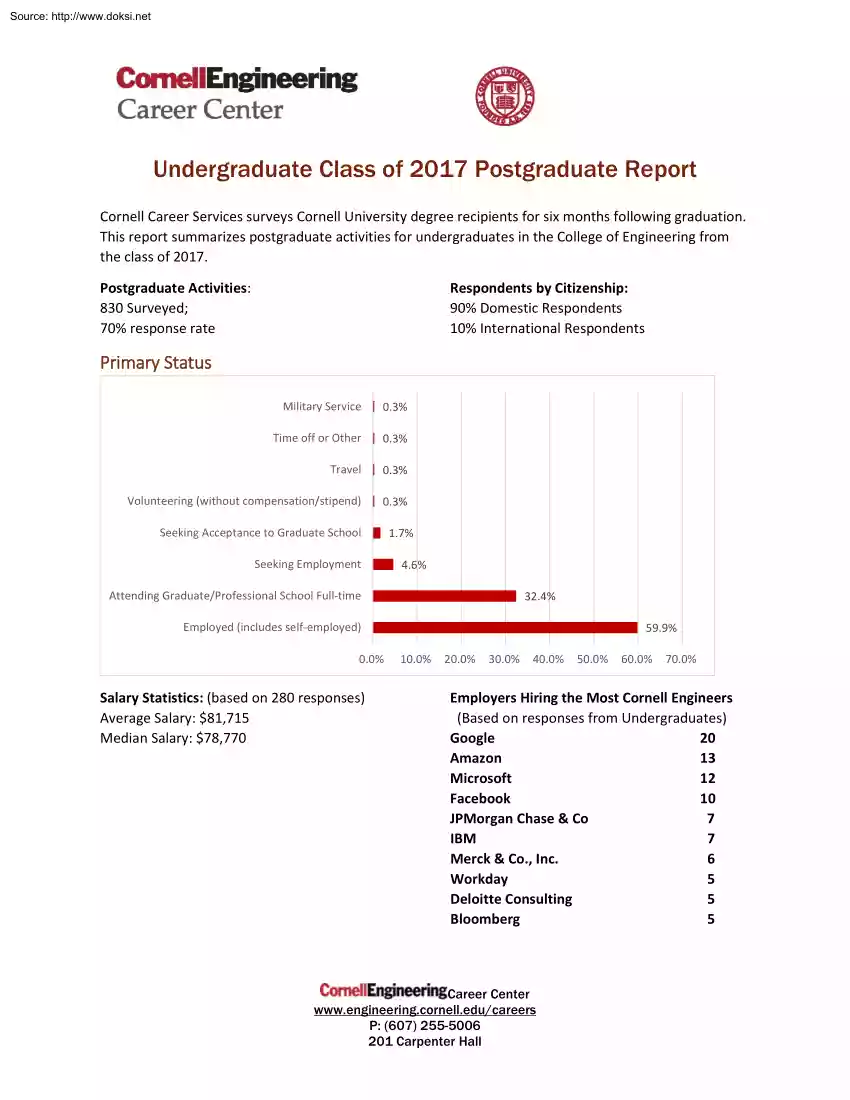
Source: http://www.doksinet Undergraduate Class of 2017 Postgraduate Report Cornell Career Services surveys Cornell University degree recipients for six months following graduation. This report summarizes postgraduate activities for undergraduates in the College of Engineering from the class of 2017. Postgraduate Activities: 830 Surveyed; 70% response rate Respondents by Citizenship: 90% Domestic Respondents 10% International Respondents Primary Status Military Service 0.3% Time off or Other 0.3% Travel 0.3% Volunteering (without compensation/stipend) 0.3% Seeking Acceptance to Graduate School Seeking Employment 1.7% 4.6% Attending Graduate/Professional School Full-time 32.4% Employed (includes self-employed) 0.0% Salary Statistics: (based on 280 responses) Average Salary: $81,715 Median Salary: $78,770 59.9% 10.0% 20.0% 30.0% 40.0% 50.0% 60.0% 70.0% Employers Hiring the Most Cornell Engineers (Based on responses from Undergraduates) Google 20 Amazon 13
Microsoft 12 Facebook 10 JPMorgan Chase & Co 7 IBM 7 Merck & Co., Inc 6 Workday 5 Deloitte Consulting 5 Bloomberg 5 Career Center www.engineeringcornelledu/careers P: (607) 255-5006 201 Carpenter Hall Source: http://www.doksinet Job Sectors Architecture/Design/Construction Biotechnology/Pharmaceuticals 4% 6% Education 3% Other 10% Retail 6% Financial Services 9% Technology 37% Consulting/Professional Practice 11% Manufacturing 14% Job Locations Metropolitan New York City San Francisco Bay Area Metropolitan Boston Metropolitan Baltimore/Washington, DC Metropolitan Philadelphia Metropolitan Chicago Metropolitan Los Angeles Other NOT REPORTED Percent of responses 24.7% 16.1% 7.5% 5.7% Degrees Sought M.Eng Ph.D M.S M.D Percent of responses 56.9% 23.4% 11.7% 1.6% 3.7% 2.0% 2.0% 34.2% 4.0% Masters - Other All other. 4.3% 2.1% Career Center www.engineeringcornelledu/careers P: (607) 255-5006 201 Carpenter Hall Source: http://www.doksinet Cornell Career Services -
Postgraduate Survey Reports Major Subdivided by: Primary Status College of Engineering 2017-2017; BS Total # Students 583 Applied & Engineering Physics 11 2% Attending Graduate/Professional School Full-time 5 45% Employed (includes self-employed) 5 45% Min $62,000 Max $100,000 Mean $81,100 Median $71,000 Seeking Employment 1 9% Biological Engineering 54 9% Attending Graduate/Professional School Full-time 20 37% Employed (includes self-employed) 25 46% Min $24,000 Max $105,000 Mean $55,476 Median $51,555 Seeking Acceptance to Graduate School 4 7% Seeking Employment 3 6% Travel 1 2% Volunteering (without compensation/stipend) 1 2% Chemical & Biomolecular Engineering 74 13% Attending Graduate/Professional School Full-time 14 19% Employed (includes self-employed) 50 68% Min $40,000 Max $101,500 Mean $70,359 Military Service Min $36,000 Max $36,000 Mean $36,000 Median $71,500 1 1% Median $36,000 Seeking Employment 8 11%
Travel 1 1% Civil Engineering 31 5% Attending Graduate/Professional School Full-time 9 29% Employed (includes self-employed) 17 55% Created on 04/11/2018 09:07:26 1 / 3 Source: http://www.doksinet Min $48,000 Max $126,000 Mean $65,447 Median $63,045 Seeking Acceptance to Graduate School 2 6% Seeking Employment 2 6% Volunteering (without compensation/stipend) 1 3% Computer Science 158 27% Attending Graduate/Professional School Full-time 38 24% Employed (includes self-employed) 116 73% Min $60,000 Max $160,000 Mean $104,884 Median $107,000 Seeking Acceptance to Graduate School 3 2% Seeking Employment 1 1% Electrical & Computer Engineering 40 7% Attending Graduate/Professional School Full-time 21 53% Employed (includes self-employed) 17 43% Min $59,500 Max $120,000 Mean $90,253 Median $82,500 Seeking Employment 2 5% Environmental Engineering 13 2% Attending Graduate/Professional School Full-time 9 69% Employed
(includes self-employed) 4 31% Min $60,000 Max $67,000 Mean $63,500 Median $30,000 Independent Major 6 1% Attending Graduate/Professional School Full-time 2 33% Employed (includes self-employed) 3 50% Min $40,000 Max $65,000 Mean $48,867 Median $40,000 Seeking Employment 1 17% Information Science, Systems & Technology 13 2% Attending Graduate/Professional School Full-time 1 8% Employed (includes self-employed) 12 92% Min $70,000 Max $110,000 Mean $90,182 Materials Science & Engineering Median $82,000 18 3% Created on 04/11/2018 09:07:26 2 / 3 Source: http://www.doksinet Attending Graduate/Professional School Full-time 8 44% Employed (includes self-employed) 7 39% Min $37,000 Max $103,000 Mean $67,286 Median $65,000 Seeking Employment 2 11% Time off or Other 1 6% Mechanical & Aerospace Engineering 82 14% Attending Graduate/Professional School Full-time 43 52% Employed (includes self-employed) 31 38% Min
$60,000 Max $110,000 Mean $75,201 Military Service Min $37,152 Max $37,152 Mean $37,152 Median $68,500 1 1% Median $37,152 Seeking Acceptance to Graduate School 1 1% Seeking Employment 5 6% Time off or Other 1 1% Operations Research & Information Engineering 80 14% Attending Graduate/Professional School Full-time 17 21% Employed (includes self-employed) 62 78% Min $24,960 Max $110,000 Mean $72,618 Median $72,250 Seeking Employment 1 1% Science of Earth Systems 3 1% Attending Graduate/Professional School Full-time 2 67% Seeking Employment 1 33% Created on 04/11/2018 09:07:26 3 / 3
 Just like you draw up a plan when you’re going to war, building a house, or even going on vacation, you need to draw up a plan for your business. This tutorial will help you to clearly see where you are and make it possible to understand where you’re going.