Datasheet
Year, pagecount:2013, 12 page(s)
Language:English
Downloads:4
Uploaded:December 05, 2019
Size:10 MB
Institution:
-
Comments:
Attachment:-
Download in PDF:Please log in!
Comments
No comments yet. You can be the first!What did others read after this?


Content extract
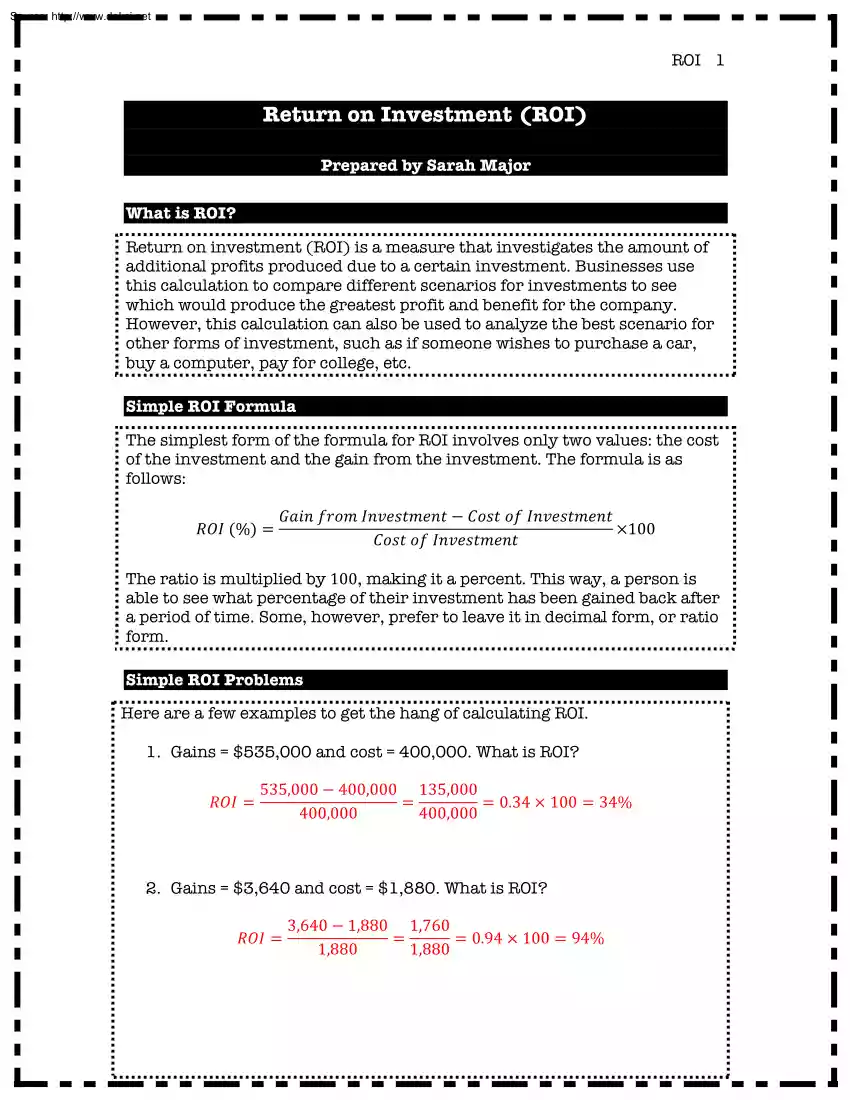
Source: http://www.doksinet ROI 1 Return on Investment (ROI) Prepared by Sarah Major What is ROI? Return on investment (ROI) is a measure that investigates the amount of additional profits produced due to a certain investment. Businesses use this calculation to compare different scenarios for investments to see which would produce the greatest profit and benefit for the company. However, this calculation can also be used to analyze the best scenario for other forms of investment, such as if someone wishes to purchase a car, buy a computer, pay for college, etc. Simple ROI Formula The simplest form of the formula for ROI involves only two values: the cost of the investment and the gain from the investment. The formula is as follows: ��� (%) = ���� ���� ���������� − ���� �� ���������� ×100 ���� �� ���������� The ratio is multiplied by 100, making it a percent.
This way, a person is able to see what percentage of their investment has been gained back after a period of time. Some, however, prefer to leave it in decimal form, or ratio form. Simple ROI Problems Here are a few examples to get the hang of calculating ROI. 1. Gains = $535,000 and cost = 400,000 What is ROI? ��� = 535,000 − 400,000 135,000 = = 0.34 × 100 = 34% 400,000 400,000 2. Gains = $3,640 and cost = $1,880 What is ROI? ��� = 3,640 − 1,880 1,760 = = 0.94 × 100 = 94% 1,880 1,880 Source: http://www.doksinet ROI 2 3. You buy a car for $26,450 Because you now have reliable transportation, you are able to obtain a job and earn $10,860 in your first year. Calculate your return on investment for that year ��� = 10,860 − 26,450 −15,590 = = −0.59 × 100 = 59% 26,450 26,450 4. A business purchases a new form of information system technology for $500,000. Because of this purchase, the company begins earning $50,000 a year. Find the ROI for
the first year ��� = 50,000 − 500,000 −450,000 = = −0.9 × 100 = −90% 500,000 500,000 What does a negative ROI mean? Let’s take a step back and think about a different question: what would it mean if we had a zero ROI? This only occurs when the numerator of our formula is zero, and this can only happen if our gains were the same as our costs, meaning we broke even. Therefore, if ROI is negative, the costs must be greater than the gains, or we have yet to achieve an amount of gain great enough to cover the cost of the investment. Once ROI is positive, that means we have earned more than the cost we put into the investment. When it’s positive, we have actually returned a profit! Simple ROI Over Time Investors calculate ROI over time to see how the value changes or when a positive ROI will occur. This gives them a better timeframe of how long it will take them to get an adequate return on their purchase. 5. Take the business investment in Problem 4 and calculate
their ROI for the first four years. ���! = 50,000 − 500,000 −450,000 = = −0.9 × 100 = 90% 500,000 500,000 ���! = 100,000 − 500,000 −400,000 = = −0.8 × 100 = −80% 500,000 500,000 ���! = 150,000 − 500,000 −350,000 = = −0.7 × 100 = −70% 500,000 500,000 ���! = 200,000 − 500,000 −300,000 = = −0.6 × 100 = −60% 500,000 500,000 Source: http://www.doksinet ROI 3 6. Take Problem 3 Calculate the ROI for each consecutive year until you obtain a positive return on their investment. ���! = 10,860 − 26,450 −15,590 = = −0.59 × 100 = −59% 26,450 26,450 ���! = 21,720 − 26,450 −4,730 = = −0.18 × 100 = −18% 26,450 26,450 32,580 − 26,450 6,130 = = 0.23 × 100 = 23% 26,450 26,450 ���! = Analyzing Different Scenarios To find the best investment, investors must analyze ROI calculations for different scenarios to see which produces the higher number, or higher return.
This is so they know which purchase to make before they actually invest in a product. There are two different ways of predicting which investment in a series of scenarios will give the best return. The first method is to see which will give a positive return in the shortest amount of time. 7. You crashed the car you bought in Problem 3, so you need to purchase a new one. You’ve narrowed your choice down to two cars Car A is $19,345, and since gas would cost you about the same as for your old car, you would still be pocketing about $10,860 a year. Car B is $27,120 but is extremely good on gas mileage, so after paying for gas, you would be pocketing about $13,430 a year. Which car should you buy based on which one will give you a positive ROI faster? ���!! = 10,860 − 19,346 −8,486 = = −0.44 × 100 = −44% 19,346 19,346 ���!! = ���!! = 21,720 − 19,346 2,374 = = 0.12 × 100 = 12% 19,346 19,346 13,430 − 27,120 −13,690 = = −0.50 × 100 =
−50% 27,120 27,120 ���!! = 26,860 − 27,120 −260 = = −0.01 × 100 = −1% 27,120 27,120 ���!! = 40,290 − 27,120 13,170 = = 0.49 × 100 = 49% 27,120 27,120 Car A will give you a positive ROI faster and is thus is the best investment. Source: http://www.doksinet ROI 4 The second method of predicting which scenario will give you the best return is by seeing which investment will give you the highest ROI after a predetermined amount of time. 8. Take the car decision you are trying to make in Problem 7 Which will be the best buy if you look at the ROI after three years? ���!! = 10,860 − 19,346 −8,486 = = −0.44 × 100 = −44% 19,346 19,346 ���!! = 21,720 − 19,346 2,374 = = 0.12 × 100 = 12% 19,346 19,346 ���!! = ���!! = 32,580 − 19,346 = 0.68 × 100 = 68% 19,346 13,430 − 27,120 −13,690 = = −0.50 × 100 = −50% 27,120 27,120 ���!! = 26,860 − 27,120 −260 = = −0.01 × 100 =
−1% 27,120 27,120 ���!! = 40,290 − 27,120 13,170 = = 0.49 × 100 = 49% 27,120 27,120 Car A will give you the highest ROI after three years and thus is the best investment. What would it look like if we graphed ROI over time as points on a coordinate plane? In the space below, graph the two scenarios on a coordinate plane. Let the x-axis be time and the y-axis by ROI Connect the points for each scenario to see what type of growth is produced. 80 70 60 50 40 30 20 10 0.5 – 10 – 20 – 30 – 40 – 50 – 60 – 70 1 1.5 2 2.5 3 3.5 4 Source: http://www.doksinet ROI 5 As the graphs of the points show, the growth of ROI in these scenarios is linear. What if we wanted to find the ROI after ten years? We can approximate the equation of the line so that we don’t have to keep calculating the different ROI calculations over time. With the equation, we can simply plug in the unit of time, and the output will produce the ROI at that point in time. So, first,
approximate the equation of the line using the points you calculated from the best of the two scenarios. Then, find the ROI after ten years. �! − �! 68 + 44 112 = = = 56 3−1 2 �! − �! � = �� + � ⇒ 68 = 56 3 + � ⇒ � = −100 � = 56� − 100 ⇒ � = 56 10 − 100 ⇒ � = 460% ����� = � = Factors Affecting Cost and Gains from Investment It is easy to calculate ROI when the cost and gains are constant but this is rarely the actual case. Different factors may affect the cost and gains over time. For instance what if a loan had to be taken out to pay for the investment? The investor would have to pay interest on the amount owed. However as the money is paid back the amount of interest would decrease over time because it is calculated by how much money is owed. Another factor may include growth of revenue over time. If a business grows over time their revenue will increase causing their gains to increase over time. This may affect the way
the growth of ROI looks over time. Source: http://www.doksinet ROI 6 9. Take the same car decision from Problems 7 and 8 Use the scenario from Car A except you receive a 20% raise each year from your job. Calculate the ROI over the first five years and then graph the results on a coordinate plane. ���!! = ���!! = ���!! = 10,860 − 19,346 −8,486 = = −0.44 × 100 = −44% 19,346 19,346 10,860 + 10,860 + 10,860 . 2 − 19,346 19,346 4,546 10,860 + 13,032 − 19,346 = = = 0.23 × 100 = 23% 19,346 19,346 23,892 + 13,032 + 13,032 . 2 − 19,346 19,346 23,892 + 15,638.4 − 19,346 20,1844 = = = 1.04 × 100 = 104% 19,346 19,346 ���!! = ���!! = 39,530.4 + 15,6384 + 15,6384 2 − 19,346 19,346 39,530.4 + 18,76608 − 19,346 38,95048 = = = 2.01 × 100 19,346 19,346 = 201% 58,296.48 + 18,76608 + 18,76608 2 − 19,346 19,346 58,296.48 + 22,520,02 − 19,346 61,4705 = = = 3.18 × 100 19,346 19,346 = 318% 600 500 400 300 200
100 –1 1 – 100 2 3 4 5 Source: http://www.doksinet ROI 7 As you can see, the points look to produce exponential growth. Let’s try another example with other factors involved. 10. Use the information from Problem 4 What if instead of just earning $50,000 a year, the company earned $50,000 more dollars each year than the year before? Calculate the ROI for the first five years of business. Then, graph the points ���! = 50,000 − 500,000 −450,000 = = −0.9 × 100 = −90% 500,000 500,000 ���! = 150,000 − 500,000 −350,000 = = −0.7 × 100 = −70% 500,000 500,000 300,000 − 500,000 −200,000 = = −0.4 × 100 = −40% 500,000 500,000 500,000 − 500,000 0 ���! = = = 0 × 100 = 0% 500,000 500,000 ���! = ���! = 750,000 − 500,000 250,000 = = 0.5 × 100 = 50% 500,000 500,000 100 80 60 40 20 1 – 20 – 40 – 60 – 80 – 100 – 120 2 3 4 5 Source: http://www.doksinet ROI 8
Once again, we can see that the graph of the points looks like an exponential function. Typically, this is the type of growth we see when dealing with ROI since it is usually used in business calculations. Over time, businesses grow as they become more productive, successful, and popular. Is it possible to approximate an equation for a function that goes through the points just like we did with the linear functions so we don’t have to make so many calculations to get the value we want? The answer is yes, but we must review what we know about exponential functions to be able to find this process. First of all, we know that these functions appear in the form of � = �� ! , where � is a fixed constant that is where the function crosses the y-axis and � is the base. Having a positive exponent will produce exponential growth, and having a negative exponent will produce exponential decay (exponential decrease). We also know that the base for the exponential component has to be
positive, but we are also dealing with negative values. However, we know that a vertical shift results if we add or subtract a value from our function. We can use this information to approximate a function for the previous problem. First of all, we need to find the constant so that we can form an equation. This can be done by finding where the function will cross the x-axis. This point occurs where � = 0 on the graph. Because � is a function of time in this example, and we know that when � = 0, no amount of time has passed, and therefore, no gains have been made yet. Accordingly, our ROI calculation is: ��� = 0 − 19,346 −19,346 = = −1 ×100 = −100% 19,346 19,346 So, the point in question is (0, −100). But wait, remember about the negative values? Let’s shift all of the points up 200 so that we don’t have to deal with those nasty negatives. Therefore, our graph looks like this: 250 200 150 100 50 1 2 3 4 5 Source: http://www.doksinet ROI 9 Now,
we just need to add 200 to all of our � values. This makes our initial point (0,100). We can then plug these initial values in to find the constant �. � = �� ! ⇒ 100 = ��! ⇒ � = 100 Now, we have the formula � = 100� ! . We can take the last point, (5,50), which we changed to (5,250), and plug in for the corresponding values to find the other constant, �. � = 100� ! ⇒ 250 = 100�! ⇒ 2.50 = �! ! ⇒ � = 2.50 ⇒ � ≈ 1.20 Now, we have the full equation � = 100(1.39)! But wait! Don’t forget that we shifted the points up 200. We can shift them down by subtracting back the 200, so our actual equation is: � = 100(1.20)! − 200 Let’s graph this function along with our points to see how close of an approximation it is. f(x) = 100·(1.2)x – 200 60 40 20 –2 2 – 20 – 40 – 60 – 80 – 100 – 120 4 Source: http://www.doksinet ROI 10 So, close, but not exact. It goes through the initial and last point because those are
the points we used to find the values for our function. But why couldn’t we find a better model using our method? Why didn’t our approximation of the exponential function for our data points work? Let’s look at the � values of our points: -90, -70, -40, 0, and 50. Is there a relationship between these points that might help us find a better approximation? Let’s find the differences between these values: −90 − (−100) = −90 + 100 = 10 −70 − −90 = −70 + 90 = 20 −40 − −70 = −40 + 70 = 30 0 − −40 = 0 + 40 = 40 50 − 0 = 50 There is definitely a pattern between the differences of these values. The differences increase by 10 as the points progress. However, this does not seem to be growing exponentially but rather arithmetically. Therefore, this is not considered exponential growth. When growth LOOKS exponential but is NOT actually exponential, it usually means that a power function can be used to represent the points. Power Functions Power functions
appear in the form: � � = �� ! where � is a scaling factor and � is the power that controls the growth or decay (in this case, our growth). Notice that when we plug in 0 for �, we get: � � −� 0 ! =0 Therefore, power functions always pass through the point (0,0). This means that once again, we’ll need to move all of our points up so that the initial point passes through the origin. In light of this, let’s add 100 to all of our points so that we produce the graph: Source: http://www.doksinet ROI 11 160 140 120 100 80 60 40 20 1 2 3 4 5 – 20 Now, how do we find an equation for a power function using our points? Let’s plug in one of our points and see if we can find one of these values we need. Let’s use (1,10) � � = �� ! ⇒ 10 = �(1)! ⇒ � = 10 Let’s use another point, (5,150), to find �. � � = 10� ! ⇒ 150 = 10(5)! ⇒ 15 = 5! ⇒ ln 15 = ln (5! ) ⇒ ln 15 = � ln (5) ln (15) ⇒�= ln (5) ⇒ �
≈ 1.68 Therefore, our equation is: � � = 10� !.!" Source: http://www.doksinet ROI 12 Project Come up with your own situation involving ROI. It can be something that pertains to your life (buying a care, paying for college, buying a computer, etc.), a business example, or anything that involves putting money into some kind of investment and calculating its return. Think of all the possible factors that will affect calculations for ROI. These may include salary, bonuses, loans, interest rates, costs, insurance payments, etc. Produce at least three different scenarios and calculate the first five points for each. Your unit of time doesn’t necessarily have to be years It may be more practical to use months, decades, etc. Find the best investment out of your scenarios and the parameters for it being the best. Next, find the type of function that is the best fit for your data points. Make sure you try AT LEAST linear, exponential, and power functions for your growth if not
some other types of functions to find which one best fits your data. Then, produce a graph of a this function on a piece of poster board so that the class can see how your growth looks over time. Make sure the equation for the actual function is visible somewhere on your poster. Also, somewhere on your poster, present a problem about your scenario that the class will solve, whether it be just values that you plug into your function or a word problem involving your scenarios. We will present these projects to the class
 Just like you draw up a plan when you’re going to war, building a house, or even going on vacation, you need to draw up a plan for your business. This tutorial will help you to clearly see where you are and make it possible to understand where you’re going.