Datasheet
Year, pagecount:2017, 3 page(s)
Language:English
Downloads:2
Uploaded:June 28, 2018
Size:660 KB
Institution:
-
Comments:
Attachment:-
Download in PDF:Please log in!
Comments
No comments yet. You can be the first!Most popular documents in this category


Content extract
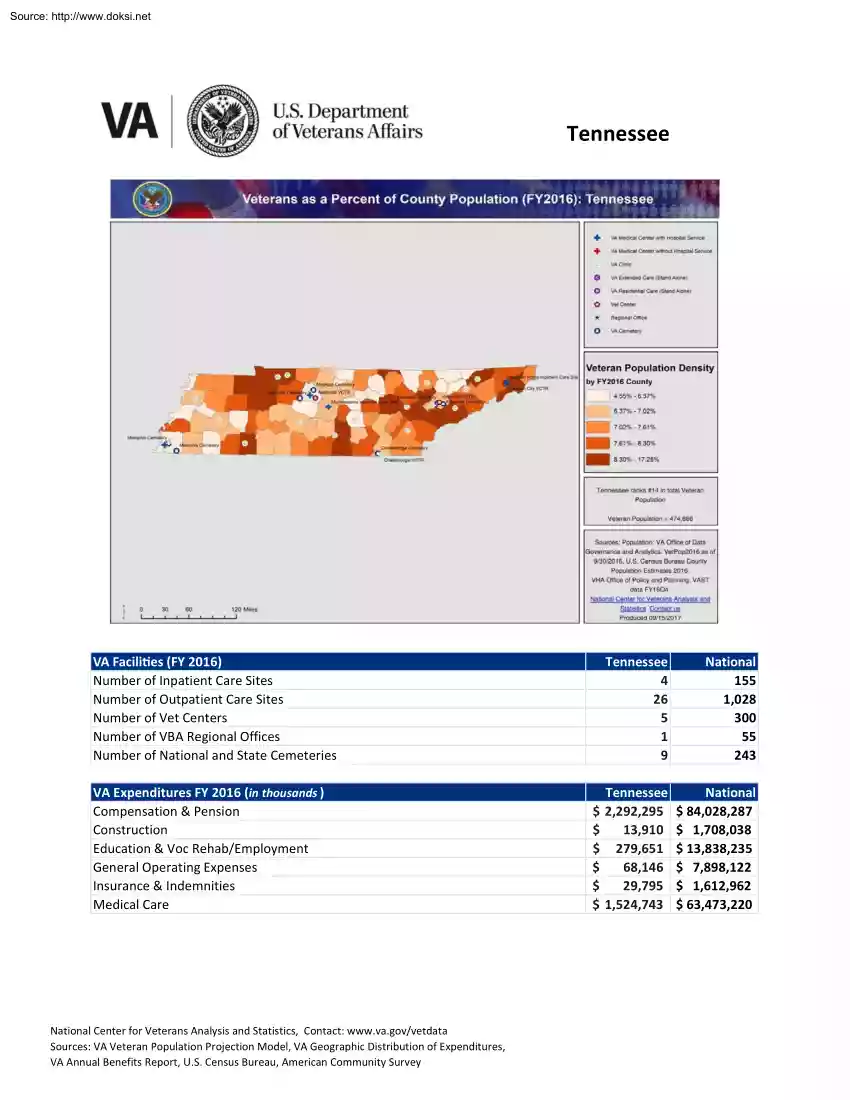
Source: http://www.doksinet Tennessee VA FaciliƟes (FY 2016) Number of Inpatient Care Sites Number of Outpatient Care Sites Number of Vet Centers Number of VBA Regional Offices Number of National and State Cemeteries VA Expenditures FY 2016 (in thousands ) Compensation & Pension Construction Education & Voc Rehab/Employment General Operating Expenses Insurance & Indemnities Medical Care National Center for Veterans Analysis and Statistics, Contact: www.vagov/vetdata Sources: VA Veteran Population Projection Model, VA Geographic Distribution of Expenditures, VA Annual Benefits Report, U.S Census Bureau, American Community Survey Tennessee 4 26 5 1 9 National 155 1,028 300 55 243 Tennessee National $ 2,292,295 $ 84,028,287 $ 13,910 $ 1,708,038 $ 279,651 $ 13,838,235 $ 68,146 $ 7,898,122 $ 29,795 $ 1,612,962 $ 1,524,743 $ 63,473,220 Source: http://www.doksinet Tennessee Veteran Population (FY 2016) Number of Veterans Percent of Adult Population that are Veterans
Number of Women Veterans Percent of Women Veterans Number of Military Retirees Percent of Veterans that are Military Retirees Number of Veterans Age 65 and Over Percent of Veterans Age 65 and Over Age Distribution Tennessee Tennessee 474,686 9.27% 43,550 9.17% 55,321 11.65% 212,587 44.78% Period of Service National Tennessee National 20,392,192 6.60% 1,860,516 9.12% 2,129,774 10.44% 9,560,748 46.88% National Peacetime Only 65 Years or Older World War II 55 to 64 Years Korean War 45 to 54 Years Vietnam Era 30 to 44 Years Gulf War I 18 to 29 Years Gulf War II 0% 20% Household Income 40% Tennessee 60% National 0% 10% Educational Attainment 20% 30% Tennessee 40% National $200k or More Enrolled in College $100k to $199.9k $50k to $99.9k $25k to 49.9k Bachelors or Higher Less than 25k 0% 10% 20% 30% 40% VA Healthcare and Benefits (FY 2016) Number of Veterans Receiving Disability Compensation Number of Veterans Receiving Pension Number of Dependency
& Indemnity Comp Beneficiaries Number of Education Beneficiaries Number of Enrollees in VA Healthcare System Number of Unique Patients Treated National Center for Veterans Analysis and Statistics, Contact: www.vagov/vetdata Sources: VA Veteran Population Projection Model, VA Geographic Distribution of Expenditures, VA Annual Benefits Report, U.S Census Bureau, American Community Survey 0% 10% 20% Tennessee 110,382 7,842 10,914 16,231 213,534 145,861 30% National 4,356,443 288,710 399,237 927,012 8,873,885 5,882,889 Source: http://www.doksinet Tennessee Population Change Veteran Population FY 2015 Veteran Population FY 2045 Annual Percentage Change Tennessee 479K 319K -1.35% National 20.8M 12M -1.8% Less than 40 40-64 65+ 9/30/2015 9/30/2020 9/30/2025 9/30/2030 9/30/2035 67,192 67,129 61,921 55,725 53,675 199,153 175,684 156,354 142,911 129,649 212,253 212,700 209,981 201,078 187,316 9/30/2040 53,739 122,844 166,201 9/30/2045 53,879 118,531 146,264 Male Female
9/30/2015 9/30/2020 9/30/2025 9/30/2030 9/30/2035 435,950 408,803 377,875 346,033 314,229 42,649 46,709 50,382 53,680 56,411 9/30/2040 284,406 58,379 9/30/2045 259,190 59,484 WWII Period of Korea Service Vietnam Gulf War 9/30/2015 9/30/2020 9/30/2025 9/30/2030 9/30/2035 15,847 5,328 1,139 151 11 34,671 20,555 9,197 2,813 559 168,926 151,896 128,671 99,572 67,165 163,652 188,351 203,593 206,778 205,043 9/30/2040 0 71 37,309 199,213 9/30/2045 0 5 16,023 187,935 Tennessee 9/30/2015 9/30/2020 9/30/2025 9/30/2030 9/30/2035 9/30/2040 9/30/2045 Tennessee Age Tennessee Gender Tennessee Race White, Not Hispanic Minority 393,347 366,351 335,249 302,236 268,262 235,219 205,713 85,252 89,161 93,008 97,477 102,378 107,565 112,962 Note: Minorities are all races/ethnicities except non-Hispanic White Veterans 250,000 Age Distribution Over Time Tennessee Less than 40 40-64 65+ 200,000 150,000 100,000 50,000 0 9/30/2015 9/30/2020 9/30/2025 9/30/2030 9/30/2035
National Center for Veterans Analysis and Statistics, Contact: www.vagov/vetdata Sources: VA Veteran Population Projection Model, VA Geographic Distribution of Expenditures, VA Annual Benefits Report, U.S Census Bureau, American Community Survey 9/30/2040 9/30/2045
 When reading, most of us just let a story wash over us, getting lost in the world of the book rather than paying attention to the individual elements of the plot or writing. However, in English class, our teachers ask us to look at the mechanics of the writing.