Datasheet
Year, pagecount:2017, 1 page(s)
Language:English
Downloads:3
Uploaded:April 08, 2019
Size:462 KB
Institution:
-
Comments:
Attachment:-
Download in PDF:Please log in!
Comments
No comments yet. You can be the first!


Content extract
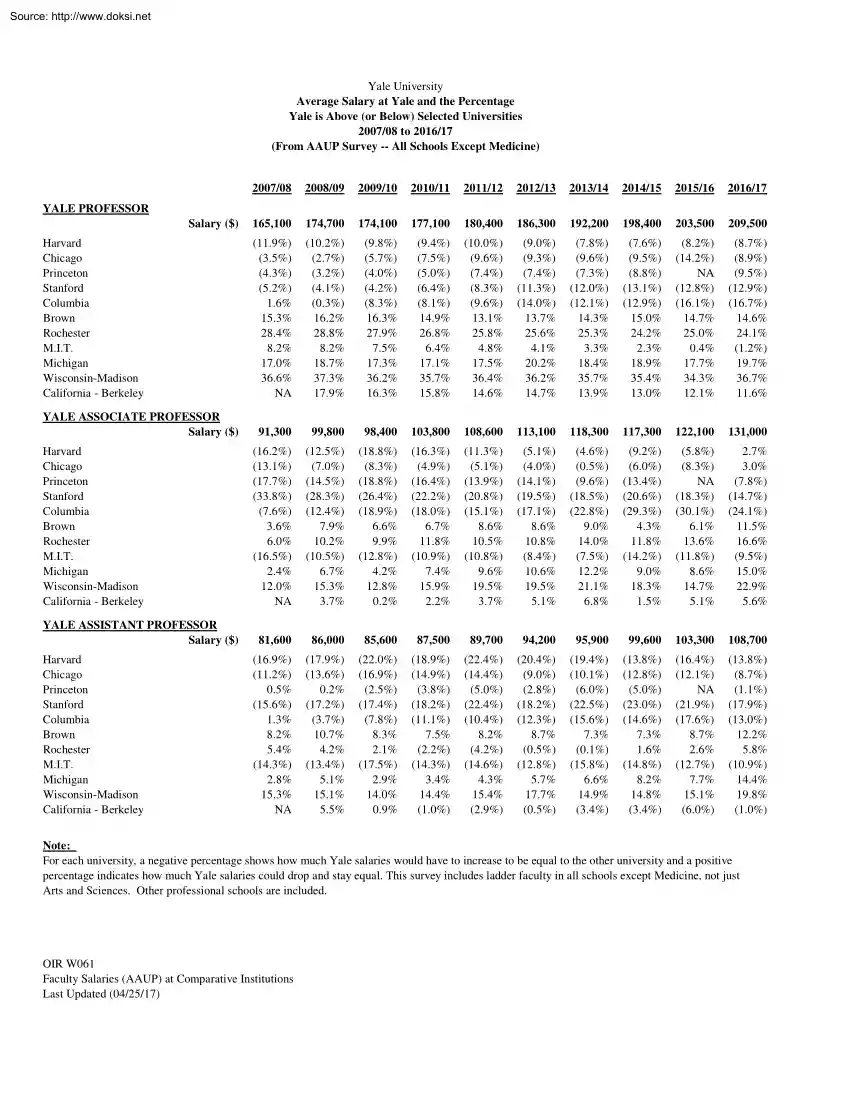
Source: http://www.doksinet Yale University Average Salary at Yale and the Percentage Yale is Above (or Below) Selected Universities 2007/08 to 2016/17 (From AAUP Survey -- All Schools Except Medicine) 2007/08 2008/09 2009/10 2010/11 2011/12 2012/13 2013/14 2014/15 2015/16 2016/17 165,100 174,700 174,100 177,100 180,400 186,300 192,200 198,400 203,500 209,500 (11.9%) (3.5%) (4.3%) (5.2%) 1.6% 15.3% 28.4% 8.2% 17.0% 36.6% NA (10.2%) (2.7%) (3.2%) (4.1%) (0.3%) 16.2% 28.8% 8.2% 18.7% 37.3% 17.9% (9.8%) (5.7%) (4.0%) (4.2%) (8.3%) 16.3% 27.9% 7.5% 17.3% 36.2% 16.3% (9.4%) (7.5%) (5.0%) (6.4%) (8.1%) 14.9% 26.8% 6.4% 17.1% 35.7% 15.8% (10.0%) (9.6%) (7.4%) (8.3%) (9.6%) 13.1% 25.8% 4.8% 17.5% 36.4% 14.6% (9.0%) (9.3%) (7.4%) (11.3%) (14.0%) 13.7% 25.6% 4.1% 20.2% 36.2% 14.7% (7.8%) (9.6%) (7.3%) (12.0%) (12.1%) 14.3% 25.3% 3.3% 18.4% 35.7% 13.9% (7.6%) (9.5%) (8.8%) (13.1%) (12.9%) 15.0% 24.2% 2.3% 18.9% 35.4% 13.0% (8.2%) (14.2%) NA (12.8%) (16.1%) 14.7%
25.0% 0.4% 17.7% 34.3% 12.1% (8.7%) (8.9%) (9.5%) (12.9%) (16.7%) 14.6% 24.1% (1.2%) 19.7% 36.7% 11.6% YALE PROFESSOR Salary ($) Harvard Chicago Princeton Stanford Columbia Brown Rochester M.IT Michigan Wisconsin-Madison California - Berkeley YALE ASSOCIATE PROFESSOR Salary ($) Harvard Chicago Princeton Stanford Columbia Brown Rochester M.IT Michigan Wisconsin-Madison California - Berkeley YALE ASSISTANT PROFESSOR Salary ($) Harvard Chicago Princeton Stanford Columbia Brown Rochester M.IT Michigan Wisconsin-Madison California - Berkeley 91,300 99,800 98,400 103,800 108,600 113,100 118,300 117,300 122,100 131,000 (16.2%) (13.1%) (17.7%) (33.8%) (7.6%) 3.6% 6.0% (16.5%) 2.4% 12.0% NA (12.5%) (7.0%) (14.5%) (28.3%) (12.4%) 7.9% 10.2% (10.5%) 6.7% 15.3% 3.7% (18.8%) (8.3%) (18.8%) (26.4%) (18.9%) 6.6% 9.9% (12.8%) 4.2% 12.8% 0.2% (16.3%) (4.9%) (16.4%) (22.2%) (18.0%) 6.7% 11.8% (10.9%) 7.4% 15.9% 2.2% (11.3%) (5.1%) (13.9%) (20.8%) (15.1%) 8.6% 10.5% (10.8%) 9.6% 19.5%
3.7% (5.1%) (4.0%) (14.1%) (19.5%) (17.1%) 8.6% 10.8% (8.4%) 10.6% 19.5% 5.1% (4.6%) (0.5%) (9.6%) (18.5%) (22.8%) 9.0% 14.0% (7.5%) 12.2% 21.1% 6.8% (9.2%) (6.0%) (13.4%) (20.6%) (29.3%) 4.3% 11.8% (14.2%) 9.0% 18.3% 1.5% (5.8%) (8.3%) NA (18.3%) (30.1%) 6.1% 13.6% (11.8%) 8.6% 14.7% 5.1% 2.7% 3.0% (7.8%) (14.7%) (24.1%) 11.5% 16.6% (9.5%) 15.0% 22.9% 5.6% 81,600 86,000 85,600 87,500 89,700 94,200 95,900 99,600 103,300 108,700 (16.9%) (11.2%) 0.5% (15.6%) 1.3% 8.2% 5.4% (14.3%) 2.8% 15.3% NA (17.9%) (13.6%) 0.2% (17.2%) (3.7%) 10.7% 4.2% (13.4%) 5.1% 15.1% 5.5% (22.0%) (16.9%) (2.5%) (17.4%) (7.8%) 8.3% 2.1% (17.5%) 2.9% 14.0% 0.9% (18.9%) (14.9%) (3.8%) (18.2%) (11.1%) 7.5% (2.2%) (14.3%) 3.4% 14.4% (1.0%) (22.4%) (14.4%) (5.0%) (22.4%) (10.4%) 8.2% (4.2%) (14.6%) 4.3% 15.4% (2.9%) (20.4%) (9.0%) (2.8%) (18.2%) (12.3%) 8.7% (0.5%) (12.8%) 5.7% 17.7% (0.5%) (19.4%) (10.1%) (6.0%) (22.5%) (15.6%) 7.3% (0.1%) (15.8%) 6.6% 14.9% (3.4%) (13.8%) (12.8%) (5.0%)
(23.0%) (14.6%) 7.3% 1.6% (14.8%) 8.2% 14.8% (3.4%) (16.4%) (12.1%) NA (21.9%) (17.6%) 8.7% 2.6% (12.7%) 7.7% 15.1% (6.0%) (13.8%) (8.7%) (1.1%) (17.9%) (13.0%) 12.2% 5.8% (10.9%) 14.4% 19.8% (1.0%) Note: For each university, a negative percentage shows how much Yale salaries would have to increase to be equal to the other university and a positive percentage indicates how much Yale salaries could drop and stay equal. This survey includes ladder faculty in all schools except Medicine, not just Arts and Sciences. Other professional schools are included OIR W061 Faculty Salaries (AAUP) at Comparative Institutions Last Updated (04/25/17)
 When reading, most of us just let a story wash over us, getting lost in the world of the book rather than paying attention to the individual elements of the plot or writing. However, in English class, our teachers ask us to look at the mechanics of the writing.