Datasheet
Year, pagecount:2013, 10 page(s)
Language:English
Downloads:8
Uploaded:November 02, 2013
Size:392 KB
Institution:
-
Comments:
Attachment:-
Download in PDF:Please log in!
Comments
No comments yet. You can be the first!Most popular documents in this category


Content extract
APEC Energy Demand and Supply Outlook – 5th Edition Chinese Taipei C H I N E S E TA I P E I Chinese Taipei’s primary energy supply is projected to grow at an average annual rate of 0.4% over the outlook period; this is due mainly to demand growth in the ‘other’ sector which consists of the residential, commercial, and agricultural sectors. The economy aims to reduce its total CO2 emissions by changing its energy mix, specifically increasing imports of natural gas, developing renewable energy sources, and employing cleaner coal technologies and carbon capture and storage (CCS). The Renewable Energy Development Act (2009) has been introduced to speed up the development of clean energy. The share of electricity generated from renewable energy sources is expected to rise from 1% of total electricity generation in 2005 to about 8% in 2025. Government policy goals in the energy sector include reducing the economy’s energy intensity by 50% by 2025 (from 2005
levels) and returning CO2 emissions to 2000 levels by 2025. The projected average rate for 2010–2035 is below the high average annual GDP growth rate of 4.7% in the 1990–2009 period, indicating that Chinese Taipei is becoming a highly developed economy. At the same time, GDP per person is projected to grow from USD 29 200 in 2009 to USD 70 611 by 2035, at an average annual growth rate at 3.2% These GDP per capita figures also show a gradually decreasing trend when compared with the 1990–2009 period. ECONOMY Chinese Taipei is located in the middle of a chain of islands stretching from Japan in the north to the Philippines in the south. Its position, just 160 kilometres off the southeastern coast of China, makes it a natural gateway to East Asia. The economy is made up of the islands of Taiwan, Penghu, Kinmen, Matsu, and several islets, with a total area of about 36 188 square kilometres. Only one-quarter of the land is arable, although the subtropical climate permits
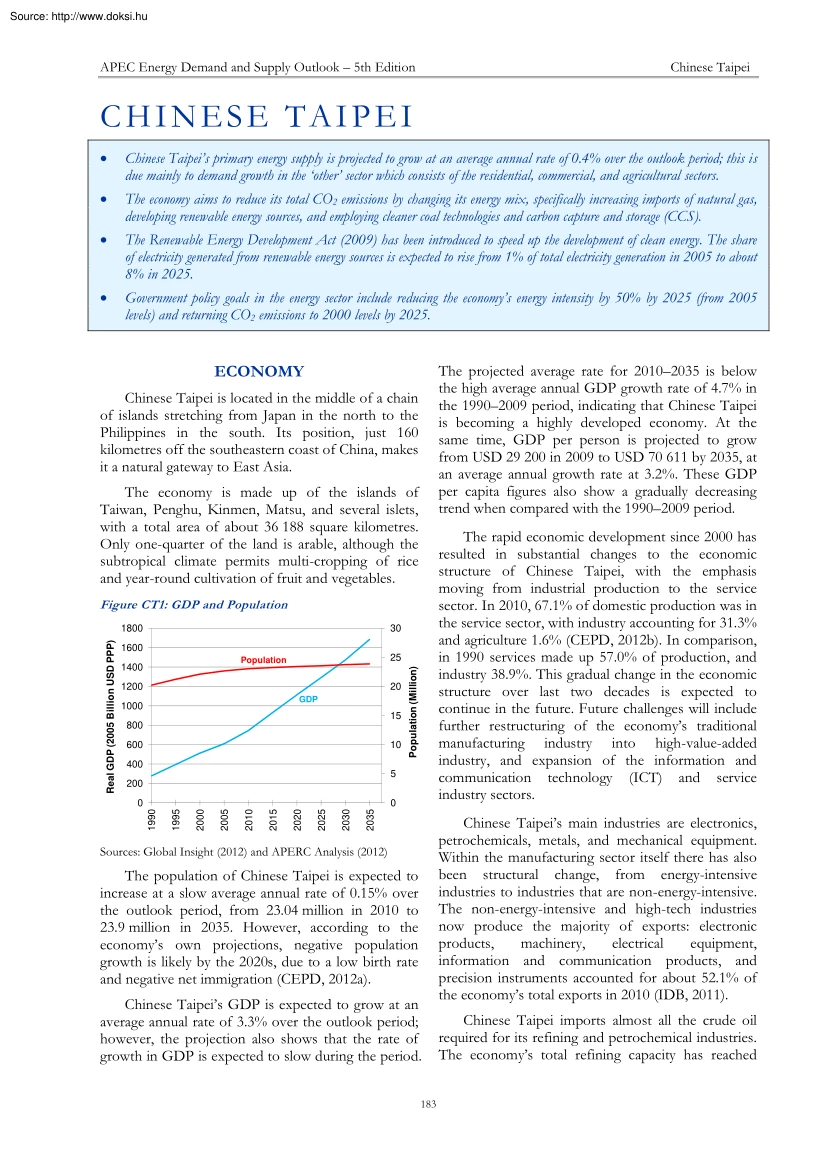
multi-cropping of rice and year-round cultivation of fruit and vegetables. The rapid economic development since 2000 has resulted in substantial changes to the economic structure of Chinese Taipei, with the emphasis moving from industrial production to the service sector. In 2010, 671% of domestic production was in the service sector, with industry accounting for 31.3% and agriculture 1.6% (CEPD, 2012b) In comparison, in 1990 services made up 57.0% of production, and industry 38.9% This gradual change in the economic structure over last two decades is expected to continue in the future. Future challenges will include further restructuring of the economy’s traditional manufacturing industry into high-value-added industry, and expansion of the information and communication technology (ICT) and service industry sectors. Figure CT1: GDP and Population 30 1600 25 Population 1400 1200 20 GDP 1000 15 800 600 10 Population (Million) Real GDP (2005 Billion USD PPP) 1800 400 5
200 2035 2030 2025 2020 2015 2010 2005 2000 1995 0 1990 0 Sources: Global Insight (2012) and APERC Analysis (2012) The population of Chinese Taipei is expected to increase at a slow average annual rate of 0.15% over the outlook period, from 23.04 million in 2010 to 23.9 million in 2035 However, according to the economy’s own projections, negative population growth is likely by the 2020s, due to a low birth rate and negative net immigration (CEPD, 2012a). Chinese Taipei’s GDP is expected to grow at an average annual rate of 3.3% over the outlook period; however, the projection also shows that the rate of growth in GDP is expected to slow during the period. 183 Chinese Taipei’s main industries are electronics, petrochemicals, metals, and mechanical equipment. Within the manufacturing sector itself there has also been structural change, from energy-intensive industries to industries that are non-energy-intensive. The non-energy-intensive and high-tech industries now
produce the majority of exports: electronic products, machinery, electrical equipment, information and communication products, and precision instruments accounted for about 52.1% of the economy’s total exports in 2010 (IDB, 2011). Chinese Taipei imports almost all the crude oil required for its refining and petrochemical industries. The economy’s total refining capacity has reached APEC Energy Demand and Supply Outlook – 5th Edition Chinese Taipei 1.26 million barrels per day, which exceeds the domestic demand for petroleum productsChinese Taipei is a net exporter of refined petroleum products (BOE, 2012a). ENERGY RESOURCES AND INFRASTRUCTURE Chinese Taipei has very limited indigenous energy resources: domestic natural gas provides just 0.1% of the economy’s primary supply, while hydro provides 0.3%, and geothermal, solar and wind power combined provide 0.2% The industry sector (including non-energy use) is the single greatest consumer of energy in the economy,
accounting for about 64% of final demand in 2010. It was followed by domestic transportation at 18%, residential at 9% and commercial at 6%; agriculture and non-specified demand account for the balance. Energy use in industry is dominated by chemical and petrochemical processing (about 37% in 2010), while iron and steel production used about 15%. Instead, Chinese Taipei relies on imports for most of its energy requirements and is a net importer of fossil fuelsin 2010 its import dependency was 99%. On an energy equivalent basis, oil formed the biggest part of the imports, at about 50% (coming mainly from Saudi Arabia, Kuwait and Iran); coal made up 38% (mainly from Australia, Indonesia and China), while imported LNG, mainly from Indonesia and Malaysia, made up 12%. Chinese Taipei has developed a comprehensive domestic transport system including two freeways and one high-speed railway running north–south across the island of Taiwan. Transport sector energy consumption totalled about
15.6 Mtoe in 2010 most of this was used in road transportation (about 11.3 Mtoe or 73%), with international aviation using about 2.0 Mtoe (13%) Chinese Taipei has been striving to reduce its automobile dependency (in 2010 there were about 5.9 million passenger cars in the economy) and to encourage the use of public transport (CEPD, 2012b). The public transport systems include a high-speed rail system, which runs 345 km from Taipei to Kaohsiung, and rail rapid transit systems in Taipei city (110 km), in Kaohsiung city (39 km), and in Hsinchu city (11 km) (MOTC, 2012). There are plans for construction of further rail rapid transit systems in urban centres, including in Taipei, Taichung and Kaohsiung. Two LNG terminals with a total capacity of 10.44 million tonnes were operating in Chinese Taipei in 2010. More LNG terminals are planned to meet the economy’s projected growth in demand for natural gas. In addition to LNG terminals, Chinese Taipei has an extensive gas transmission and
distribution network. This infrastructure means 44.1% of the economy’s population has direct natural gas supply (BOE, 2012b). In 2012 when this outlook was prepared, there were three nuclear power plants in Chinese Taipei, each with two units, creating a total installed capacity of 5144 MW. A fourth nuclear power plant (also with two units) is under construction; these two new units are scheduled to begin commercial operation in 2014 and 2016, adding 1350 MW of capacity per unit (AEC, 2012). A revision of nuclear energy policy following the Fukushima accident in Japan means older plant decommissioning will begin when the fourth plant becomes operationalsee ‘Energy Policies’ below. The policies encouraging a shift to public transport have been successful in Taipei city, with the daily ridership increasing at an average annual rate of 18.74% from 1998 to 2011 (MOTC, 2012) In 2011 the Taipei Metro served, on average, 1.55 million passengers per day (TRTC, 2012). In 2010 the total
number of registered vehicles (including heavy vehicles) was around 7.05 million, with 78% of those domestically produced (TTVMA, 2012). Between 2002 and 2011, the total number of vehicles increased only 19.1%, with motorcycles increasing by 267% over that period (MOTC, 2012). Chinese Taipei’s total electricity generation in 2010 was 247 TWh (TPC, 2011). Fossil fuels are the basis of 78% of all electricity generated: coal provides about 52%, LNG 22%, and oil 4%. Nuclear power accounted for about 18% of total electricity generation in 2010, with the remainder coming from hydro and new renewable energy sources. As the majority of the population is concentrated in major cities, electricity is the main source of energy for almost all homes; the electricity demand has grown at an average annual rate of 4.2% from 1995 to 2010. Air conditioning in the summer season is a major source of residential electricity demand. ENERGY POLICIES Chinese Taipei’s Energy Commission, which was
established in 1979 under the Ministry of Economic Affairs (MOEA), became the Bureau of Energy in 2004. The Bureau is responsible for formulating and implementing the economy’s energy policy. Policy development since 2008 has included the establishment of a suite of energy-related regulations 184 APEC Energy Demand and Supply Outlook – 5th Edition Chinese Taipei In terms of electricity supply, Chinese Taipei aims to have an electricity supply that provides a reserve capacity of 16%, based on peak demand. Until 1998, the government-owned Taiwan Power Company (TPC) was the only power company operating in Chinese Taipei. Because of environmental issues and a complex official approval process, the construction of new power plants by TPC fell behind schedule; this resulted in the total reserve capacity falling below the government requirement between 1990 and 2004. Reserve capacity remained under 8% between 1990 and 1996. In order to stabilize the power supply, Chinese Taipei’s
electricity market was opened to independent power producers (IPPs) in 1998. TPC contracted with IPPs for a capacity of around 5000 MW to lift the target reserve capacity above 16%a target which has been achieved since 2004 (TPC, 2011). In 2010, the total IPP capacity was 7707 MW, about 18% of the economy’s total. The power produced by the IPPs is currently sold to TPC for distribution through TPC’s transmission lines. defining the rules for markets in renewable energy, petroleum products, natural gas, and electricity. The aim is to create a better energy business environment. The fundamental goal of Chinese Taipei’s energy policy is to promote energy security, supported by secure imports of oil, natural gas and coal as well as the development of domestic energy resources including nuclear, fossil fuels, and new renewable energy sources. On 5 June 2008, the Ministry of Economic Affairs released the Framework of Taiwan’s Sustainable Energy Policy (BOE, 2012c). This presents a
‘win-winwin’ solution for energy, the environment and the economy. The framework addresses the constraints that Chinese Taipei faces in terms of its insufficient natural resources and limited environmental carrying capacity. It states that sustainable energy policies should support the efficient use of the economy’s limited energy resources, the development of clean energy, and the security of energy supply. The framework establishes three goals: Reductions in energy intensity from 2005 levelsby 20% by 2015 and by 50% by 2025. In another move to avoid electricity shortages, TPC was required to adopt new management systems, including demand-side control, increasing the purchase of electricity from cogeneration systems, providing price incentives for electricity demand reduction and other energy conservation measures. The Ministry of Economic Affairs has also announced it will open a fifth round of bidding to IPPs if the reserve capacity falls below 16% in the future.
Reductions in total CO2 emissions, so that total emissions return to the 2008 level between 2016 and 2020, and are further reduced to the 2000 level by 2025; at the same time, the share of lowcarbon energy in the electricity generation system will be increased from the current 40% to 55% by 2025. Secure and stable energy supply, achieved by building a secure energy supply system to meet economic development goals, specifically 6% average annual GDP growth rate from 2008 to 2012, and USD 30 000 per capita income by 2015. In line with the government’s overall goal of privatizing TPC and promoting the liberalization of the domestic power market, the Electricity Act was approved by Chinese Taipei’s Legislative Yuan in early 2011. This enables IPPs to build and invest in transmission and distribution facilities. In addition, IPPs will be able to sell power to consumers directly, which means the market structure will no longer be a monopoly. To achieve these goals, Chinese Taipei
has set these energy conservation targets and strategies: Industry sector: raise boiler efficiency, expand cogeneration, and increase the share of highvalue-added industries Transportation sector: raise the fuel efficiency standard for private vehicles by 25% (compared to 2005 levels) by 2015 Following the 2011 Fukushima Daiichi Nuclear Power Plant Accident in Japan, Chinese Taipei reviewed its energy policy. On 3 November 2011, President Ma announced a new policy to “Steadily Reduce Nuclear Dependency, Gradually Move Towards a Nuclear-free Homeland, and Create a Low-carbon Green Energy Environment” (BOE, 2012d). The main aspects of the revised nuclear energy strategy are: Residential and commercial sectors: raise appliance efficiency standards to a range of 10% to 70% in 2011; completely eliminate incandescent lights and replace them with LED lighting by 2025. To steadily reduce nuclear energy dependence by actively reducing electricity demand and peak
Power sector: replace old coal-fired and gas-fired units with high-efficiency generating units and reduce line losses by improving power dispatch and transmission facilities To conduct a comprehensive safety examination of nuclear power plants to ensure nuclear safety 185 APEC Energy Demand and Supply Outlook – 5th Edition Chinese Taipei load, and by promoting alternative energy sources to ensure stable power supply periods is due to energy conservation efforts in all sectors and the economy’s overall industry restructuring. The ‘other’ sector (which includes commercial, residential, and agricultural use) shows the highest annual growth rate of 1.5%, followed by industry at 0.6% The economy’s final energy intensity is expected to decline by about 52% between 2005 and 2035. No extension to the lifespan of the three existing nuclear power plants (six units), with the expected first decommissioning to begin in 2018 and all six existing units to be
decommissioned by 2025 The safety of the fourth nuclear power plant (currently in construction) must be ensured prior to its commercial operation Figure CT2: BAU Final Energy Demand Industry If the two reactor units of the fourth nuclear power plant are operating securely before 2016, the decommissioning of the oldest nuclear power plant will begin immediately (ahead of the planned 2018 date). Other Non-Energy Domestic Transport International Transport 90 80 70 MTOE 60 To implement the new energy policy, Chinese Taipei has set a goal for the total installed capacity based on renewable sources to reach 9952 MW by 2025 and 12 502 MW by 2030. This will come from wind power (4200 MW), solar photo-voltaic (3100 MW), hydro (2502 MW), waste (1369 MW), ocean (600 MW), fuel cell (500 MW), and geothermal/bio-gas (231 MW). The installed renewables capacity is also expected to contribute about 10% of the economy’s overall power requirement by 2030. 50 40 30 20 10 0 1990
1995 2000 2005 2010 2015 2020 2025 2030 2035 Source: APERC Analysis (2012) Historical Data: World Energy Statistics 2011 OECD/IEA 2011 Figure CT3: BAU Final Energy Intensity Total Final Energy Demand Index GDP Index Final Energy Intensity Index 300 Index (2005 = 100) Chinese Taipei’s Renewable Energy Development Act (2009) also set up the incentives for private investment in renewable energy which are provided through a feed-in tariff (FIT) mechanism, under which TPC purchases power from renewables generators on contracts involving preferential rates and guaranteed grid connections. The overall aim is to secure the market for electricity generated from renewable energy. 250 200 150 100 50 2035 2030 2025 2020 2015 2010 2005 2000 Overall, Chinese Taipei is expected to continue to import almost all of its energy requirements throughout the outlook period due to its lack of indigenous energy sources. To minimize the impact of any oil supply disruptions, Chinese Taipei
maintains an oil stockpile of no less than 60 days’ supply. The economy has also tried to diversify its energy supply mix by switching from oil to natural gas, coal and renewable energy. In addition, it has started to secure international joint venture agreements to acquire captive supply sources (BOE, 2012e). 1995 1990 0 Source: APERC Analysis (2012) Industry Energy demand in the industrial sector is projected to grow at an average annual rate of 0.6% over the outlook period; this is lower than the average annual growth rate of 2.5% between 1990 and 2009. This reduction in demand growth is due to structural shift in the industrial sector, from energyintensive to non-energy-intensive industries, as well as improvements in energy efficiency. The current dominance of the petrochemical industry makes the Chinese Taipei industrial sector highly energy intensive. This energy intensity will reduce, as will the rate of increase in the sector’s energy demand, as the electronics and
ICT industries are expected to grow more quickly than the petrochemical industry. BUSINESS-AS-USUAL OUTLOOK FINAL ENERGY DEMAND Chinese Taipei’s final energy demand is expected to grow 0.7% per year over the outlook period The slowing of demand growth compared to earlier 186 APEC Energy Demand and Supply Outlook – 5th Edition Chinese Taipei The energy mix for the industrial sector over the outlook period shows a slow increase for coal and oil, accompanied by a much more rapid increase in the use of electricity and gas. This energy consumption trend matches the structural change from highenergy-intensive industry to high-value-added electronic or ICT-based industry. Energy intensity in this sector is expected to decline by 1.5% per year over the outlook period. is expected to grow at an average annual rate of only 0.4% over the outlook period By contrast, transport electricity consumption is expected to grow at an average annual rate of 5.5%, matching the growth in public
transportation systems. However, even in 2035, electricity use in transport will remain small compared to oil use. However, the projection also shows a continued growth in non-energy demand for fossil fuels. Petrochemicals will continue to play a major role in industry and in the economy’s overall GDP growth, and Chinese Taipei will remain a larger exporter of petroleum products. Energy demand in the ‘other’ sector, which includes residential, commercial, and agricultural demand, is primarily driven by income growth and the improvement in living standards. The ‘other’ sector energy demand will grow at an average annual rate of 1.5% over the outlook period Electricity is expected to continue to dominate the energy mix, accounting for 68% in 2035. Other Transport However, the annual growth rate for this sector is expected to slow in the long term, based on the adoption of many energy conservation measures, such as increased energy efficiency in appliances and other
equipment, replacement and improvement of lighting, as well as incentives for energy conservation. The promotion of zero-energy (and zero-emission) construction will also make a contribution to reducing future energy consumption in the commercial and residential sectors. Chinese Taipei’s transport energy consumption has grown in parallel with its economic development, improvement in living standards, and upgrades in transportation infrastructure. The steep growth of the recent decades is expected to slow over the outlook period. While all domestic transport sub-sectors showed substantial average annual growth of 3.0% between 1990 and 2009, growth is expected to be slower between 2010 and 2035. Projections for the annual growth rate in number of passenger vehicles in use (less than 1.9%), and for motorcycles in use (less than 1.6%) are low, while the number of heavy vehicles (including buses) will grow a little faster (more than 2%). PRIMARY ENERGY SUPPLY To reduce carbon
emissions, Chinese Taipei is gradually reducing coal’s share in its primary energy supply (from 38% in 2009 to 25% by 2035). Total transport energy demand (domestic and international) is expected to grow slowly over the outlook period at an average annual rate of about 0.6% This is due to improvement in public transportation systems and increases in vehicle energy efficiency. Energy use for domestic transportation has a projected annual growth rate of 0.5%, lower than the international transportation annual growth rate of 0.7% The growth in international aviation energy demand is based on exports of high-valueadded manufacturing products, and the increase in direct air travel between Chinese Taipei and mainland China. To accommodate the predicted growth in air transport, Chinese Taipei has converted Songshan Airport in Taipei city to an international airport, expanded the freight handling capacity at Kaohsiung Airport, and is planning a third terminal at Taoyuan Airport. Figure
CT4: BAU Primary Energy Supply Coal Oil Gas Hydro NRE Nuclear Electricity-Net Import 140 120 MTOE 100 80 60 40 20 0 1990 1995 2000 2005 2010 2015 2020 2025 2030 2035 Source: APERC Analysis (2012) Historical Data: World Energy Statistics 2011 OECD/IEA 2011 Another recent policy initiative requires reduction in dependence on nuclear energy. The reduction in the use of coal and nuclear power will require an increase in the gas share of the primary supply (from 10% in 2009 to 23% by 2035) and more aggressive exploitation of renewable energy sources (from 1% in 2009 to 5% by 2035). The reduction in Over the outlook period, rail transit systems are expected to gradually replace buses and passenger vehicles for city travel, while high-speed railways are expected to continue to replace passenger vehicles for inter-city travel. As a result, transport oil demand 187 APEC Energy Demand and Supply Outlook – 5th Edition Chinese Taipei coal imports and fast growth in gas
imports are shown in Figure CT5. Figure CT6: BAU Electricity Generation Mix Coal Oil Gas Hydro NRE Figure CT5: BAU Energy Production and Net Imports Production and Import (MTOE) Coal Oil Gas Coal Imports Oil Imports 27% Gas Imports 21% 18% 10% 17% 17% 7% 18% 20% 22% 17% 19% Nuclear Import 7% 7% 7% 6% 9% 8% 37% 70 23% 60 7% 34% 38% 43% 25% 50 26% 40 49% 30 55% 52% 40% 56% 48% 45% 28% 39% 34% 20 1990 1995 2000 2005 2010 2015 2020 2025 2030 2035 10 Source: APERC Analysis (2012) 2035 2030 2025 2020 2015 2010 2005 2000 1995 1990 0 Historical Data: World Energy Statistics 2011 OECD/IEA 2011 CO2 EMISSIONS Source: APERC Analysis (2012) Chinese Taipei’s total CO2 emissions from fuel combustion are projected to reach 297 million tonnes of CO2 in 2035, which is 15% higher than in 2009 and 158% of the 1990 level. Total CO2 emissions are expected to peak at 307 million tonnes in 2025. In 2008, Chinese Taipei set a policy goal
of a zero increase on 2000 levels (historically 219.4 million tonnes of CO2 (IEA, 2009, p. III42))this projection in 2025 shows an overall increase of 40% on those 2000 levels. This outcome is a consequence of the 2011 change in energy policy to avoid extending the lifespan of existing nuclear power plants and to increase the use of coal- and gas-fired power plants to fill the gap. For Chinese Taipei to meet its own CO2 emission reduction targets, more development of NRE will be necessary. Current development plans have identified offshore wind turbines and geothermal as potential sources. Another option to reduce CO2 emissions is adoption of cleaner coal technologies and carbon capture and storage (CCS) in the economy’s coal-fired power plants. Efficient coal technologies are discussed further in Volume 1, Chapter 13. Historical Data: World Energy Statistics 2011 OECD/IEA 2011 ELECTRICITY This business-as-usual (BAU) projection takes into account the November 2011 revision of
energy policy, which announced the gradual phase-out of existing nuclear power plants. By 2035, Chinese Taipei’s total installed capacity is expected to reach 73.0 GW The majority of this will be thermal (76%); this is made up of coal (33% of total generation capacity), natural gas (38%) and oil (5%). Other generation capacity at the end of the outlook period will be from nuclear (4%), NRE (13%), and hydro (7%). Chinese Taipei’s total electricity generation is projected to increase from 226 TWh in 2009 to 336 TWh in 2035, growing at an average annual rate of 1.2% Efforts to reduce the economy’s CO2 emission intensity will mean the share of coal will decrease from 55% in 2009 to 34% in 2035; it will be replaced by increased generation from natural gas and NRE sources. The natural gas share will increase significantly from 20% in 2009 to 43% in 2035. The electricity generation sector is expected to account for the largest share of CO2 emissions in 2035 at 52% of total CO2
emissions (156 million tonnes of CO2). The industry sector is the next highest contributor, at 14% (41 million tonnes of CO2), followed by the domestic transportation sector at 12% (37 million tonnes of CO2). Nuclear’s share is expected to decrease from 18% in 2009 to only 7% in 2035, as a result of the decision not to extend the lifespan of existing plants. The share of electricity generation supplied by hydro is projected to increase from 2% in 2009 to around 4% in 2035. At the same time, as a result of government policy to promote the development of new and renewable energy sources (mainly wind power), the NRE share will increase from 2% in 2009 to 8% in 2035. 188 APEC Energy Demand and Supply Outlook – 5th Edition Chinese Taipei The establishment of international stockpiling through regional cooperation could be an important way of stabilizing domestic energy supply, as could the acquisition of equity in international energy resource developments by the government-owned
oil company. Figure CT7: BAU CO2 Emissions by Sector Electricity Generation Other Other Transformation Domestic Transport Industry International Transport 350 Million Tonnes CO2 300 250 200 ALTERNATIVE SCENARIOS 150 To address the energy security, economic development, and environmental sustainability challenges posed by the business-as-usual (BAU) outcomes, three sets of alternative scenarios were developed for most APEC economies. 100 50 0 1990 1995 2000 2005 2010 2015 2020 2025 2030 2035 HIGH GAS SCENARIO Source: APERC Analysis (2012) To understand the impacts higher gas production might have on the energy sector, an alternative ‘High Gas Scenario’ was developed. The assumptions behind this scenario are discussed in more detail in Volume 1, Chapter 12. The scenario was built around estimates of gas production that might be available at BAU prices or below, if constraints on gas production and trade could be reduced. The decomposition analysis shown in Table CT1
suggests the growth in Chinese Taipei’s GDP will be offset by a reduction in the energy intensity of GDP (energy efficiency and change in industrial structure) and a small reduction in the CO2 intensity of energy (fuel switching). Table CT1: Analysis of Reasons for Change in BAU CO 2 Emissions from Fuel Combustion However, as Chinese Taipei’s gas resources are very limited, the High Gas Scenario assumes no domestic production increasesas shown in Figure CT8. (Average Annual Percent Change) Change in CO2 Intensity of Energy 19902005 0.6% 20052010 -1.4% 20052030 -0.3% 20052035 -0.3% 20102035 -0.1% Change in Energy Intensity of GDP Change in GDP Total Change -0.2% 5.3% 5.8% -2.1% 4.1% 0.5% -2.7% 3.6% 0.5% -2.7% 3.5% 0.4% -2.8% 3.3% 0.3% Figure CT8: High Gas Scenario – Gas Production Source: APERC Analysis (2012) BAU Scenario CHALLENGES AND IMPLICATIONS OF BAU High Gas Scenario 0.3 With limited domestic energy resources, the security of Chinese Taipei’s energy
supply is central to its energy policy goals of meeting a growing energy demand while reducing CO2 emissions. The economy will have to look to low-carbon energy sources, in particular replacing coal with natural gas and renewable energy. Chinese Taipei has already moved to promote renewable energy with the 2009 introduction of the Renewable Energy Development Act, which uses preferential feed-in tariffs and guaranteed grid connections to encourage NREbased generation. MTOE 0.25 0.2 0.15 0.1 0.05 0 2010 2020 2035 Source: APERC Analysis (2012) Additional gas consumption in Chinese Taipei in the High Gas Scenario will be a result of increased gas imports, as a result of the improved gas market situation in the APEC region. It will require the expansion of LNG terminals in the economy. Given Chinese Taipei’s aspirations to reduce CO2 emissions, this High Gas Scenario assumes the additional imported gas would be used to replace coal in electricity generation, as gas generally has
less than half the CO2 emissions of coal when used for electricity generation. To decouple energy consumption and GDP growth, the service sector needs to be promoted and expanded and the industry sector needs to move to a less energy-intensive structure. For example, promoting knowledge-based industries in the Green Silicon Island, and other high-value-added and lowenergy-intensive scientific industry parks, could be one way to foster a less energy-intensive economy. At the same time, energy efficiency efforts need to be promoted throughout the economy. 189 APEC Energy Demand and Supply Outlook – 5th Edition Chinese Taipei urban development scenarios. The difference between the scenarios is significant, with vehicle ownership being about 9% higher in the High Sprawl scenario compared to BAU in 2035, and about 8% and 9% lower in the Constant Density and Fixed Urban Land scenarios respectively. The model results suggest that better urban planning could significantly reduce the
need for people to own vehicles. Figure CT9 shows the High Gas Scenario electricity generation mix. This graph may be compared with the BAU case graph shown in Figure CT6. It can be seen that the gas share has increased by 4% by 2035, while the coal share has declined by an equal amount. Figure CT9: High Gas Scenario – Electricity Generation Mix Oil 27% Gas 21% 18% Hydro 18% NRE 19% 20% Nuclear Figure CT11: Urban Development Scenarios – Vehicle Ownership Import 7% 7% 7% 6% 9% 8% Vehicles/1000 People Coal 37% 10% 17% 17% 7% 22% 7% 18% 24% 36% 41% 47% 25% 26% 49% 55% 52% 55% 46% 40% 42% 36% 28% 30% BAU High Sprawl Constant Density 400 300 200 100 0 2010 1990 1995 2000 2005 2010 2015 2020 2025 2030 2035 2035 Figure CT12 shows the change in light vehicle oil consumption under BAU and the three alternative urban development scenarios. The impact of better urban planning on light vehicle oil consumption is even more pronounced than on
vehicle ownership, as more compact cities reduce both the need for vehicles and the distances they must travel. Light vehicle oil consumption would be 18% higher in the High Sprawl scenario compared to BAU in 2035, and about 14% and 17% lower in the Constant Density and Fixed Urban Land scenarios respectively. Historical Data: World Energy Statistics 2011 OECD/IEA 2011 The resulting reduction in CO2 emissions from electricity generation for Chinese Taipei is shown in Figure CT10. By 2035 there would be a 33% reduction compared to BAU scenario emissions. Figure CT10: High Gas Scenario – CO2 Emissions from Electricity Generation High Gas Scenario 180 Figure CT12: Urban Development Scenarios – Light Vehicle Oil Consumption 160 140 120 BAU 100 80 60 MTOE Million Tonnes CO2 2020 Source: APERC Analysis (2012) Source: APERC Analysis (2012) BAU Scenario Fixed Urban Land 500 40 20 0 2010 2020 2035 Source: APERC Analysis (2012) High Sprawl Constant Density Fixed Urban
Land 2020 2035 12 10 8 6 4 2 0 2010 ALTERNATIVE URBAN DEVELOPMENT SCENARIOS Source: APERC Analysis (2012) Figure CT13 shows the change in light vehicle CO2 emissions under BAU and the three alternative urban development scenarios. The impact of urban planning on CO2 emissions is similar to the impact of urban planning on energy use, since there is no significant change in the mix of fuels used under any of these scenarios. Light vehicle CO2 emissions would be 18% higher in the High Sprawl scenario compared to the BAU scenario in 2035. They would To understand the impact of future urban development on the energy sector, three alternative urban development scenarios were developed: ‘High Sprawl’, ‘Constant Density’, and ‘Fixed Urban Land’. The assumptions behind these scenarios are discussed in Volume 1, Chapter 5. Figure CT11 shows the change in vehicle ownership under BAU and the three alternative 190 APEC Energy Demand and Supply Outlook – 5th Edition
Chinese Taipei be about 14% and 17% lower in the Constant Density and Fixed Urban Land scenarios respectively. Figure CT15: Virtual Clean Car Race – Light Vehicle Oil Consumption Figure CT13: Urban Development Scenarios – Light Vehicle Tank-to-Wheel CO2 Emissions BAU High Sprawl Constant Density 30 5 20 0 10 2010 2020 2035 Source: APERC Analysis (2012) 0 2010 2020 2035 Figure CT16 shows the change in light vehicle CO2 emissions under BAU and the four alternative vehicle scenarios. To allow for consistent comparisons, in the Electric Vehicle Transition and Hydrogen Vehicle Transition scenarios the change in CO2 emissions is defined as the change in emissions from electricity and hydrogen generation. The emissions impacts of each scenario may differ significantly from its oil consumption impact, since each alternative vehicle type uses a different fuel with a different level of emissions per unit of energy. Source: APERC Analysis (2012) VIRTUAL CLEAN CAR RACE To
understand the impact of vehicle technology on the energy sector, four alternative vehicle scenarios were developed: ‘Hyper Car Transition’ (ultra-light conventionally powered vehicles), ‘Electric Vehicle Transition’, ‘Hydrogen Vehicle Transition’, and ‘Natural Gas Vehicle Transition’. The assumptions behind these scenarios are discussed in Volume 1, Chapter 5. Figure CT16: Virtual Clean Car Race – Light Vehicle CO2 Emissions Figure CT14 shows the evolution of the vehicle fleet under BAU and the four ‘Virtual Clean Car Race’ scenarios. By 2035 the share of the alternative vehicles in the fleet reaches around 60% compared to about 14% in the BAU scenario. The share of conventional vehicles in the fleet is thus only about 40%, compared to about 86% in the BAU scenario. Million Tonnes CO2 BAU Electric Vehicle Transition Natural Gas Vehicle Transition Figure CT14: Virtual Clean Car Race – Share of Alternative Vehicles in the Light Vehicle Fleet BAU Electric
Vehicle Transition Natural Gas Vehicle Transition Share of Fleet Hyper Car Transition Hydrogen Vehicle Transition 10 Fixed Urban Land MTOE Million Tonnes CO2 40 BAU Electric Vehicle Transition Natural Gas Vehicle Transition Hyper Car Transition Hydrogen Vehicle Transition 40 20 0 2010 2020 2035 Source: APERC Analysis (2012) 80% In Chinese Taipei, the Hyper Car Transition scenario is the clear winner in terms of CO2 emission reductions, with an emissions reduction of 24% compared to BAU in 2035. The Electric Vehicle Transition scenario offers emission reductions of about 15%. The Electric Vehicle Transition scenario does not do as well as the Hyper Car Transition scenario in Chinese Taipei because in this economy coal-fired generation would be the marginal source for much of the additional electricity required by the electric vehicles. 60% 40% 20% 0% 2020 Hyper Car Transition Hydrogen Vehicle Transition 2035 Source: APERC Analysis (2012) Figure CT15 shows the
change in light vehicle oil consumption under BAU and the four alternative vehicle scenarios. Oil consumption drops by 39% in the Electric Vehicle Transition, Hydrogen Vehicle Transition, and Natural Gas Vehicle Transition scenarios compared to BAU by 2035. The drop is large as these alternative vehicles use no oil. Oil demand in the Hyper Car Transition scenario is also significantly reduced compared to BAU: down 25% by 2035even though these highly efficient vehicles still use oil. Under the Natural Gas Vehicle Transition scenario, 2035 emissions would be reduced by about 5%, reflecting the slightly lower carbon intensity of natural gas and the slightly higher efficiency of natural gas vehicles compared to conventional vehicles. The Hydrogen Vehicles Transition scenario 191 APEC Energy Demand and Supply Outlook – 5th Edition Chinese Taipei would have no reduction in emissions. This is mainly due to the way the hydrogen is assumed to be producedfrom steam methane reforming of
gas, a process that involves significant CO2 emissions. TPC (Taiwan Power Company) (2011), 2010 Taiwan Power Company Annual Report, www.taipowercomtw/ TRTC (Taipei Rapid Transit Corporation) (2012), “Traffic Statistics” website page, in Chinese, www.trtccomtw/ctasp?xItem=1366864&CtNo de=27643&mp=122031 REFERENCES AEC (Atomic Energy Council) (2012), Atomic Energy Annual Report – 2011, www.aecgovtw/www/service/other/files/annu al 100/index.html TTVMA (Taiwan Transportation Vehicle Manufacturers Association) (2012), “Vehicle Statistics” website page, in Chinese, www.ttvmaorgtw/cht/informationphp BOE (Bureau of Energy, of Chinese Taipei Ministry of Economic Affairs) (2012a), 2010 Energy Statistical Hand Book, www.moeaboegovtw/ –– (2012b), BOE Annual Report, 2010, www.moeaboegovtw/opengovinfo/Plan/all/en ergy year/main/EnergyYearMain.aspx?PageId= default –– (2012c), Framework of Taiwan’s Sustainable Energy Policy, www.moeaboegovtw/English/english indexas
px?Group=4 –– (2012d), New Energy Policy of Taiwan, www.moeaboegovtw/English/english indexas px?Group=4 –– (2012e), Petroleum Administration Law, law.mojgovtw/Eng/LawClass/LawAllaspx?PC ode=J0020019 CEPD (Council for Economic Planning and Development) (2012a), Population Projection for Chinese Taipei from 2012–2060, 2011, www.cepdgovtw/m1aspx?sNo=0000455 –– (2012b), Taiwan Statistical Data Book – 2011, Executive Yuan, Chinese Taipei, www.cepdgovtw/ Global Insight (2012), World Industry Services, retrieved from IHS Global Insight Data Service. IDB (Industrial Development Bureau, of Chinese Taipei Ministry of Economic Affairs) (2011), Major Indicators of Manufacturing Sector in 2009, www.moeaidbgovtw IEA (International Energy Agency) (2009), CO2 Emissions from Fuel Combustion2009 Edition. –– (2011), World Energy Statistics 2011, retrieved from OECD/IEA CD-ROM Service. MOTC (Ministry of Transportation and Communication, Chinese Taipei) (2012), 2010 Traffic Year Book,
www.motcgovtw/motchypage/hypagecgi?HYP AGE=yearbook.asp&mp=1 192
levels) and returning CO2 emissions to 2000 levels by 2025. The projected average rate for 2010–2035 is below the high average annual GDP growth rate of 4.7% in the 1990–2009 period, indicating that Chinese Taipei is becoming a highly developed economy. At the same time, GDP per person is projected to grow from USD 29 200 in 2009 to USD 70 611 by 2035, at an average annual growth rate at 3.2% These GDP per capita figures also show a gradually decreasing trend when compared with the 1990–2009 period. ECONOMY Chinese Taipei is located in the middle of a chain of islands stretching from Japan in the north to the Philippines in the south. Its position, just 160 kilometres off the southeastern coast of China, makes it a natural gateway to East Asia. The economy is made up of the islands of Taiwan, Penghu, Kinmen, Matsu, and several islets, with a total area of about 36 188 square kilometres. Only one-quarter of the land is arable, although the subtropical climate permits
multi-cropping of rice and year-round cultivation of fruit and vegetables. The rapid economic development since 2000 has resulted in substantial changes to the economic structure of Chinese Taipei, with the emphasis moving from industrial production to the service sector. In 2010, 671% of domestic production was in the service sector, with industry accounting for 31.3% and agriculture 1.6% (CEPD, 2012b) In comparison, in 1990 services made up 57.0% of production, and industry 38.9% This gradual change in the economic structure over last two decades is expected to continue in the future. Future challenges will include further restructuring of the economy’s traditional manufacturing industry into high-value-added industry, and expansion of the information and communication technology (ICT) and service industry sectors. Figure CT1: GDP and Population 30 1600 25 Population 1400 1200 20 GDP 1000 15 800 600 10 Population (Million) Real GDP (2005 Billion USD PPP) 1800 400 5
200 2035 2030 2025 2020 2015 2010 2005 2000 1995 0 1990 0 Sources: Global Insight (2012) and APERC Analysis (2012) The population of Chinese Taipei is expected to increase at a slow average annual rate of 0.15% over the outlook period, from 23.04 million in 2010 to 23.9 million in 2035 However, according to the economy’s own projections, negative population growth is likely by the 2020s, due to a low birth rate and negative net immigration (CEPD, 2012a). Chinese Taipei’s GDP is expected to grow at an average annual rate of 3.3% over the outlook period; however, the projection also shows that the rate of growth in GDP is expected to slow during the period. 183 Chinese Taipei’s main industries are electronics, petrochemicals, metals, and mechanical equipment. Within the manufacturing sector itself there has also been structural change, from energy-intensive industries to industries that are non-energy-intensive. The non-energy-intensive and high-tech industries now
produce the majority of exports: electronic products, machinery, electrical equipment, information and communication products, and precision instruments accounted for about 52.1% of the economy’s total exports in 2010 (IDB, 2011). Chinese Taipei imports almost all the crude oil required for its refining and petrochemical industries. The economy’s total refining capacity has reached APEC Energy Demand and Supply Outlook – 5th Edition Chinese Taipei 1.26 million barrels per day, which exceeds the domestic demand for petroleum productsChinese Taipei is a net exporter of refined petroleum products (BOE, 2012a). ENERGY RESOURCES AND INFRASTRUCTURE Chinese Taipei has very limited indigenous energy resources: domestic natural gas provides just 0.1% of the economy’s primary supply, while hydro provides 0.3%, and geothermal, solar and wind power combined provide 0.2% The industry sector (including non-energy use) is the single greatest consumer of energy in the economy,
accounting for about 64% of final demand in 2010. It was followed by domestic transportation at 18%, residential at 9% and commercial at 6%; agriculture and non-specified demand account for the balance. Energy use in industry is dominated by chemical and petrochemical processing (about 37% in 2010), while iron and steel production used about 15%. Instead, Chinese Taipei relies on imports for most of its energy requirements and is a net importer of fossil fuelsin 2010 its import dependency was 99%. On an energy equivalent basis, oil formed the biggest part of the imports, at about 50% (coming mainly from Saudi Arabia, Kuwait and Iran); coal made up 38% (mainly from Australia, Indonesia and China), while imported LNG, mainly from Indonesia and Malaysia, made up 12%. Chinese Taipei has developed a comprehensive domestic transport system including two freeways and one high-speed railway running north–south across the island of Taiwan. Transport sector energy consumption totalled about
15.6 Mtoe in 2010 most of this was used in road transportation (about 11.3 Mtoe or 73%), with international aviation using about 2.0 Mtoe (13%) Chinese Taipei has been striving to reduce its automobile dependency (in 2010 there were about 5.9 million passenger cars in the economy) and to encourage the use of public transport (CEPD, 2012b). The public transport systems include a high-speed rail system, which runs 345 km from Taipei to Kaohsiung, and rail rapid transit systems in Taipei city (110 km), in Kaohsiung city (39 km), and in Hsinchu city (11 km) (MOTC, 2012). There are plans for construction of further rail rapid transit systems in urban centres, including in Taipei, Taichung and Kaohsiung. Two LNG terminals with a total capacity of 10.44 million tonnes were operating in Chinese Taipei in 2010. More LNG terminals are planned to meet the economy’s projected growth in demand for natural gas. In addition to LNG terminals, Chinese Taipei has an extensive gas transmission and
distribution network. This infrastructure means 44.1% of the economy’s population has direct natural gas supply (BOE, 2012b). In 2012 when this outlook was prepared, there were three nuclear power plants in Chinese Taipei, each with two units, creating a total installed capacity of 5144 MW. A fourth nuclear power plant (also with two units) is under construction; these two new units are scheduled to begin commercial operation in 2014 and 2016, adding 1350 MW of capacity per unit (AEC, 2012). A revision of nuclear energy policy following the Fukushima accident in Japan means older plant decommissioning will begin when the fourth plant becomes operationalsee ‘Energy Policies’ below. The policies encouraging a shift to public transport have been successful in Taipei city, with the daily ridership increasing at an average annual rate of 18.74% from 1998 to 2011 (MOTC, 2012) In 2011 the Taipei Metro served, on average, 1.55 million passengers per day (TRTC, 2012). In 2010 the total
number of registered vehicles (including heavy vehicles) was around 7.05 million, with 78% of those domestically produced (TTVMA, 2012). Between 2002 and 2011, the total number of vehicles increased only 19.1%, with motorcycles increasing by 267% over that period (MOTC, 2012). Chinese Taipei’s total electricity generation in 2010 was 247 TWh (TPC, 2011). Fossil fuels are the basis of 78% of all electricity generated: coal provides about 52%, LNG 22%, and oil 4%. Nuclear power accounted for about 18% of total electricity generation in 2010, with the remainder coming from hydro and new renewable energy sources. As the majority of the population is concentrated in major cities, electricity is the main source of energy for almost all homes; the electricity demand has grown at an average annual rate of 4.2% from 1995 to 2010. Air conditioning in the summer season is a major source of residential electricity demand. ENERGY POLICIES Chinese Taipei’s Energy Commission, which was
established in 1979 under the Ministry of Economic Affairs (MOEA), became the Bureau of Energy in 2004. The Bureau is responsible for formulating and implementing the economy’s energy policy. Policy development since 2008 has included the establishment of a suite of energy-related regulations 184 APEC Energy Demand and Supply Outlook – 5th Edition Chinese Taipei In terms of electricity supply, Chinese Taipei aims to have an electricity supply that provides a reserve capacity of 16%, based on peak demand. Until 1998, the government-owned Taiwan Power Company (TPC) was the only power company operating in Chinese Taipei. Because of environmental issues and a complex official approval process, the construction of new power plants by TPC fell behind schedule; this resulted in the total reserve capacity falling below the government requirement between 1990 and 2004. Reserve capacity remained under 8% between 1990 and 1996. In order to stabilize the power supply, Chinese Taipei’s
electricity market was opened to independent power producers (IPPs) in 1998. TPC contracted with IPPs for a capacity of around 5000 MW to lift the target reserve capacity above 16%a target which has been achieved since 2004 (TPC, 2011). In 2010, the total IPP capacity was 7707 MW, about 18% of the economy’s total. The power produced by the IPPs is currently sold to TPC for distribution through TPC’s transmission lines. defining the rules for markets in renewable energy, petroleum products, natural gas, and electricity. The aim is to create a better energy business environment. The fundamental goal of Chinese Taipei’s energy policy is to promote energy security, supported by secure imports of oil, natural gas and coal as well as the development of domestic energy resources including nuclear, fossil fuels, and new renewable energy sources. On 5 June 2008, the Ministry of Economic Affairs released the Framework of Taiwan’s Sustainable Energy Policy (BOE, 2012c). This presents a
‘win-winwin’ solution for energy, the environment and the economy. The framework addresses the constraints that Chinese Taipei faces in terms of its insufficient natural resources and limited environmental carrying capacity. It states that sustainable energy policies should support the efficient use of the economy’s limited energy resources, the development of clean energy, and the security of energy supply. The framework establishes three goals: Reductions in energy intensity from 2005 levelsby 20% by 2015 and by 50% by 2025. In another move to avoid electricity shortages, TPC was required to adopt new management systems, including demand-side control, increasing the purchase of electricity from cogeneration systems, providing price incentives for electricity demand reduction and other energy conservation measures. The Ministry of Economic Affairs has also announced it will open a fifth round of bidding to IPPs if the reserve capacity falls below 16% in the future.
Reductions in total CO2 emissions, so that total emissions return to the 2008 level between 2016 and 2020, and are further reduced to the 2000 level by 2025; at the same time, the share of lowcarbon energy in the electricity generation system will be increased from the current 40% to 55% by 2025. Secure and stable energy supply, achieved by building a secure energy supply system to meet economic development goals, specifically 6% average annual GDP growth rate from 2008 to 2012, and USD 30 000 per capita income by 2015. In line with the government’s overall goal of privatizing TPC and promoting the liberalization of the domestic power market, the Electricity Act was approved by Chinese Taipei’s Legislative Yuan in early 2011. This enables IPPs to build and invest in transmission and distribution facilities. In addition, IPPs will be able to sell power to consumers directly, which means the market structure will no longer be a monopoly. To achieve these goals, Chinese Taipei
has set these energy conservation targets and strategies: Industry sector: raise boiler efficiency, expand cogeneration, and increase the share of highvalue-added industries Transportation sector: raise the fuel efficiency standard for private vehicles by 25% (compared to 2005 levels) by 2015 Following the 2011 Fukushima Daiichi Nuclear Power Plant Accident in Japan, Chinese Taipei reviewed its energy policy. On 3 November 2011, President Ma announced a new policy to “Steadily Reduce Nuclear Dependency, Gradually Move Towards a Nuclear-free Homeland, and Create a Low-carbon Green Energy Environment” (BOE, 2012d). The main aspects of the revised nuclear energy strategy are: Residential and commercial sectors: raise appliance efficiency standards to a range of 10% to 70% in 2011; completely eliminate incandescent lights and replace them with LED lighting by 2025. To steadily reduce nuclear energy dependence by actively reducing electricity demand and peak
Power sector: replace old coal-fired and gas-fired units with high-efficiency generating units and reduce line losses by improving power dispatch and transmission facilities To conduct a comprehensive safety examination of nuclear power plants to ensure nuclear safety 185 APEC Energy Demand and Supply Outlook – 5th Edition Chinese Taipei load, and by promoting alternative energy sources to ensure stable power supply periods is due to energy conservation efforts in all sectors and the economy’s overall industry restructuring. The ‘other’ sector (which includes commercial, residential, and agricultural use) shows the highest annual growth rate of 1.5%, followed by industry at 0.6% The economy’s final energy intensity is expected to decline by about 52% between 2005 and 2035. No extension to the lifespan of the three existing nuclear power plants (six units), with the expected first decommissioning to begin in 2018 and all six existing units to be
decommissioned by 2025 The safety of the fourth nuclear power plant (currently in construction) must be ensured prior to its commercial operation Figure CT2: BAU Final Energy Demand Industry If the two reactor units of the fourth nuclear power plant are operating securely before 2016, the decommissioning of the oldest nuclear power plant will begin immediately (ahead of the planned 2018 date). Other Non-Energy Domestic Transport International Transport 90 80 70 MTOE 60 To implement the new energy policy, Chinese Taipei has set a goal for the total installed capacity based on renewable sources to reach 9952 MW by 2025 and 12 502 MW by 2030. This will come from wind power (4200 MW), solar photo-voltaic (3100 MW), hydro (2502 MW), waste (1369 MW), ocean (600 MW), fuel cell (500 MW), and geothermal/bio-gas (231 MW). The installed renewables capacity is also expected to contribute about 10% of the economy’s overall power requirement by 2030. 50 40 30 20 10 0 1990
1995 2000 2005 2010 2015 2020 2025 2030 2035 Source: APERC Analysis (2012) Historical Data: World Energy Statistics 2011 OECD/IEA 2011 Figure CT3: BAU Final Energy Intensity Total Final Energy Demand Index GDP Index Final Energy Intensity Index 300 Index (2005 = 100) Chinese Taipei’s Renewable Energy Development Act (2009) also set up the incentives for private investment in renewable energy which are provided through a feed-in tariff (FIT) mechanism, under which TPC purchases power from renewables generators on contracts involving preferential rates and guaranteed grid connections. The overall aim is to secure the market for electricity generated from renewable energy. 250 200 150 100 50 2035 2030 2025 2020 2015 2010 2005 2000 Overall, Chinese Taipei is expected to continue to import almost all of its energy requirements throughout the outlook period due to its lack of indigenous energy sources. To minimize the impact of any oil supply disruptions, Chinese Taipei
maintains an oil stockpile of no less than 60 days’ supply. The economy has also tried to diversify its energy supply mix by switching from oil to natural gas, coal and renewable energy. In addition, it has started to secure international joint venture agreements to acquire captive supply sources (BOE, 2012e). 1995 1990 0 Source: APERC Analysis (2012) Industry Energy demand in the industrial sector is projected to grow at an average annual rate of 0.6% over the outlook period; this is lower than the average annual growth rate of 2.5% between 1990 and 2009. This reduction in demand growth is due to structural shift in the industrial sector, from energyintensive to non-energy-intensive industries, as well as improvements in energy efficiency. The current dominance of the petrochemical industry makes the Chinese Taipei industrial sector highly energy intensive. This energy intensity will reduce, as will the rate of increase in the sector’s energy demand, as the electronics and
ICT industries are expected to grow more quickly than the petrochemical industry. BUSINESS-AS-USUAL OUTLOOK FINAL ENERGY DEMAND Chinese Taipei’s final energy demand is expected to grow 0.7% per year over the outlook period The slowing of demand growth compared to earlier 186 APEC Energy Demand and Supply Outlook – 5th Edition Chinese Taipei The energy mix for the industrial sector over the outlook period shows a slow increase for coal and oil, accompanied by a much more rapid increase in the use of electricity and gas. This energy consumption trend matches the structural change from highenergy-intensive industry to high-value-added electronic or ICT-based industry. Energy intensity in this sector is expected to decline by 1.5% per year over the outlook period. is expected to grow at an average annual rate of only 0.4% over the outlook period By contrast, transport electricity consumption is expected to grow at an average annual rate of 5.5%, matching the growth in public
transportation systems. However, even in 2035, electricity use in transport will remain small compared to oil use. However, the projection also shows a continued growth in non-energy demand for fossil fuels. Petrochemicals will continue to play a major role in industry and in the economy’s overall GDP growth, and Chinese Taipei will remain a larger exporter of petroleum products. Energy demand in the ‘other’ sector, which includes residential, commercial, and agricultural demand, is primarily driven by income growth and the improvement in living standards. The ‘other’ sector energy demand will grow at an average annual rate of 1.5% over the outlook period Electricity is expected to continue to dominate the energy mix, accounting for 68% in 2035. Other Transport However, the annual growth rate for this sector is expected to slow in the long term, based on the adoption of many energy conservation measures, such as increased energy efficiency in appliances and other
equipment, replacement and improvement of lighting, as well as incentives for energy conservation. The promotion of zero-energy (and zero-emission) construction will also make a contribution to reducing future energy consumption in the commercial and residential sectors. Chinese Taipei’s transport energy consumption has grown in parallel with its economic development, improvement in living standards, and upgrades in transportation infrastructure. The steep growth of the recent decades is expected to slow over the outlook period. While all domestic transport sub-sectors showed substantial average annual growth of 3.0% between 1990 and 2009, growth is expected to be slower between 2010 and 2035. Projections for the annual growth rate in number of passenger vehicles in use (less than 1.9%), and for motorcycles in use (less than 1.6%) are low, while the number of heavy vehicles (including buses) will grow a little faster (more than 2%). PRIMARY ENERGY SUPPLY To reduce carbon
emissions, Chinese Taipei is gradually reducing coal’s share in its primary energy supply (from 38% in 2009 to 25% by 2035). Total transport energy demand (domestic and international) is expected to grow slowly over the outlook period at an average annual rate of about 0.6% This is due to improvement in public transportation systems and increases in vehicle energy efficiency. Energy use for domestic transportation has a projected annual growth rate of 0.5%, lower than the international transportation annual growth rate of 0.7% The growth in international aviation energy demand is based on exports of high-valueadded manufacturing products, and the increase in direct air travel between Chinese Taipei and mainland China. To accommodate the predicted growth in air transport, Chinese Taipei has converted Songshan Airport in Taipei city to an international airport, expanded the freight handling capacity at Kaohsiung Airport, and is planning a third terminal at Taoyuan Airport. Figure
CT4: BAU Primary Energy Supply Coal Oil Gas Hydro NRE Nuclear Electricity-Net Import 140 120 MTOE 100 80 60 40 20 0 1990 1995 2000 2005 2010 2015 2020 2025 2030 2035 Source: APERC Analysis (2012) Historical Data: World Energy Statistics 2011 OECD/IEA 2011 Another recent policy initiative requires reduction in dependence on nuclear energy. The reduction in the use of coal and nuclear power will require an increase in the gas share of the primary supply (from 10% in 2009 to 23% by 2035) and more aggressive exploitation of renewable energy sources (from 1% in 2009 to 5% by 2035). The reduction in Over the outlook period, rail transit systems are expected to gradually replace buses and passenger vehicles for city travel, while high-speed railways are expected to continue to replace passenger vehicles for inter-city travel. As a result, transport oil demand 187 APEC Energy Demand and Supply Outlook – 5th Edition Chinese Taipei coal imports and fast growth in gas
imports are shown in Figure CT5. Figure CT6: BAU Electricity Generation Mix Coal Oil Gas Hydro NRE Figure CT5: BAU Energy Production and Net Imports Production and Import (MTOE) Coal Oil Gas Coal Imports Oil Imports 27% Gas Imports 21% 18% 10% 17% 17% 7% 18% 20% 22% 17% 19% Nuclear Import 7% 7% 7% 6% 9% 8% 37% 70 23% 60 7% 34% 38% 43% 25% 50 26% 40 49% 30 55% 52% 40% 56% 48% 45% 28% 39% 34% 20 1990 1995 2000 2005 2010 2015 2020 2025 2030 2035 10 Source: APERC Analysis (2012) 2035 2030 2025 2020 2015 2010 2005 2000 1995 1990 0 Historical Data: World Energy Statistics 2011 OECD/IEA 2011 CO2 EMISSIONS Source: APERC Analysis (2012) Chinese Taipei’s total CO2 emissions from fuel combustion are projected to reach 297 million tonnes of CO2 in 2035, which is 15% higher than in 2009 and 158% of the 1990 level. Total CO2 emissions are expected to peak at 307 million tonnes in 2025. In 2008, Chinese Taipei set a policy goal
of a zero increase on 2000 levels (historically 219.4 million tonnes of CO2 (IEA, 2009, p. III42))this projection in 2025 shows an overall increase of 40% on those 2000 levels. This outcome is a consequence of the 2011 change in energy policy to avoid extending the lifespan of existing nuclear power plants and to increase the use of coal- and gas-fired power plants to fill the gap. For Chinese Taipei to meet its own CO2 emission reduction targets, more development of NRE will be necessary. Current development plans have identified offshore wind turbines and geothermal as potential sources. Another option to reduce CO2 emissions is adoption of cleaner coal technologies and carbon capture and storage (CCS) in the economy’s coal-fired power plants. Efficient coal technologies are discussed further in Volume 1, Chapter 13. Historical Data: World Energy Statistics 2011 OECD/IEA 2011 ELECTRICITY This business-as-usual (BAU) projection takes into account the November 2011 revision of
energy policy, which announced the gradual phase-out of existing nuclear power plants. By 2035, Chinese Taipei’s total installed capacity is expected to reach 73.0 GW The majority of this will be thermal (76%); this is made up of coal (33% of total generation capacity), natural gas (38%) and oil (5%). Other generation capacity at the end of the outlook period will be from nuclear (4%), NRE (13%), and hydro (7%). Chinese Taipei’s total electricity generation is projected to increase from 226 TWh in 2009 to 336 TWh in 2035, growing at an average annual rate of 1.2% Efforts to reduce the economy’s CO2 emission intensity will mean the share of coal will decrease from 55% in 2009 to 34% in 2035; it will be replaced by increased generation from natural gas and NRE sources. The natural gas share will increase significantly from 20% in 2009 to 43% in 2035. The electricity generation sector is expected to account for the largest share of CO2 emissions in 2035 at 52% of total CO2
emissions (156 million tonnes of CO2). The industry sector is the next highest contributor, at 14% (41 million tonnes of CO2), followed by the domestic transportation sector at 12% (37 million tonnes of CO2). Nuclear’s share is expected to decrease from 18% in 2009 to only 7% in 2035, as a result of the decision not to extend the lifespan of existing plants. The share of electricity generation supplied by hydro is projected to increase from 2% in 2009 to around 4% in 2035. At the same time, as a result of government policy to promote the development of new and renewable energy sources (mainly wind power), the NRE share will increase from 2% in 2009 to 8% in 2035. 188 APEC Energy Demand and Supply Outlook – 5th Edition Chinese Taipei The establishment of international stockpiling through regional cooperation could be an important way of stabilizing domestic energy supply, as could the acquisition of equity in international energy resource developments by the government-owned
oil company. Figure CT7: BAU CO2 Emissions by Sector Electricity Generation Other Other Transformation Domestic Transport Industry International Transport 350 Million Tonnes CO2 300 250 200 ALTERNATIVE SCENARIOS 150 To address the energy security, economic development, and environmental sustainability challenges posed by the business-as-usual (BAU) outcomes, three sets of alternative scenarios were developed for most APEC economies. 100 50 0 1990 1995 2000 2005 2010 2015 2020 2025 2030 2035 HIGH GAS SCENARIO Source: APERC Analysis (2012) To understand the impacts higher gas production might have on the energy sector, an alternative ‘High Gas Scenario’ was developed. The assumptions behind this scenario are discussed in more detail in Volume 1, Chapter 12. The scenario was built around estimates of gas production that might be available at BAU prices or below, if constraints on gas production and trade could be reduced. The decomposition analysis shown in Table CT1
suggests the growth in Chinese Taipei’s GDP will be offset by a reduction in the energy intensity of GDP (energy efficiency and change in industrial structure) and a small reduction in the CO2 intensity of energy (fuel switching). Table CT1: Analysis of Reasons for Change in BAU CO 2 Emissions from Fuel Combustion However, as Chinese Taipei’s gas resources are very limited, the High Gas Scenario assumes no domestic production increasesas shown in Figure CT8. (Average Annual Percent Change) Change in CO2 Intensity of Energy 19902005 0.6% 20052010 -1.4% 20052030 -0.3% 20052035 -0.3% 20102035 -0.1% Change in Energy Intensity of GDP Change in GDP Total Change -0.2% 5.3% 5.8% -2.1% 4.1% 0.5% -2.7% 3.6% 0.5% -2.7% 3.5% 0.4% -2.8% 3.3% 0.3% Figure CT8: High Gas Scenario – Gas Production Source: APERC Analysis (2012) BAU Scenario CHALLENGES AND IMPLICATIONS OF BAU High Gas Scenario 0.3 With limited domestic energy resources, the security of Chinese Taipei’s energy
supply is central to its energy policy goals of meeting a growing energy demand while reducing CO2 emissions. The economy will have to look to low-carbon energy sources, in particular replacing coal with natural gas and renewable energy. Chinese Taipei has already moved to promote renewable energy with the 2009 introduction of the Renewable Energy Development Act, which uses preferential feed-in tariffs and guaranteed grid connections to encourage NREbased generation. MTOE 0.25 0.2 0.15 0.1 0.05 0 2010 2020 2035 Source: APERC Analysis (2012) Additional gas consumption in Chinese Taipei in the High Gas Scenario will be a result of increased gas imports, as a result of the improved gas market situation in the APEC region. It will require the expansion of LNG terminals in the economy. Given Chinese Taipei’s aspirations to reduce CO2 emissions, this High Gas Scenario assumes the additional imported gas would be used to replace coal in electricity generation, as gas generally has
less than half the CO2 emissions of coal when used for electricity generation. To decouple energy consumption and GDP growth, the service sector needs to be promoted and expanded and the industry sector needs to move to a less energy-intensive structure. For example, promoting knowledge-based industries in the Green Silicon Island, and other high-value-added and lowenergy-intensive scientific industry parks, could be one way to foster a less energy-intensive economy. At the same time, energy efficiency efforts need to be promoted throughout the economy. 189 APEC Energy Demand and Supply Outlook – 5th Edition Chinese Taipei urban development scenarios. The difference between the scenarios is significant, with vehicle ownership being about 9% higher in the High Sprawl scenario compared to BAU in 2035, and about 8% and 9% lower in the Constant Density and Fixed Urban Land scenarios respectively. The model results suggest that better urban planning could significantly reduce the
need for people to own vehicles. Figure CT9 shows the High Gas Scenario electricity generation mix. This graph may be compared with the BAU case graph shown in Figure CT6. It can be seen that the gas share has increased by 4% by 2035, while the coal share has declined by an equal amount. Figure CT9: High Gas Scenario – Electricity Generation Mix Oil 27% Gas 21% 18% Hydro 18% NRE 19% 20% Nuclear Figure CT11: Urban Development Scenarios – Vehicle Ownership Import 7% 7% 7% 6% 9% 8% Vehicles/1000 People Coal 37% 10% 17% 17% 7% 22% 7% 18% 24% 36% 41% 47% 25% 26% 49% 55% 52% 55% 46% 40% 42% 36% 28% 30% BAU High Sprawl Constant Density 400 300 200 100 0 2010 1990 1995 2000 2005 2010 2015 2020 2025 2030 2035 2035 Figure CT12 shows the change in light vehicle oil consumption under BAU and the three alternative urban development scenarios. The impact of better urban planning on light vehicle oil consumption is even more pronounced than on
vehicle ownership, as more compact cities reduce both the need for vehicles and the distances they must travel. Light vehicle oil consumption would be 18% higher in the High Sprawl scenario compared to BAU in 2035, and about 14% and 17% lower in the Constant Density and Fixed Urban Land scenarios respectively. Historical Data: World Energy Statistics 2011 OECD/IEA 2011 The resulting reduction in CO2 emissions from electricity generation for Chinese Taipei is shown in Figure CT10. By 2035 there would be a 33% reduction compared to BAU scenario emissions. Figure CT10: High Gas Scenario – CO2 Emissions from Electricity Generation High Gas Scenario 180 Figure CT12: Urban Development Scenarios – Light Vehicle Oil Consumption 160 140 120 BAU 100 80 60 MTOE Million Tonnes CO2 2020 Source: APERC Analysis (2012) Source: APERC Analysis (2012) BAU Scenario Fixed Urban Land 500 40 20 0 2010 2020 2035 Source: APERC Analysis (2012) High Sprawl Constant Density Fixed Urban
Land 2020 2035 12 10 8 6 4 2 0 2010 ALTERNATIVE URBAN DEVELOPMENT SCENARIOS Source: APERC Analysis (2012) Figure CT13 shows the change in light vehicle CO2 emissions under BAU and the three alternative urban development scenarios. The impact of urban planning on CO2 emissions is similar to the impact of urban planning on energy use, since there is no significant change in the mix of fuels used under any of these scenarios. Light vehicle CO2 emissions would be 18% higher in the High Sprawl scenario compared to the BAU scenario in 2035. They would To understand the impact of future urban development on the energy sector, three alternative urban development scenarios were developed: ‘High Sprawl’, ‘Constant Density’, and ‘Fixed Urban Land’. The assumptions behind these scenarios are discussed in Volume 1, Chapter 5. Figure CT11 shows the change in vehicle ownership under BAU and the three alternative 190 APEC Energy Demand and Supply Outlook – 5th Edition
Chinese Taipei be about 14% and 17% lower in the Constant Density and Fixed Urban Land scenarios respectively. Figure CT15: Virtual Clean Car Race – Light Vehicle Oil Consumption Figure CT13: Urban Development Scenarios – Light Vehicle Tank-to-Wheel CO2 Emissions BAU High Sprawl Constant Density 30 5 20 0 10 2010 2020 2035 Source: APERC Analysis (2012) 0 2010 2020 2035 Figure CT16 shows the change in light vehicle CO2 emissions under BAU and the four alternative vehicle scenarios. To allow for consistent comparisons, in the Electric Vehicle Transition and Hydrogen Vehicle Transition scenarios the change in CO2 emissions is defined as the change in emissions from electricity and hydrogen generation. The emissions impacts of each scenario may differ significantly from its oil consumption impact, since each alternative vehicle type uses a different fuel with a different level of emissions per unit of energy. Source: APERC Analysis (2012) VIRTUAL CLEAN CAR RACE To
understand the impact of vehicle technology on the energy sector, four alternative vehicle scenarios were developed: ‘Hyper Car Transition’ (ultra-light conventionally powered vehicles), ‘Electric Vehicle Transition’, ‘Hydrogen Vehicle Transition’, and ‘Natural Gas Vehicle Transition’. The assumptions behind these scenarios are discussed in Volume 1, Chapter 5. Figure CT16: Virtual Clean Car Race – Light Vehicle CO2 Emissions Figure CT14 shows the evolution of the vehicle fleet under BAU and the four ‘Virtual Clean Car Race’ scenarios. By 2035 the share of the alternative vehicles in the fleet reaches around 60% compared to about 14% in the BAU scenario. The share of conventional vehicles in the fleet is thus only about 40%, compared to about 86% in the BAU scenario. Million Tonnes CO2 BAU Electric Vehicle Transition Natural Gas Vehicle Transition Figure CT14: Virtual Clean Car Race – Share of Alternative Vehicles in the Light Vehicle Fleet BAU Electric
Vehicle Transition Natural Gas Vehicle Transition Share of Fleet Hyper Car Transition Hydrogen Vehicle Transition 10 Fixed Urban Land MTOE Million Tonnes CO2 40 BAU Electric Vehicle Transition Natural Gas Vehicle Transition Hyper Car Transition Hydrogen Vehicle Transition 40 20 0 2010 2020 2035 Source: APERC Analysis (2012) 80% In Chinese Taipei, the Hyper Car Transition scenario is the clear winner in terms of CO2 emission reductions, with an emissions reduction of 24% compared to BAU in 2035. The Electric Vehicle Transition scenario offers emission reductions of about 15%. The Electric Vehicle Transition scenario does not do as well as the Hyper Car Transition scenario in Chinese Taipei because in this economy coal-fired generation would be the marginal source for much of the additional electricity required by the electric vehicles. 60% 40% 20% 0% 2020 Hyper Car Transition Hydrogen Vehicle Transition 2035 Source: APERC Analysis (2012) Figure CT15 shows the
change in light vehicle oil consumption under BAU and the four alternative vehicle scenarios. Oil consumption drops by 39% in the Electric Vehicle Transition, Hydrogen Vehicle Transition, and Natural Gas Vehicle Transition scenarios compared to BAU by 2035. The drop is large as these alternative vehicles use no oil. Oil demand in the Hyper Car Transition scenario is also significantly reduced compared to BAU: down 25% by 2035even though these highly efficient vehicles still use oil. Under the Natural Gas Vehicle Transition scenario, 2035 emissions would be reduced by about 5%, reflecting the slightly lower carbon intensity of natural gas and the slightly higher efficiency of natural gas vehicles compared to conventional vehicles. The Hydrogen Vehicles Transition scenario 191 APEC Energy Demand and Supply Outlook – 5th Edition Chinese Taipei would have no reduction in emissions. This is mainly due to the way the hydrogen is assumed to be producedfrom steam methane reforming of
gas, a process that involves significant CO2 emissions. TPC (Taiwan Power Company) (2011), 2010 Taiwan Power Company Annual Report, www.taipowercomtw/ TRTC (Taipei Rapid Transit Corporation) (2012), “Traffic Statistics” website page, in Chinese, www.trtccomtw/ctasp?xItem=1366864&CtNo de=27643&mp=122031 REFERENCES AEC (Atomic Energy Council) (2012), Atomic Energy Annual Report – 2011, www.aecgovtw/www/service/other/files/annu al 100/index.html TTVMA (Taiwan Transportation Vehicle Manufacturers Association) (2012), “Vehicle Statistics” website page, in Chinese, www.ttvmaorgtw/cht/informationphp BOE (Bureau of Energy, of Chinese Taipei Ministry of Economic Affairs) (2012a), 2010 Energy Statistical Hand Book, www.moeaboegovtw/ –– (2012b), BOE Annual Report, 2010, www.moeaboegovtw/opengovinfo/Plan/all/en ergy year/main/EnergyYearMain.aspx?PageId= default –– (2012c), Framework of Taiwan’s Sustainable Energy Policy, www.moeaboegovtw/English/english indexas
px?Group=4 –– (2012d), New Energy Policy of Taiwan, www.moeaboegovtw/English/english indexas px?Group=4 –– (2012e), Petroleum Administration Law, law.mojgovtw/Eng/LawClass/LawAllaspx?PC ode=J0020019 CEPD (Council for Economic Planning and Development) (2012a), Population Projection for Chinese Taipei from 2012–2060, 2011, www.cepdgovtw/m1aspx?sNo=0000455 –– (2012b), Taiwan Statistical Data Book – 2011, Executive Yuan, Chinese Taipei, www.cepdgovtw/ Global Insight (2012), World Industry Services, retrieved from IHS Global Insight Data Service. IDB (Industrial Development Bureau, of Chinese Taipei Ministry of Economic Affairs) (2011), Major Indicators of Manufacturing Sector in 2009, www.moeaidbgovtw IEA (International Energy Agency) (2009), CO2 Emissions from Fuel Combustion2009 Edition. –– (2011), World Energy Statistics 2011, retrieved from OECD/IEA CD-ROM Service. MOTC (Ministry of Transportation and Communication, Chinese Taipei) (2012), 2010 Traffic Year Book,
www.motcgovtw/motchypage/hypagecgi?HYP AGE=yearbook.asp&mp=1 192