A doksi online olvasásához kérlek jelentkezz be!
A doksi online olvasásához kérlek jelentkezz be!
Nincs még értékelés. Legyél Te az első!
Legnépszerűbb doksik ebben a kategóriában


Tartalmi kivonat
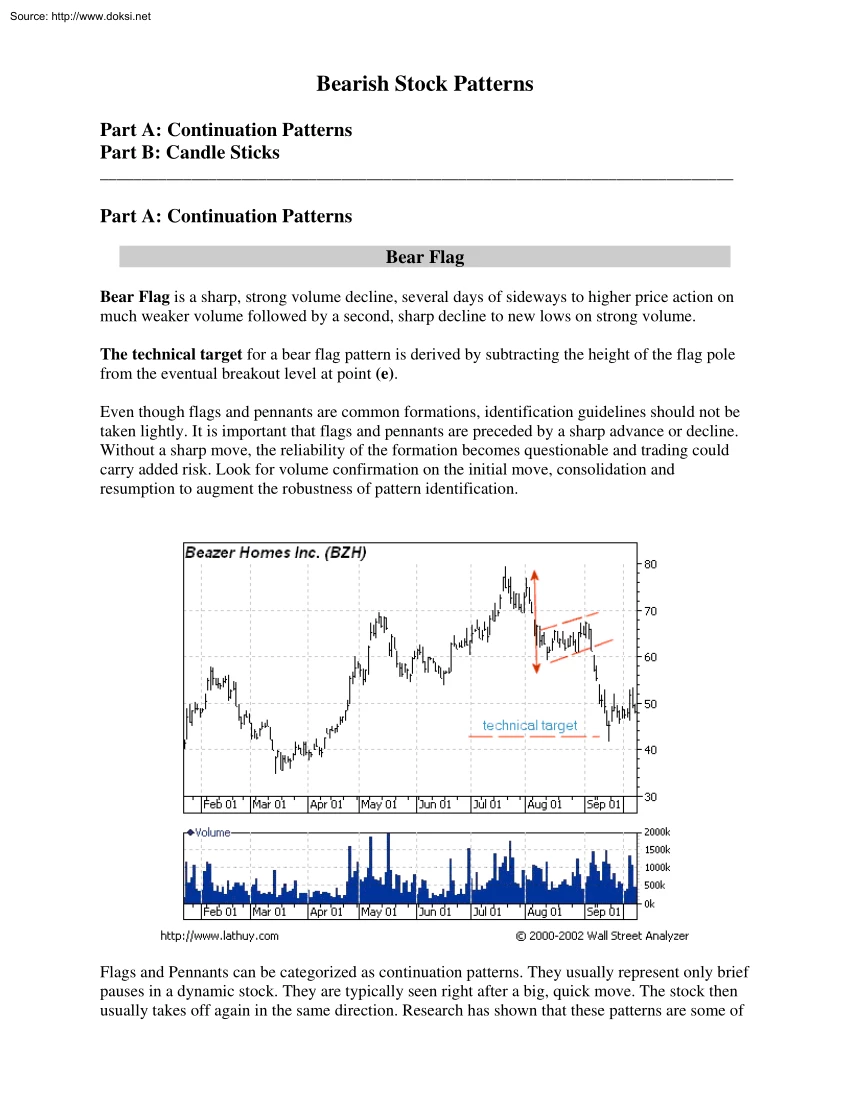
Source: http://www.doksinet Bearish Stock Patterns Part A: Continuation Patterns Part B: Candle Sticks Part A: Continuation Patterns Bear Flag Bear Flag is a sharp, strong volume decline, several days of sideways to higher price action on much weaker volume followed by a second, sharp decline to new lows on strong volume. The technical target for a bear flag pattern is derived by subtracting the height of the flag pole from the eventual breakout level at point (e). Even though flags and pennants are common formations, identification guidelines should not be taken lightly. It is important that flags and pennants are preceded by a sharp advance or decline Without a sharp move, the reliability of the formation becomes questionable and trading could carry added risk. Look for volume confirmation on the initial move, consolidation and resumption to augment the robustness of pattern identification. Flags and
Pennants can be categorized as continuation patterns. They usually represent only brief pauses in a dynamic stock. They are typically seen right after a big, quick move The stock then usually takes off again in the same direction. Research has shown that these patterns are some of Source: http://www.doksinet the most reliable continuation patterns Bearish flags are comprised of higher tops and higher bottoms. "Bear" flags also have a tendency to slope against the trend. Their trendlines run parallel as well • • • • • • • • Sharp Move: To be considered a continuation pattern, there should be evidence of a prior trend. Flags and pennants require evidence of a sharp advance or decline on heavy volume. These moves usually occur on heavy volume and can contain gaps. This move usually represents the first leg of a significant advance or decline and the flag/pennant is merely a pause. Flagpole: The flagpole is the distance from the first resistance or
support break to the high or low of the flag/pennant. The sharp advance (or decline) that forms the flagpole should break a trend line or resistance/support level. A line extending up from this break to the high of the flag/pennant forms the flagpole. Flag: A flag is a small rectangle pattern that slopes against the previous trend. If the previous move was up, then the flag would slope down. If the move was down, then the flag would slope up. Because flags are usually too short in duration to actually have reaction highs and lows, the price action just needs to be contained within two parallel trend lines. Pennant: A pennant is a small symmetrical triangle that begins wide and converges as the pattern matures (like a cone). The slope is usually neutral Sometimes there will not be specific reaction highs and lows from which to draw the trend lines and the price action should just be contained within the converging trend lines. Duration: Flags and pennants are short-term patterns that
can last from 1 to 12 weeks. Ideally, these patterns will form between 1 and 4 weeks Once a flag becomes more than 12 weeks old, it would be classified as a rectangle. A pennant more than 12 weeks old would turn into a symmetrical triangle. The reliability of patterns that fall between 8 and 12 weeks is debatable. Break: For a bullish flag or pennant, a break above resistance signals that the previous advance has resumed. For a bearish flag or pennant, a break below support signals that the previous decline has resumed. Volume: Volume should be heavy during the advance or decline that forms the flagpole. Heavy volume provides legitimacy for the sudden and sharp move that creates the flagpole. An expansion of volume on the resistance (support) break lends credence to the validity of the formation and the likelihood of continuation. Targets: The length of the flagpole can be applied to the resistance break or support break of the flag/pennant to estimate the advance or decline. Source:
http://www.doksinet Bearish Pennant Bearish Pennant is a sharp, strong volume decline on a negative fundamental development, several days of narrowing price consolidation on much weaker volume followed by a second, sharp decline to new lows on strong volume. The technical target for a bearish pennant pattern is derived by subtracting the height flag pole from the eventual breakout level at point (e). Pennants look very much like symmetrical triangles. But pennants are typically smaller in size (volatility) and duration. Volume generally contracts during the pause with an increase on the breakout. • • • Sharp Move: To be considered a continuation pattern, there should be evidence of a prior trend. Flags and pennants require evidence of a sharp advance or decline on heavy volume. These moves usually occur on heavy volume and can contain gaps. This move usually represents the first leg of a significant advance or decline and the flag/pennant is merely a pause. Flagpole: The
flagpole is the distance from the first resistance or support break to the high or low of the flag/pennant. The sharp advance (or decline) that forms the flagpole should break a trend line or resistance/support level. A line extending up from this break to the high of the flag/pennant forms the flagpole. Flag: A flag is a small rectangle pattern that slopes against the previous trend. If Source: http://www.doksinet • • • • • the previous move was up, then the flag would slope down. If the move was down, then the flag would slope up. Because flags are usually too short in duration to actually have reaction highs and lows, the price action just needs to be contained within two parallel trend lines. Pennant: A pennant is a small symmetrical triangle that begins wide and converges as the pattern matures (like a cone). The slope is usually neutral Sometimes there will not be specific reaction highs and lows from which to draw the trend lines and the price action should
just be contained within the converging trend lines. Duration: Flags and pennants are short-term patterns that can last from 1 to 12 weeks. Ideally, these patterns will form between 1 and 4 weeks Once a flag becomes more than 12 weeks old, it would be classified as a rectangle. A pennant more than 12 weeks old would turn into a symmetrical triangle. The reliability of patterns that fall between 8 and 12 weeks is debatable. Break: For a bullish flag or pennant, a break above resistance signals that the previous advance has resumed. For a bearish flag or pennant, a break below support signals that the previous decline has resumed. Volume: Volume should be heavy during the advance or decline that forms the flagpole. Heavy volume provides legitimacy for the sudden and sharp move that creates the flagpole. An expansion of volume on the resistance (support) break lends credence to the validity of the formation and the likelihood of continuation. Targets: The length of the flagpole can be
applied to the resistance break or support break of the flag/pennant to estimate the advance or decline. Descending Triangle Continuation Descending Triangle is a decline to a new low on news followed by a kick back rally to an intermediate resistance level, a second decline to test the recent low followed by a second rally toward but not through intermediate resistance and finally a decline to fresh new lows on strong volume. The technical target for a descending triangle is derived by measuring the vertical height of the triangle and applying this length to the new breakout level. The descending triangle is a bearish formation that usually forms during a downtrend as a continuation pattern. There are instances when descending triangles form as reversal patterns at the end of an uptrend, but they are typically continuation patterns. Regardless of where they form, descending triangles are bearish patterns that indicate distribution. For the descending triangle, the horizontal line
represents demand that prevents the security from declining past a certain level. It is as if a large buy order has been placed at this level and it is taking a number of weeks or months to execute, thus preventing the price from declining further. Even though the price does not decline past this level, the reaction highs continue to decline. It is these lower highs that indicate increased selling pressure and give the descending triangle its bearish bias. Source: http://www.doksinet Descending Triangle Because of its shape, the pattern can also be referred to as a right-angle triangle. • • • • • • Lower Horizontal Line: At least 2 reaction lows are required to form the lower horizontal line. The lows do not have to be exact, but should be within reasonable proximity of each other. There should be some distance separating the lows and a reaction high between them. Upper Descending Trend line: At least two reaction highs are required to form the upper descending trend
line. These reaction highs should be successively lower and there should be some distance between the highs. Duration: The length of the pattern can range from a few weeks to many months, with the average pattern lasting from 1-3 months. Volume: Confirmation is preferred but it is not always necessary. As the pattern develops, volume usually contracts. When the downside break occurs, there would ideally be an expansion of volume for confirmation. Return to Breakout: Sometimes there will be a return to breakout level (now newfound resistance) before the down move begins in earnest. Target: Once the breakout has occurred, the price projection is found by measuring the widest distance of the pattern and subtracting it from the resistance breakout. Source: http://www.doksinet Part B: Candle Sticks Understanding Candle Stick Charts: Bearish Candle Stick Patterns Bearish Engulfing Pattern A chart pattern that consists of a small white candlestick with short shadows or tails followed by
a large black candlestick that eclipses or "engulfs" the small white one. As implied by its name, a bearish engulfing pattern may provide an indication of a future bearish trend. This type of pattern usually accompanies an uptrend in a security, possibly signaling a peak or slowdown in its advancement. However, whenever a trader analyzes any candlestick pattern, it's important for him or her, before making any decisions, to consider the prices of the days that precede and follow the formation of the pattern. Bearish Harami A trend indicated by a large candlestick followed by a much smaller candlestick whose body is located within the vertical range of the larger candle's body. Such a pattern is an indication that the previous upward trend is coming to an end. Source: http://www.doksinet A bearish harami may be formed from a combination of a large white or black candlestick, and a smaller white or black candlestick. The smaller the second candlestick, the more
likely the reversal. It is thought to be a strong sign that a trend is ending when a large white candle stick is followed by a small black candlestick. Blow-Off Top A steep and rapid increase in price followed by a steep and rapid drop in price. The rapid increase can be a result of either actual news or simply a wild rumor. Blowoff A term in technical analysis that refers to a sharp price increase that comes after a long period of price appreciation, and is followed by a fall in the price. A blowoff is seen as a rally's last breath and is a highly bearish sign. This large and dramatic price movement is generally seen at the peak of a market. The idea behind the bearishness of a blowoff is that it signals the activity of the most irrational and overly exuberant market participants, who, wanting to take part in the rally, momentarily push up the already-overvalued market. Head and Shoulders Breakdown A price movement through an identified level of support, Source:
http://www.doksinet which is usually followed by heavy volume and sharp declines. Technical traders will short sell the underlying asset when the price of the security breaks below a support level because it is a clear indication that the bears are in control and that additional selling pressure is likely to follow. Technical tools such as moving averages, trendlines and chart patterns are the most common methods for technical traders to identify strong areas of support. The chart above shows that a trader will enter into a short position when the price breaks below an area of support (the thick dark line), which has been identified by using a head and shoulders chart pattern. A breakdown is the bearish counterpart of a breakout