A doksi online olvasásához kérlek jelentkezz be!
A doksi online olvasásához kérlek jelentkezz be!
Nincs még értékelés. Legyél Te az első!
Legnépszerűbb doksik ebben a kategóriában


Tartalmi kivonat
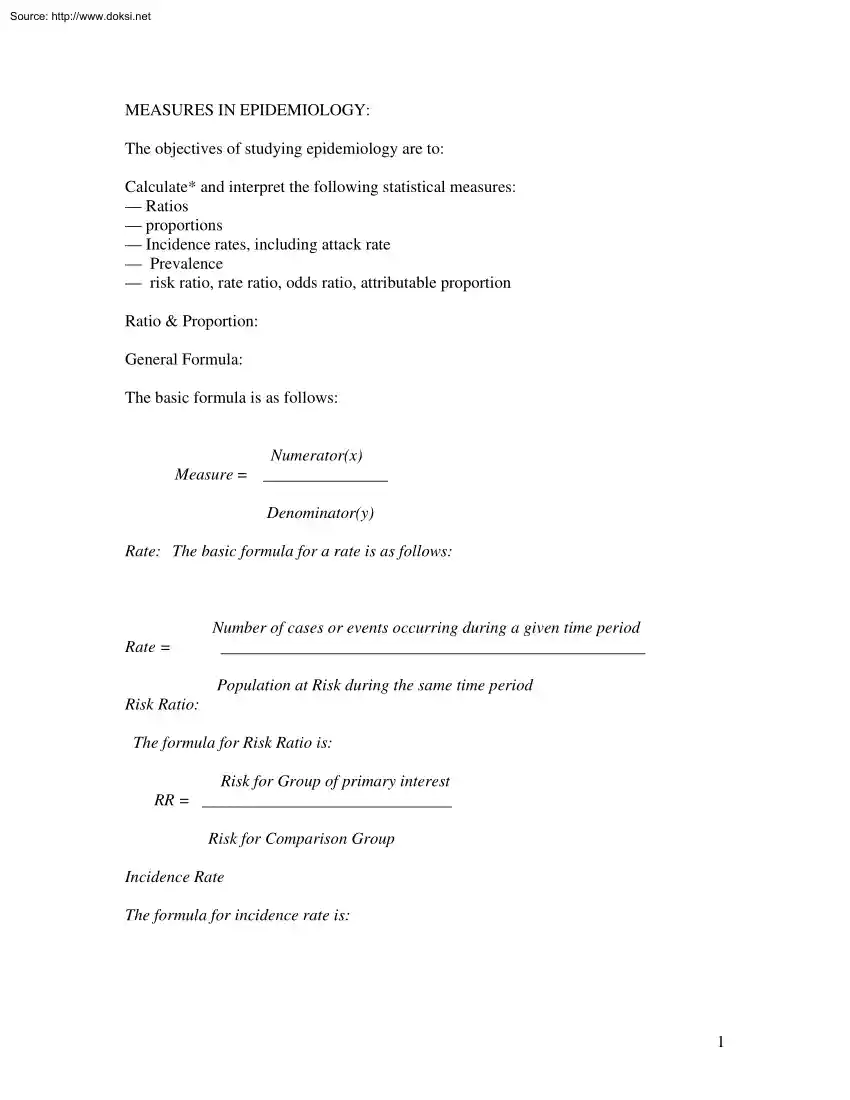
Source: http://www.doksinet MEASURES IN EPIDEMIOLOGY: The objectives of studying epidemiology are to: Calculate* and interpret the following statistical measures: Ratios proportions Incidence rates, including attack rate Prevalence risk ratio, rate ratio, odds ratio, attributable proportion Ratio & Proportion: General Formula: The basic formula is as follows: Measure = Numerator(x) Denominator(y) Rate: The basic formula for a rate is as follows: Rate = Number of cases or events occurring during a given time period Population at Risk during the same time period Risk Ratio: The formula for Risk Ratio is: Risk for Group of primary interest RR = Risk for Comparison Group Incidence Rate The formula for incidence rate is: 1 Source: http://www.doksinet IR = # new cases of a specified disease reported during a given time interval
Average population during time interval Attack Rate The formula for attack rate is: AR = # new cases of a specified diseases reported during an epidemic period Population at start of The epidemic period Example: during the first 9 month of national surveillance for poliomyelitis CDC received 1.068 cases reports which specified sex; 893 cases were in females, 175 in males How to calculate the female –to male ratio for polio. 1. define x and y: x= cases in females y= cases in males 2. Identify x and y: x= 893 Y= 175 3. Set up the ratio: x/y = 893/175 4. Reduce the fraction so that either x 0r y equals 1: 893/175=51 to 1 Thus there were just over 5 female polio patients for each male polio patient reported to CDC. Descriptive epidemiology deals with the questions: Who, What, When, and Where. Descriptive epidemiology describes the occurrence of disease in a population. Analytic epidemiology deals with the remaining
questions: Why and How. Analytic epidemiology compares one group of people to another group of people to help determine the cause of a disease. Epidemiologists use analytic methods to help identify the cause of disease. The results of descriptive epidemiology may present some questions as how or why disease is occurring in certain population groups. Identifying the cause of disease in groups typically involves designing a study to test the hypotheses that were developed using descriptive epidemiology. 2 Source: http://www.doksinet The hypothesis in an epidemiologic study explores the relationship between two main factors: an exposure and an outcome. Exposure refers to any factor that might influence one’s risk of disease – this could be a virus, a pollutant, genetics, or many other things. Outcome refers to the disease in question, which is standardized by a case definition. A hypothesis: is an educated guess about an association between an exposure and an outcome that can be
tested in a scientific investigation. To develop a hypothesis, we have to have some information on which to base our educated guesses. Descriptive data provide information that can be used to develop hypotheses. Hypotheses tend to be broad initially, when less is known about what is causing a disease or health event, and they are then refined to have a narrower focus. Example • Hypothesis: People who ate at the church picnic were more likely to become ill – Exposure is eating at the church picnic – Outcome is illness – this would need to be defined, for example, ill persons are those who have diarrhea and fever • Hypothesis: People who ate the egg salad at the church picnic were more likely to have laboratory-confirmed Salmonella – Exposure is eating egg salad at the church picnic – Outcome is laboratory confirmation of Salmonella When we set out to test a hypothesis, there are several types of studies that we can choose from. These studies fall into two main categories:
Experimental studies and observational studies. In experimental studies, the investigators conducting the study assign the exposure to the study participants. In observational studies, the exposure status is not assigned – the exposures that are already occurring are measured and observed by the investigators. Some examples of a case–control study design are listed here. A study may assess whether or not members of a population have autism, and then determine whether the cases with autism had a certain vaccination more often than the controls. A study of lung cancer may seek to determine if lung cancer patients in a population had more exposure to radon in the past than members of the population without lung cancer. An outbreak of salmonella may be investigated by determining whether salmonella cases ate at a particular fast-food restaurant more than controls that do not have salmonella infection. 3 Source: http://www.doksinet 4
 Mária Terézia Bécsben született 1717. május 3-án. Habsburg-házból származó osztrák uralkodó főhercegnő, 1740–1780 között magyar és cseh királynő, I. Ferenc német-római császár felesége, a Habsburg-Lotharingiai-ház ősanyja. [1]Édesapja VI. Károly német-római császár – III. Károly néven magyar király – a Habsburg-ház utolsó férfi