A doksi online olvasásához kérlek jelentkezz be!
A doksi online olvasásához kérlek jelentkezz be!
Nincs még értékelés. Legyél Te az első!
Legnépszerűbb doksik ebben a kategóriában


Tartalmi kivonat
Source: http://www.doksinet MACD Plays The most important observation to make on a stock you are considering for investment is whether it exhibits a tendency to trend. Being able to identify those stocks will make you much more successful in your investing. It's far easier to make money in stocks that trend than in stocks that fluctuate up and down. Moving Average Convergence Divergence (MACD) An important observation to make on a stock you are considering for investment is whether it exhibits a tendency to trend. Being able to identify those stocks will make you much more successful in your investing. Many market technicians believe that it is easier to make money in stocks that trend than in stocks that fluctuate up and down. The price action of a stock can generally be categorized as either trending (moving generally up or down) or range bound (sideways). Trending stocks are going somewhere in a vertical direction, while range-bound stocks travel in a horizontal direction. A
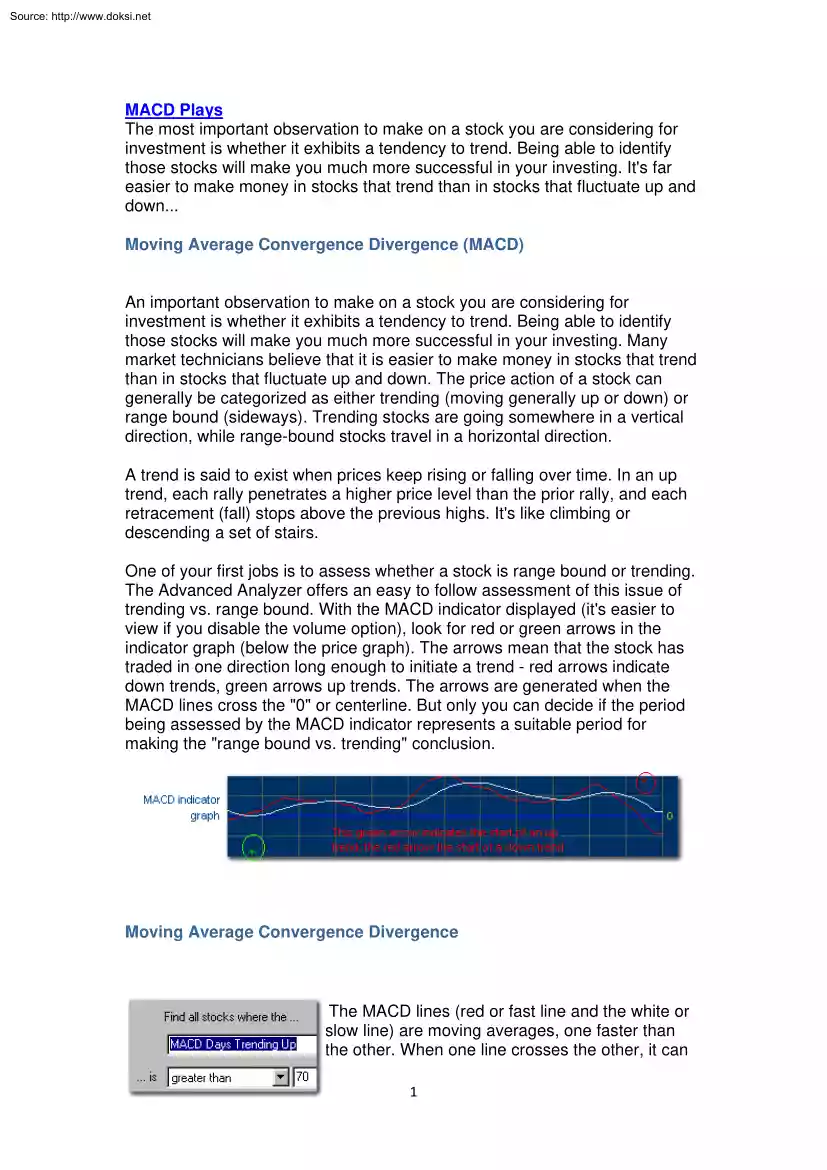
trend is said to exist when prices keep rising or falling over time. In an up trend, each rally penetrates a higher price level than the prior rally, and each retracement (fall) stops above the previous highs. It's like climbing or descending a set of stairs. One of your first jobs is to assess whether a stock is range bound or trending. The Advanced Analyzer offers an easy to follow assessment of this issue of trending vs. range bound With the MACD indicator displayed (it's easier to view if you disable the volume option), look for red or green arrows in the indicator graph (below the price graph). The arrows mean that the stock has traded in one direction long enough to initiate a trend - red arrows indicate down trends, green arrows up trends. The arrows are generated when the MACD lines cross the "0" or centerline. But only you can decide if the period being assessed by the MACD indicator represents a suitable period for making the "range bound vs.
trending" conclusion Moving Average Convergence Divergence The MACD lines (red or fast line and the white or slow line) are moving averages, one faster than the other. When one line crosses the other, it can 1 Source: http://www.doksinet represent the earliest indication of a possible change in trend. However, the MACD lines cross over each other frequently as they try to establish the trend, so it's often best to wait for a stronger confirmation. When the lines cross over the centerline, it indicates that a trend has been established and may be sustained for some time, according to Gerald Appel, the inventor of the MACD indicator. The longer the MACD lines stay above the centerline (below for bearish conditions) the more likely the trend may be sustained according to the MACD analysis. Many market technicians consider it easier to make money when a stock is prone to trending. The Advanced Analyzer not only shows you on the price chart when and how much a stock trends,
it tells you how often a stock trends up or down. Under the MACD screening category there are options for finding stocks that trend a percentage of days up or down according to the MACD parameters. This is an incredibly powerful tool To find stocks with a history of up trend simply screen for MACD Days Trending Up more than 70 and you'll find a list of stocks that meet these parameters. To find stocks trending down screen for MACD Days Trending Down more than 70. This simple tool, if you learn to use it well, could be one of the most reliable arrows in your quiver. Entry and Exit Points for the MACD Cross Up at Center Play The idea behind the Cross Up at Center play is finding stocks where a potential new up trend has been identified. This happens when the MACD line crosses up through the centerline. There's no guarantee a stock will keep ascending - in fact, you'll likely want to add more criteria to whittle down your prospects. But as triggers and indications go, this
is a good one, especially with increasing volume. Potential Entry Points Consider screening for stocks with the MACD line crossing up through the centerline, with average trading volume of at least 100,000, and with today's trading volume 100% or more than the one-month average volume. Gerald Appel who created the MACD indicator advises investors to look for MACD patterns that have started to reverse after a downtrend. MACD patterns that vacillate near the centerline may not be as favorable, as they are more likely to be range bound. Potential Exit Points For the trend to end, the MACD lines must penetrate the centerline and start tracing below it in negative ground, states Appel. You may want to wait for the MACD lines to dip below the centerline before getting completely out. Alternatively, you might want to set Alerts for bearish crossings of the 10- and 50-Day Moving Average lines and evaluate at each event. 2 Source: http://www.doksinet Charting Example for the MACD Cross
Up at Center Play Mark IV Industries (IV) is a good candidate for this play and illustrates a strong reversal opportunity in the period shown. IV came off a serious pullback of more than 30%. Notice how the MACD lines dipped well below the centerline and then moved back up through the centerline with good strength. Entry and Exit Points for MACD Days Trending Up Play Stocks in this screen may be the safest plays because they tend to trend. That may sound too simplistic, but it is probably the most important trend, and as stated before, technicians say it's far easier to make money with stocks that trend, as opposed to those that do not. These stocks can be good short-term plays as well as long-term plays. Potential Entry Points Screen for stocks with MACD Days Trending Up rating of 70 or better, averaging a six-month trading volume of at least 100,000. You may find a buying opportunity with some of these stocks as they come down to touch their 10-Day Moving Average line for
support. 3 Source: http://www.doksinet Potential Exit Points As these stocks have proven their ability to sustain a trend, you may want to give them room to stretch out and run by waiting for the MACD to cross down through the centerline as your exit signal. If you prefer the chance for a quicker profit (but likely smaller), keep a tighter exit with a trailing stop loss order to lock in your gains. Charting Example for MACD Days trending Up Play Ascend (ASND) is a great example of the MACD Days Trending Up play during the period covered. The MACD lines cross and stay strongly above the centerline and cement together underscoring the strength of the trend. ASND lightly tests its 10-Day Moving Average but keeps ascending. Entry and Exit Points for the MACD Bull! Bull! Bull! Play Stocks in this play have been moving up consistently over the past two weeks or more. This screen is a home brew of four very strong screening criteria, with the foundation being a strong MACD rating.
William O'Neil, publisher of Investor' Business Daily, loves these stocks. His mantra is "buy high, sell higher." A caution with these stocks is that some of them may be in a short-term overbought state, so 4 Source: http://www.doksinet look for additional confirmations (strong volume, industry support, no MACD Histogram divergence, etc.) to support a further advance Potential Entry Points Screen for stocks with bullish ratings for MACD, 10-Day Moving Average (MA), 50-Day MA, today's volume at least 100% greater than the average six month volume, MACD fast over slow, and an STA $.50 Bull of at least 50 The STA $.50 Bull criteria is an added zinger stipulating the stock must be moving up half a buck half the time. Potential Exit Points These plays are either going to top out soon or keep going. To maximize your potential of participating in any further run ups, consider setting a stop loss a safe distance behind the stock's current average daily trading
range (find this in the technical indicators pane) and trail it along if the stock climbs. The actual price set for the stop loss should be dependent on your risk tolerance. Charting Example for the MACD Bull! Bull! Bull! Play Airtouch Communications (ATI) is a good example chart for the Bull! Bull! Bull! Play. The MACD lines are well above the centerline and are very close together, underscoring the steady upward climb. If possible, find charts like this but a bit sooner in the ascent. 5 Source: http://www.doksinet Entry and Exit Points for the MACD Bear! Bear! Bear! Play Stocks in this screen are good shorting candidates because the screen indicates they will likely experience a future downward trend. The foundation of the screen is the MACD Trending Days Down criteria. This finds stocks that have started down and tend to keep trending down. Points to remember when shorting: short only stocks with good liquidity; short stocks that have something left to give up (above $10);
watch your stock's behavior as it approaches previous support levels - there's always the chance it could find support and bounce up. Potential Entry Points Screen for stocks with bearish ratings for MACD, 10-Day MA, 50-Day MA, average six month trading volume of at least 100,000, closing price of $10 or more, and MACD Days Trending Down greater than 70. If you need that extra value edge, wait for the stock to test a trendline, and then take your short position. Potential Exit Points Before shorting, consider your risk tolerance. Theoretically shorting involves an infinite risk because there is no limit if a stock rises against your short. The talent you need to develop for shorting is knowing when to recover, or buy back, the shares you sold when you opened the position. As mentioned above, previous support levels should be on your radar. If the stock is breaking out into new lows, set an Alert for a crossing up of the 1-Day MA line. Or just get out when you're happy
with the trade and move on Charting Example for the MACD Bear! Bear! Bear! Play Hercules (HPC) illustrates a good MACD Bear! Bear! Bear! Play during the period. The MACD lines have a long down trend, and the stock is no match for its own 50 and 10-Day Moving Average lines. 6 Source: http://www.doksinet Summary • • • • Market technicians claim it should be easier and safer to make money in stocks that trend A cross at the centerline - up or down is a good trend signal MACD lines that cement and cling to each other underscore the continuation of the trend To find stocks that like to trend, use the Days Trending criteria 7
 Írásunkban a műelemzések készítésének módszertanát járjuk körül. Foglalkozunk az elemzés főbb fajtáival, szempontjaival és tanácsokat adunk az elemzés legfontosabb tartalmi elemeivel kapcsolatban is. Módszertani útmutatónk főként tanulók számára készült!