A doksi online olvasásához kérlek jelentkezz be!
A doksi online olvasásához kérlek jelentkezz be!
Nincs még értékelés. Legyél Te az első!
Legnépszerűbb doksik ebben a kategóriában


Tartalmi kivonat
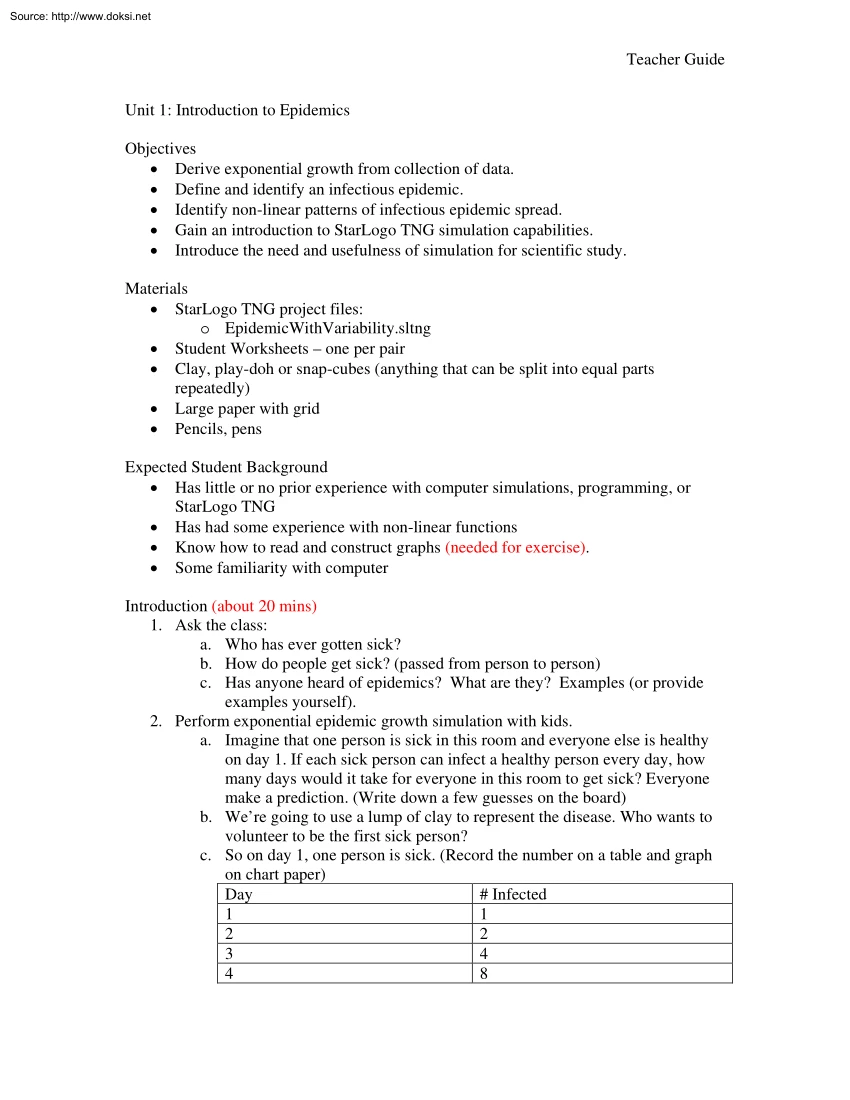
Source: http://www.doksinet Teacher Guide Unit 1: Introduction to Epidemics Objectives • Derive exponential growth from collection of data. • Define and identify an infectious epidemic. • Identify non-linear patterns of infectious epidemic spread. • Gain an introduction to StarLogo TNG simulation capabilities. • Introduce the need and usefulness of simulation for scientific study. Materials • StarLogo TNG project files: o EpidemicWithVariability.sltng • Student Worksheets – one per pair • Clay, play-doh or snap-cubes (anything that can be split into equal parts repeatedly) • Large paper with grid • Pencils, pens Expected Student Background • Has little or no prior experience with computer simulations, programming, or StarLogo TNG • Has had some experience with non-linear functions • Know how to read and construct graphs (needed for exercise). • Some familiarity with computer Introduction (about 20 mins) 1. Ask the class: a. Who has ever gotten sick? b.
How do people get sick? (passed from person to person) c. Has anyone heard of epidemics? What are they? Examples (or provide examples yourself). 2. Perform exponential epidemic growth simulation with kids a. Imagine that one person is sick in this room and everyone else is healthy on day 1. If each sick person can infect a healthy person every day, how many days would it take for everyone in this room to get sick? Everyone make a prediction. (Write down a few guesses on the board) b. We’re going to use a lump of clay to represent the disease Who wants to volunteer to be the first sick person? c. So on day 1, one person is sick (Record the number on a table and graph on chart paper) Day # Infected 1 1 2 2 3 4 4 8 Source: http://www.doksinet Teacher Guide d. Day 2 Ask student to split clay and give the other half to another student Record the total number infected on the table and plot the data point on the graph. Announce the next day Repeat this step until all students have been
infected. e. Once the simulation is complete, discuss with students what kind of growth or pattern they observe happening (exponential growth). i. How would you describe this pattern? ii. How can you find out how many people will be sick after 10 days? (students may need help seeing the exponential relationship Infected = 2days) 3. (Optional) Perform epidemic recovery simulation with kids a. What’s unrealistic about the simulation that we just did? (in real life, people recover after being sick for some time) b. How do you think that the data from the first simulation will change if people get better after some period of time? Assume that when a person recovers from being sick, that person can get infected 3 again. c. Depending on the number of students participating, select 2 the number of “turns” it’ll take for an infected student to 1 recover. A good number would be (log 2 n)/2 Hand out 0 that number of linked blocks to each student. Alternatively, hand out a bunch of index
cards and have each student hold the index card vertically and write the recovery time on top, counting down to 0. See example on the right: d. Give one student the clay or set of blocks This student is now “infected” and takes an index w/ the recovery time count down written on it. Record day 1 data on the table and plot the point on the graph. e. During each “day,” i. Each sick student splits his/her clay and gives half to a healthy student to infect him/her. ii. Each sick person breaks off a block or crosses off the previous recovery time. If they have no more blocks or the number is zero on their index card, they’re healthy and should return the clay to the teacher or give it to someone who’s still sick. iii. All previously sick people who’ve recovered are eligible to be infected again. iv. Record the total number of students infected using a table and graph the data. f. Repeat each cycle until almost all the students have become infected g. Once the simulation is
complete, discuss with the students what kind of growth or pattern they observe happening. (Grows rapidly but fluctuates at a certain point.) Source: http://www.doksinet Teacher Guide 4. 5. 6. 7. 8. h. NOTE: Go through each step of the simulation together with the students and make sure everyone has completed the step before moving onto the next. Ask student, what do you think will happen to the data/graph if people take more time to recover from a disease? If people take less time to recover from a disease? Take some ideas and move onto the EpidemicWithVariability TNG simulation. Show with no recovery first and show the exponential growth in the graph. Show with recovery and show similar growth in graph. Vary recovery and introduce students to the next exercise. NOTE: TNG simulation cannot match people simulation exactly because disease does not transmit perfectly in TNG like in the people simulation, although it will not be noticeable. Before sending students to computers,
review the basic interfaces and controls of TNG: the palette (where blocks are stored), canvas (where block coding happens), SpaceLand (the 3D world where agents reside), and the Runtime Workspace (the black space underneath SpaceLand that holds buttons to control the simulation. Infectious Disease Spread Exercise (about 30 mins) 1. Explain exercise to students: Students will determine what makes an outbreak of a disease an Epidemic. Students will explore different events where an infectious disease occurs and analyze graph data. 2. Explain to the students that they will be working with two kinds of diseases: one that we’ve already experienced in the participatory simulations, where it infects people on contact but people can recover after some time. However, after recovering, people can become sick again. Students will also explore a disesase where after recovering, they become immune, or they can no longer become sick from the disease, like Chickenpox. 3. Hand out student
worksheets and go over instructions (written on student worksheet) before students do exercise in front of computer. May want to go over first scenario together so students understand the mechanics of exercise. a. For each scenario, students will vary the recovery time for a constant population. After reading each scenario, students will make a prediction before running simulation. They’ll express their prediction or hypothesis first in words and then as a sketch of a line graph. One scenario will have a disease where agents will become 100% immune after recovering from the disease. 4. Ask students to pair up and then explain the Navigator/Driver roles: a. Explain Navigator/Driver roles: i. Driver: controls the mouse and keyboard ii. Navigator: tells the Driver what to do on the computer a. Students should switch roles every once in a while Wrap-Up/Discussion (about 5-10 mins) 1. Based on your observations, which scenarios did you think were epidemics? How would you define
“epidemic”? Source: http://www.doksinet Teacher Guide 2. Does this model reflect the real world? How so? Or Why not? 3. How could we make this model more real? 4. If time, share answers from bonus scenario Discuss possible factors that caused slow spread of disease