A doksi online olvasásához kérlek jelentkezz be!

A doksi online olvasásához kérlek jelentkezz be!
Nincs még értékelés. Legyél Te az első!
Mit olvastak a többiek, ha ezzel végeztek?
Tartalmi kivonat
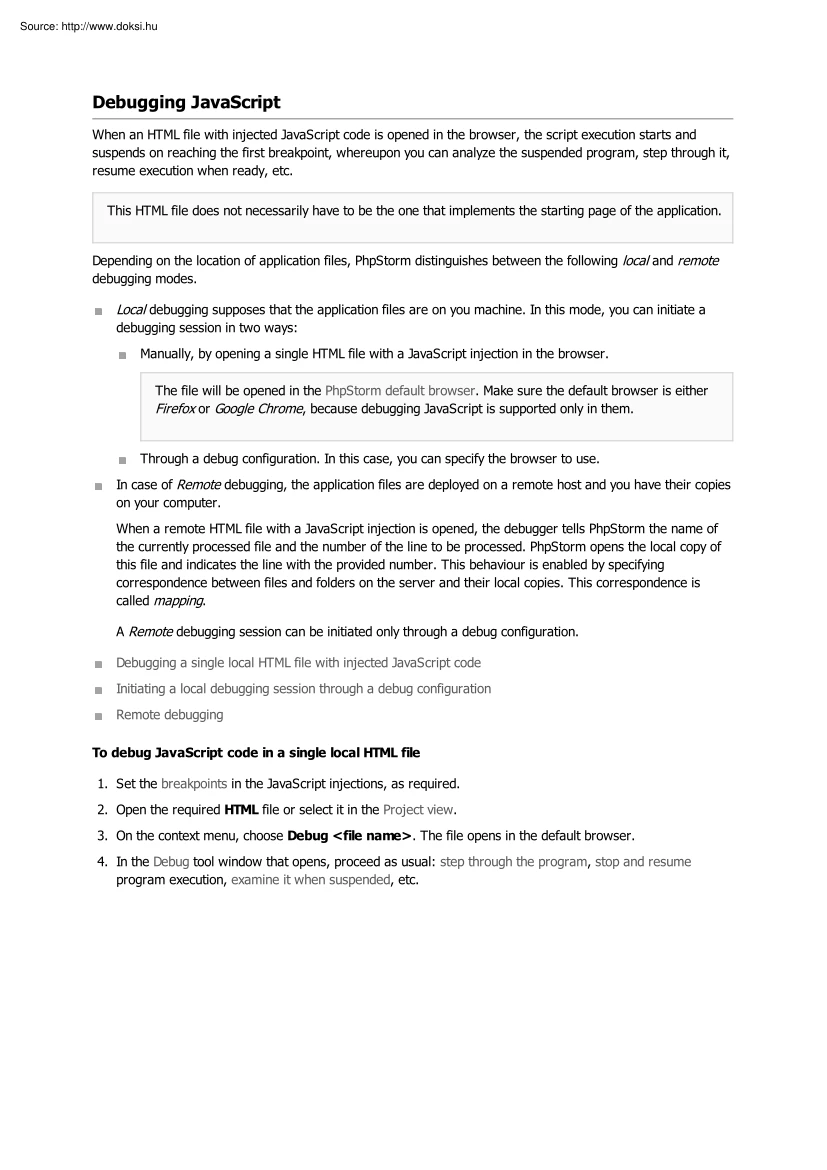
Debugging JavaScript When an HTML file with injected JavaScript code is opened in the browser, the script execution starts and suspends on reaching the first breakpoint, whereupon you can analyze the suspended program, step through it, resume execution when ready, etc. This HTML file does not necessarily have to be the one that implements the starting page of the application. Depending on the location of application files, PhpStorm distinguishes between the following local and remote debugging modes. Local debugging supposes that the application files are on you machine. In this mode, you can initiate a debugging session in two ways: Manually, by opening a single HTML file with a JavaScript injection in the browser. The file will be opened in the PhpStorm default browser. Make sure the default browser is either Firefox or Google Chrome, because debugging JavaScript is supported only in them. Through a debug configuration. In this case, you can specify the browser to use In case of
Remote debugging, the application files are deployed on a remote host and you have their copies on your computer. When a remote HTML file with a JavaScript injection is opened, the debugger tells PhpStorm the name of the currently processed file and the number of the line to be processed. PhpStorm opens the local copy of this file and indicates the line with the provided number. This behaviour is enabled by specifying correspondence between files and folders on the server and their local copies. This correspondence is called mapping. A Remote debugging session can be initiated only through a debug configuration. Debugging a single local HTML file with injected JavaScript code Initiating a local debugging session through a debug configuration Remote debugging To debug JavaScript code in a single local HTML file 1. Set the breakpoints in the JavaScript injections, as required 2. Open the required HTML file or select it in the Project view 3. On the context menu, choose Debug <file
name> The file opens in the default browser 4. In the Debug tool window that opens, proceed as usual: step through the program, stop and resume program execution, examine it when suspended, etc. To initiate a local debugging session through a debug configuration 1. Set the breakpoints in the JavaScript injections, as required 2. Create a debug configuration of the type JavaScript Debug - Local 1. On the main menu, choose Run | Edit Configurations 2. Click the Add New Configuration toolbar button , and choose JavaScript Debug - Local on the context menu. 3. In the Run/Debug Configuration: JavaScript Debug dialog box that opens, specify the full path to the HTML file that implements the page to start debugging from. Choose the browser to debug the application in (Firefox or Google Chrome). Click OK to save the configuration settings 3. Choose Run | Debug on the main menu, or click the Debug button on the toolbar, or press Shift+F9 The specified starting HTML file opens in the
default browser. 4. In the Debug tool window that opens, proceed as usual: step through the program, stop and resume program execution, examine it when suspended, etc. To debug a remote application with JavaScript injections 1. Synchronize with the server where the target application is deployed Interaction with servers is supported through the Remote Hosts Access bundled plugin, which is by default enabled. If not, activate it in the Plugins page of the Settings dialog box 1. Configure access to the server and to the application files 2. Configure the synchronization 3. Download the application files 2. Set the breakpoints in the JavaScript injections, as required 3. Create a debug configuration of the type JavaScript Debug - Remote 1. On the main menu, choose Run | Edit Configurations 2. Click the Add New Configuration toolbar button , and choose JavaScript Debug - Remote on the context menu. 3. In the Run/Debug Configuration: JavaScript Debug dialog box that opens, choose the
browser to debug the application in (Firefox or Google Chrome). In the URL to open text box, type the URL address of the page to start debugging from. Set correspondence between files on the server and their local copies by mapping paths to local files to URL addresses of files on the server. You can specify URL addresses in the absolute form (http://<host>:<port>/<path to server root>/<path to file>) or relative to the server root URL (/<path to file>). Click OK to save the configuration settings. 4. Choose Run | Debug on the main menu, or click Debug button on the toolbar, or press Shift+F9 The specified starting HTML file opens in the default browser. 5. In the Debug tool window that opens, proceed as usual: step through the program, stop and resume program execution, examine it when suspended, etc


