A doksi online olvasásához kérlek jelentkezz be!

A doksi online olvasásához kérlek jelentkezz be!
Nincs még értékelés. Legyél Te az első!
Mit olvastak a többiek, ha ezzel végeztek?
Tartalmi kivonat
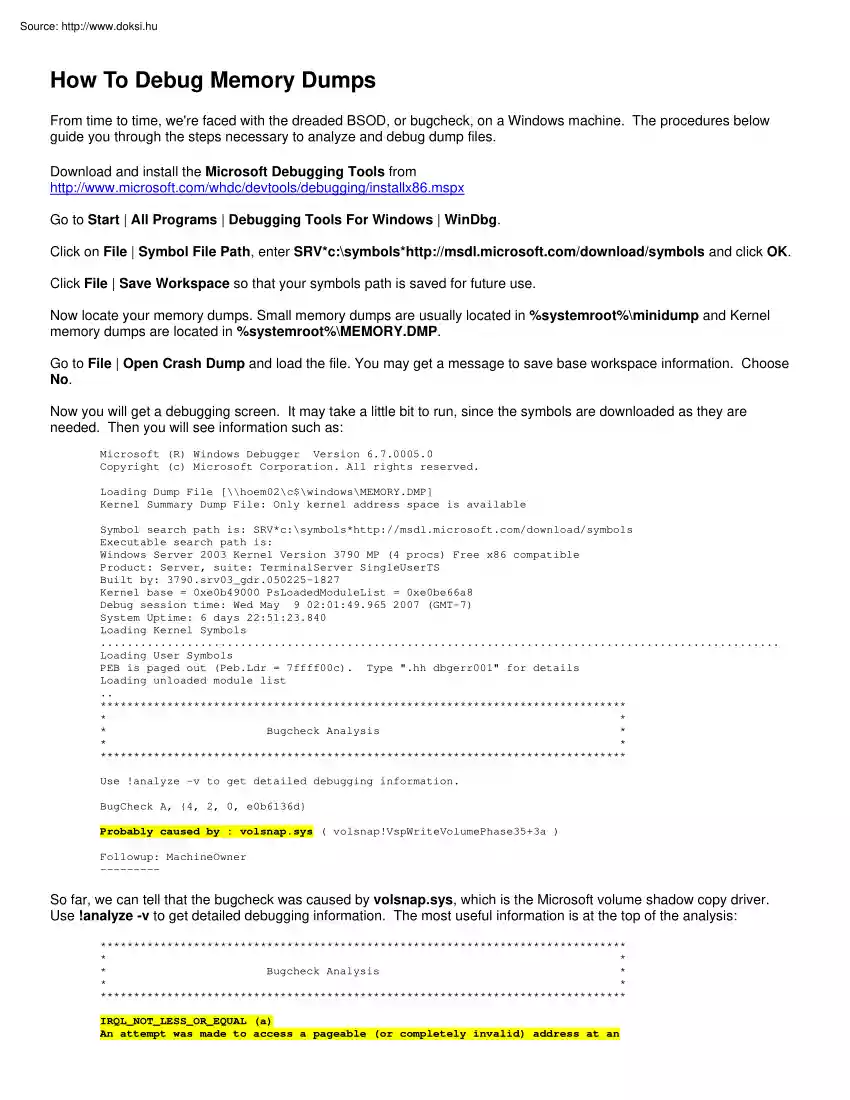
How To Debug Memory Dumps From time to time, we're faced with the dreaded BSOD, or bugcheck, on a Windows machine. The procedures below guide you through the steps necessary to analyze and debug dump files. Download and install the Microsoft Debugging Tools from http://www.microsoftcom/whdc/devtools/debugging/installx86mspx Go to Start | All Programs | Debugging Tools For Windows | WinDbg. Click on File | Symbol File Path, enter SRV*c:symbolshttp://msdl.microsoftcom/download/symbols and click OK Click File | Save Workspace so that your symbols path is saved for future use. Now locate your memory dumps. Small memory dumps are usually located in %systemroot%minidump and Kernel memory dumps are located in %systemroot%MEMORY.DMP Go to File | Open Crash Dump and load the file. You may get a message to save base workspace information Choose No. Now you will get a debugging screen. It may take a little bit to run, since the symbols are downloaded as they are needed. Then you will see
information such as: Microsoft (R) Windows Debugger Version 6.700050 Copyright (c) Microsoft Corporation. All rights reserved Loading Dump File [\hoem02c$windowsMEMORY.DMP] Kernel Summary Dump File: Only kernel address space is available Symbol search path is: SRV*c:symbolshttp://msdl.microsoftcom/download/symbols Executable search path is: Windows Server 2003 Kernel Version 3790 MP (4 procs) Free x86 compatible Product: Server, suite: TerminalServer SingleUserTS Built by: 3790.srv03 gdr050225-1827 Kernel base = 0xe0b49000 PsLoadedModuleList = 0xe0be66a8 Debug session time: Wed May 9 02:01:49.965 2007 (GMT-7) System Uptime: 6 days 22:51:23.840 Loading Kernel Symbols . Loading User Symbols PEB is paged out (Peb.Ldr = 7ffff00c) Type "hh dbgerr001" for details Loading unloaded module list . * * * * Bugcheck Analysis * * * * Use !analyze -v to get detailed debugging information. BugCheck A, {4, 2, 0, e0b6136d} Probably caused by : volsnap.sys ( volsnap!VspWriteVolumePhase35+3a )
Followup: MachineOwner --------- So far, we can tell that the bugcheck was caused by volsnap.sys, which is the Microsoft volume shadow copy driver Use !analyze -v to get detailed debugging information. The most useful information is at the top of the analysis: * * * * Bugcheck Analysis * * * * IRQL NOT LESS OR EQUAL (a) An attempt was made to access a pageable (or completely invalid) address at an interrupt request level (IRQL) that is too high. This is usually caused by drivers using improper addresses. If a kernel debugger is available get the stack backtrace. Arguments: Arg1: 00000004, memory referenced Arg2: 00000002, IRQL Arg3: 00000000, value 0 = read operation, 1 = write operation Arg4: e0b6136d, address which referenced memory From here, we can tell that volsnap.sys tried to read memory from an IRQL that was too high This is usually caused by a bad driver, in this case, volsnap.sys Next, let's find out what process was calling volsnap.sys Enter !thread in the kd>
command line input box and look for the line that begins with Owning Process: 2: kd> !thread THREAD faa03658 Cid 0568.1954 Teb: 7ffac000 Win32Thread: 00000000 RUNNING on processor 2 Not impersonating DeviceMap e1003978 Owning Process fc1913b0 Image: cvd.exe Wait Start TickCount 38443765 Ticks: 0 Now enter !process fc1913b0 0 (the hex number of the Owning Process) , a space and the number 0. 2: kd> !process fc1913b0 0 PROCESS fc1913b0 SessionId: 0 Cid: 0568 Peb: 7ffff000 ParentCid: 0218 DirBase: dd4a3000 ObjectTable: e141a910 HandleCount: 475. Image: cvd.exe We can now tell that the cvd.exe process (in this case, Commvault) called the volsnapsys driver Since volsnapsys is a Microsoft driver, a quick check on TechNet reveals that there is an updated VSS package available for our server (http://support.microsoftcom/kb/887827) which addresses the problem Note: Writing debugging information must be configured on the machine prior to the BSOD in order to get a memory dump. This is
done in the Advanced tab of system properties Set it to "Kernel memory dump" in order to get the process information


