A doksi online olvasásához kérlek jelentkezz be!
A doksi online olvasásához kérlek jelentkezz be!
Nincs még értékelés. Legyél Te az első!
Legnépszerűbb doksik ebben a kategóriában


Tartalmi kivonat
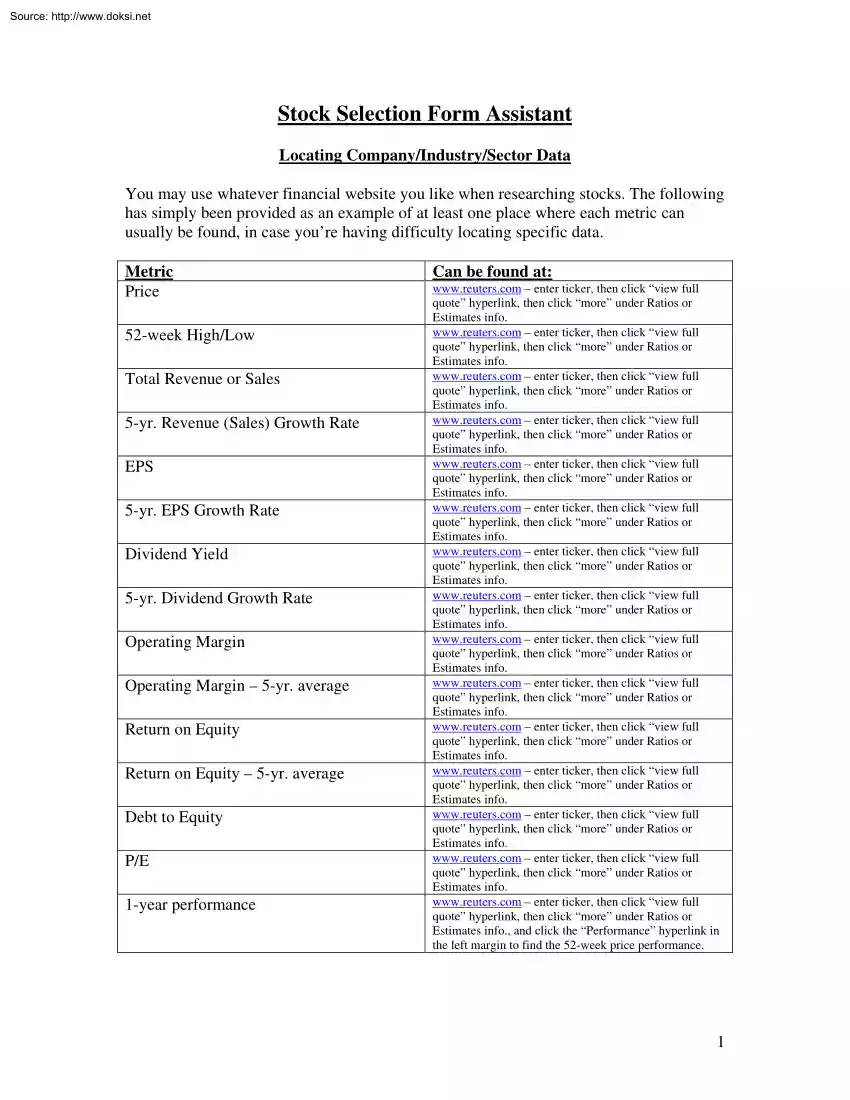
Source: http://www.doksinet Stock Selection Form Assistant Locating Company/Industry/Sector Data You may use whatever financial website you like when researching stocks. The following has simply been provided as an example of at least one place where each metric can usually be found, in case you’re having difficulty locating specific data. Metric Price 52-week High/Low Total Revenue or Sales 5-yr. Revenue (Sales) Growth Rate EPS 5-yr. EPS Growth Rate Dividend Yield 5-yr. Dividend Growth Rate Operating Margin Operating Margin – 5-yr. average Return on Equity Return on Equity – 5-yr. average Debt to Equity P/E 1-year performance Can be found at: www.reuterscom – enter ticker, then click “view full quote” hyperlink, then click “more” under Ratios or Estimates info. www.reuterscom – enter ticker, then click “view full quote” hyperlink, then click “more” under Ratios or Estimates info. www.reuterscom – enter ticker, then click “view full quote” hyperlink,
then click “more” under Ratios or Estimates info. www.reuterscom – enter ticker, then click “view full quote” hyperlink, then click “more” under Ratios or Estimates info. www.reuterscom – enter ticker, then click “view full quote” hyperlink, then click “more” under Ratios or Estimates info. www.reuterscom – enter ticker, then click “view full quote” hyperlink, then click “more” under Ratios or Estimates info. www.reuterscom – enter ticker, then click “view full quote” hyperlink, then click “more” under Ratios or Estimates info. www.reuterscom – enter ticker, then click “view full quote” hyperlink, then click “more” under Ratios or Estimates info. www.reuterscom – enter ticker, then click “view full quote” hyperlink, then click “more” under Ratios or Estimates info. www.reuterscom – enter ticker, then click “view full quote” hyperlink, then click “more” under Ratios or Estimates info. www.reuterscom – enter
ticker, then click “view full quote” hyperlink, then click “more” under Ratios or Estimates info. www.reuterscom – enter ticker, then click “view full quote” hyperlink, then click “more” under Ratios or Estimates info. www.reuterscom – enter ticker, then click “view full quote” hyperlink, then click “more” under Ratios or Estimates info. www.reuterscom – enter ticker, then click “view full quote” hyperlink, then click “more” under Ratios or Estimates info. www.reuterscom – enter ticker, then click “view full quote” hyperlink, then click “more” under Ratios or Estimates info., and click the “Performance” hyperlink in the left margin to find the 52-week price performance. 1 Source: http://www.doksinet Metric Definitions The following pages include descriptions about each metric on the Stock Selection form, including the analyst recommendations. Price The last reported price at which a security most recently traded for. It does not
guarantee that an investor will receive the same price upon buying or selling the stock. That price would be determined by the current bid and ask prices for the security. 2 Source: http://www.doksinet 52-week High/Low The highest and lowest price at which a stock has traded in the past 12 months, or 52 weeks, adjusted for stock splits. Many investors see the 52-week high or low as an important indicator. For example, a value investor may view a stock trading at a 52-week low as an initial indication of a possible value play (a stock sitting at a price below its intrinsic value). An investor should conduct more analysis to come to this final conclusion, but the fact that the stock is trading at its 52-week low can be a good starting point. 3 Source: http://www.doksinet Revenues/Sales It is not uncommon in company financial statements for companies that provide services, such as power or telecommunications companies, to describe their income as revenues, while those that
manufacture products describe their income as sales. So you may see some companies reporting in revenue, while others report in sales. Revenue: The amount of money that a company actually receives from its business activities (the products or services it offers) during a specific period. This includes discounts, deductions for returned assets, exchanges of assets, interest, and any other increase in owner’s equity. It is the "top line" or "gross income" figure from which costs are subtracted to determine net income. Revenue is calculated (before any expenses, taxes or other charges are subtracted) by multiplying the price at which goods or services are sold by the number of units or amount sold. However, different companies consider revenue to be received, or "recognized", in different ways. Revenue could be recognized when a deal is signed, when the money is received, when the services are provided, or at other times. So the revenue figures in
company’s financial statements may not always be quite comparing apples to apples, depending on how revenue is recognized. Sales (Net): The total dollar amount collected for goods and services provided, minus any returns, discounts, and allowances (for damaged/missing goods). While payment is not necessary for recognition of sales on company financial statements, there are strict accounting guidelines stating when sales can be recognized. The basic principle is that a sale can only be recognized when the transaction is already realized, or can be quite easily realized. This means that the company should have already received a payment, or the chance of receiving a payment is high. In addition, delivery of the good or service should have taken place for the sale to be recognized. 4 Source: http://www.doksinet Revenue (Sales) Growth Rate 1. The amount of increase, or the compounded annualized rate of growth, of a company's revenues or sales over a specific period of time.
Different types of industries have different benchmarks for rates of growth. For instance, companies that are on the cutting edge of technology would be more likely to have higher annual rates of growth compared to a mature industry, like retail sales. The use of historical growth rates is one of the simplest methods of estimating future growth. However, historically high growth rates don't always mean a high rate of growth looking into the future, because industrial and economic conditions change constantly. For example, the auto industry has higher rates of revenue growth during good economic times. However, in times of recession, consumers would be more inclined to be frugal and not spend disposable income on a new car. 5 Source: http://www.doksinet Earnings Per Share (EPS): Earnings (which is what's left of your revenue after subtracting the costs of producing or delivering the product or service and any taxes you paid on the amount you took in).divided by the number
of shares outstanding It is the portion of a company's profit allocated to each outstanding share of common stock. EPS serves as an indicator of a company's profitability. It is calculated as: OR Total Company Earnings = -------------------------------------------Number of Outstanding Shares (In the EPS calculation, it is more accurate to use a weighted average number of shares outstanding over the reporting term, because the number of shares outstanding can change over time. However, data sources sometimes simplify the calculation by using the number of shares outstanding at the end of the period.) Earnings per share is generally considered to be the single most important variable in determining a share's price. It is also a major component of the price-to-earnings valuation ratio. For example, if a company earns $100 million in a year and has issued 50 million shares, the earnings per share are $2. OR, assume that a company has a net income of $25 million. If the
company pays out $1 million in preferred dividends and has 10 million shares for half of the year and 15 million shares for the other half, the EPS would be $1.92 (24/125) First, the $1 million is deducted from the net income to get $24 million, and then a weighted average is taken to find the number of shares outstanding (0.5 x 10M+ 0.5 x 15M = 125M) An important aspect of EPS that's often ignored is the capital that is required to generate the earnings (net income) in the calculation. Two companies could generate the same EPS number, but one could do so with less equity (investment) - that company would be more efficient at using its capital to generate income and, all other things being equal, would be a "better" company. EPS can be calculated for the previous year ("trailing EPS"), for the current year ("current EPS"), or for the coming year ("forward EPS"). Note that last year's EPS would be actual, while current year and forward
year EPS would be estimates. 6 Source: http://www.doksinet Dividend Yield A ratio that shows how much a company pays out in dividends each year relative to its share price. In the absence of any capital gains, the dividend yield is the return on investment for a stock. It is calculated as: Dividend yield is a way to measure how much cash flow you are getting for each dollar invested - in other words, how much "bang for your buck" you are getting from dividends. Investors who require a minimum stream of cash flow from their investment portfolio can secure this cash flow by investing in stocks paying relatively high, stable dividend yields. For example, if two companies both pay annual dividends of $1 per share, but ABC company's stock is trading at $20 while XYZ company's stock is trading at $40, then ABC has a dividend yield of 5% while XYZ is only yielding 2.5% Thus, assuming all other factors are equivalent, an investor looking to supplement his or her income
would likely prefer ABC's stock over that of XYZ. Mature, well-established companies tend to have higher dividend yields, while young, growth-oriented companies tend to have lower ones, and most small growing companies don't have a dividend yield at all because they don't pay out dividends. If you owe dividend-paying stocks, you figure the current dividend yield on your investment by dividing the dividend being paid on each share by the share's current market price. For example, if a stock whose market price is $35 pays a dividend of 75 cents per share, the dividend yield is 2.14% ($075 ÷ $35 = 0214, or 214%) Yields for all dividend-paying stocks are reported regularly in newspaper stock tables and on financial websites. Dividend yield increases as the price per share drops and drops as the share price increases. 7 Source: http://www.doksinet Operating Margin A ratio used to measure a company's pricing strategy and operating efficiency. It is operating
income divided by revenues or sales (net). It is also known as “operating profit margin” or “net profit margin”. It is calculated as: Operating margin is a measurement of what proportion of a company's revenue is left over after paying for variable costs of production such as wages, raw materials, etc. A healthy operating margin is required for a company to be able to pay for its fixed costs, such as interest on debt. Operating margin gives analysts an idea of how much a company makes (before interest and taxes) on each dollar of sales. When looking at operating margin to determine the quality of a company, it is best to look at the change in operating margin over time and to compare the company's yearly or quarterly figures to those of its competitors. If a company's margin is increasing, it is earning more per dollar of sales The higher the margin, the better. For example, if a company has an operating margin of 12%, this means that it makes $0.12 (before
interest and taxes) for every dollar of sales Often, nonrecurring cash flows, such as cash paid out in a lawsuit settlement, are excluded from the operating margin calculation because they don't represent a company's true operating performance. 8 Source: http://www.doksinet Return On Equity (ROE): 1. A measure of a corporation's profitability that reveals how much profit or additional earnings a company generates with reinvested earnings and the money shareholders have invested. It is a measure of a company’s financial performance that indicates how efficient a company is with its money. It is calculated as: The ROE is useful for comparing the profitability of a company to that of other firms in the same industry. Return on equity may also be calculated by dividing net income by average shareholders' equity. Average shareholders' equity is calculated by adding the shareholders' equity at the beginning of a period to the shareholders' equity at
period's end and dividing the result by two. Investors may also calculate the change in ROE for a period by first using the shareholders' equity figure from the beginning of a period as a denominator to determine the beginning ROE. Then, the end-of-period shareholders' equity can be used as the denominator to determine the ending ROE. Calculating both beginning and ending ROEs allows an investor to determine the change in profitability over the period. Investors usually look for companies with returns on equity that are high and growing. In general, it's considered a sign of good management when a company's performance over time is at least as good as the average return on equity for other companies in the same industry. The biggest stock market winners historically showed an ROE of 17% to 50% before they made their huge gains. 9 Source: http://www.doksinet Debt to Equity A measure of a company's financial leverage calculated by dividing its total
liabilities (or long-term debt) by stockholders' equity (Note: Sometimes only interest-bearing long-term debt is used instead of total liabilities in the calculation). It indicates what proportion of equity and debt the company is using to finance its assets. It is calculated as: A high debt/equity ratio generally means that a company has been aggressive in financing its growth with debt. This can result in volatile earnings as a result of the additional interest expense. It is also a sign of greater leverage, which may mean a fastgrowing company or one that is overextended If a lot of debt is used to finance increased operations (high debt to equity), the company could potentially generate more earnings than it would have without this outside financing. If this were to increase earnings by a greater amount than the debt cost (interest), then the shareholders benefit as more earnings are being spread among the same amount of shareholders. However, the cost of this debt financing
may outweigh the return that the company generates on the debt through investment and business activities and become too much for the company to handle. This can lead to bankruptcy, which would leave shareholders with nothing. Average ratios vary significantly from one industry to another, so what is high for one company may be normal for another company in a different industry. For example, capital-intensive industries such as auto manufacturing tend to have a debt/equity ratio above 2, while personal computer companies have a debt/equity of under 0.5 From an investor's perspective, the higher the ratio, the greater the risk you take in investing in the company. But your potential return may be greater as well if the company uses the debt to expand to its sales and earnings. Investing in a company with a higher debt/equity ratio may be riskier, especially in times of rising interest rates, due to the additional interest that has to be paid out for the debt. For example, if a
company has long-term debt of $3,000 and shareholder's equity of $12,000, then the debt/equity ratio would be 3000 divided by 12000 = 0.25 It is important to realize that if the ratio is greater than 1, the majority of assets are financed through debt. If it is smaller than 1, assets are primarily financed through equity 10 Source: http://www.doksinet Price to Earnings Ratio (P/E): The P/E ratio is a valuation ratio of a company's current share price compared to its pershare earnings. It is the most common measure of how expensive a stock is It is also known as the “price multiple” or “earnings multiple”. It is calculated as: For example, if a company is currently trading at $43 a share and earnings over the last 12 months were $1.95 per share, the P/E ratio for the stock would be 2205 ($43/$195) This number basically shows how much investors are willing to pay per dollar of earnings. If a company were currently trading at a multiple (P/E) of 22, the
interpretation is that an investor is willing to pay $22 for $1 of current earnings. In general, companies with high P/E ratios are more likely to be considered "risky" investments than those with low P/E ratios, since a high P/E ratio signifies high expectations. In general, a high P/E suggests that investors are expecting higher earnings growth in the future compared to companies with a lower P/E. However, the P/E ratio doesn't tell us the whole story by itself. It's usually more useful to compare the P/E ratios of one company to other companies in the same industry, to the market in general or against the company's own historical P/E. It’s not useful to use the P/E ratio to compare a technology company (typically higher P/E) to a utility company (typically lower P/E) as each industry has much different growth prospects. There is a potential problem with the P/E measure so you want to avoid basing a decision on this measure alone. The denominator (earnings)
is based on an accounting measure of earnings that is susceptible to forms of manipulation, making the quality of the P/E only as good as the quality of the underlying earnings number. If earnings falter, there is usually a sell-off, which drives the price and P/E ratio down. But if the company is successful, the share price and the P/E can climb even higher. Similarly, a low P/E can be the sign of an undervalued company whose price hasn't caught up with its earnings potential or a clue that the market considers the company a poor investment risk. Stocks with higher P/Es, which are typical of companies that are expected to grow rapidly in value, such as Internet and other emerging technology stocks, are often more volatile than stocks with lower P/Es because it can be more difficult for the company's earnings to satisfy the expectations of investors. When a stock's P/E ratio is high, it is often considered pricey or overvalued while stocks with low P/Es are typically
considered a good value. However, studies of the biggest stock market winners found the opposite to be true: the higher the P/E, the better the stock. The average P/E of the best winners over the last fifteen years at the initial buy point prior to their huge price increases was 31 times earnings. These P/Es went on to expand more than 100% to over 70 times earnings as the stocks significantly increased in price. 11 Source: http://www.doksinet Performance A measure of how well the stock has done over a specific period of time. Is calculated by taking the current price of the stock and dividing it by price of the stock from the previous time period. For example, if the price of the stock today is $50, and the price of the stock 1 year ago was $40, then the 1-year performance for the stock would be 25% ($50/$40 – 1 = 1.25 -1 = .25 or 25%) 12 Source: http://www.doksinet Analyst Recommendations 1. Strong Sell A type of stock trading recommendation given by analysts for a stock
that is expected to dramatically underperform compared to the average market return and/or return of comparable stocks in the same sector or industry. It is an emphatic negative comment on a stock's prospects. Strong sell is one of the strongest recommendations that an analyst can give to investors to sell a stock and generally indicates that the underlying company and/or relevant market conditions will be unfavorable for the stock in the subsequent period of time. 2. Sell A stock recommendation given by analysts to sell a particular security. The rating is worse than neutral, but better than strong sell 3. Neutral/Hold An analyst recommendation to neither buy nor sell a security. A company with this recommendation generally is expected to perform with the market or at the same pace as comparable companies. It is also known as “market perform" This rating is better than sell, but worse than buy. It means that if you own a security you still shouldn't sell, but you also
should not buy the security if you don't own it already (or do not buy more of it if you do). 4. Buy A stock recommendation given by analysts to purchase a specific security. The rating is better than neutral but worse than strong buy. 5. Strong Buy A type of stock purchasing recommendation given by analysts for a stock that is expected to dramatically outperform the average market return and/or the return of comparable stocks in the same sector or industry. It is an analyst's emphatic endorsement of a stock. 'Strong buy' is the strongest recommendation that an analyst can give to purchase a stock. A 'strong buy' means the analyst believes the stock's underlying company is or will soon be experiencing positive financial performance and/or favorable market conditions. As with any type of analyst rating, the rating is only relevant until a material event occurs that results in the analyst changing his or her outlook regarding the company. 13
 1954. augusztus 12-én született a Bács-Kiskun megyei Baján. Édesapja Dávid Sándor, édesanyja Csilics Katalin bedolgozók, mind a ketten nyugdíjasok. Egy bátyja és egy öccse van. 1982-ben fogadott örök hűséget egy közjegyzővel, Barbalics Miklóssal. Házasságukból két gyermekük született: Berta (1982) és Miklós (1985). Az általános- és középiskolát Baján végezte; a