A doksi online olvasásához kérlek jelentkezz be!
A doksi online olvasásához kérlek jelentkezz be!
 2006 · 52 oldal (423 KB)
 angol
 1
 2026. október 21.
 The Ohio State University
 Jelentkezz be

 Beágyazás
Nincs még értékelés. Legyél Te az első!
Mit olvastak a többiek, ha ezzel végeztek?



Tartalmi kivonat
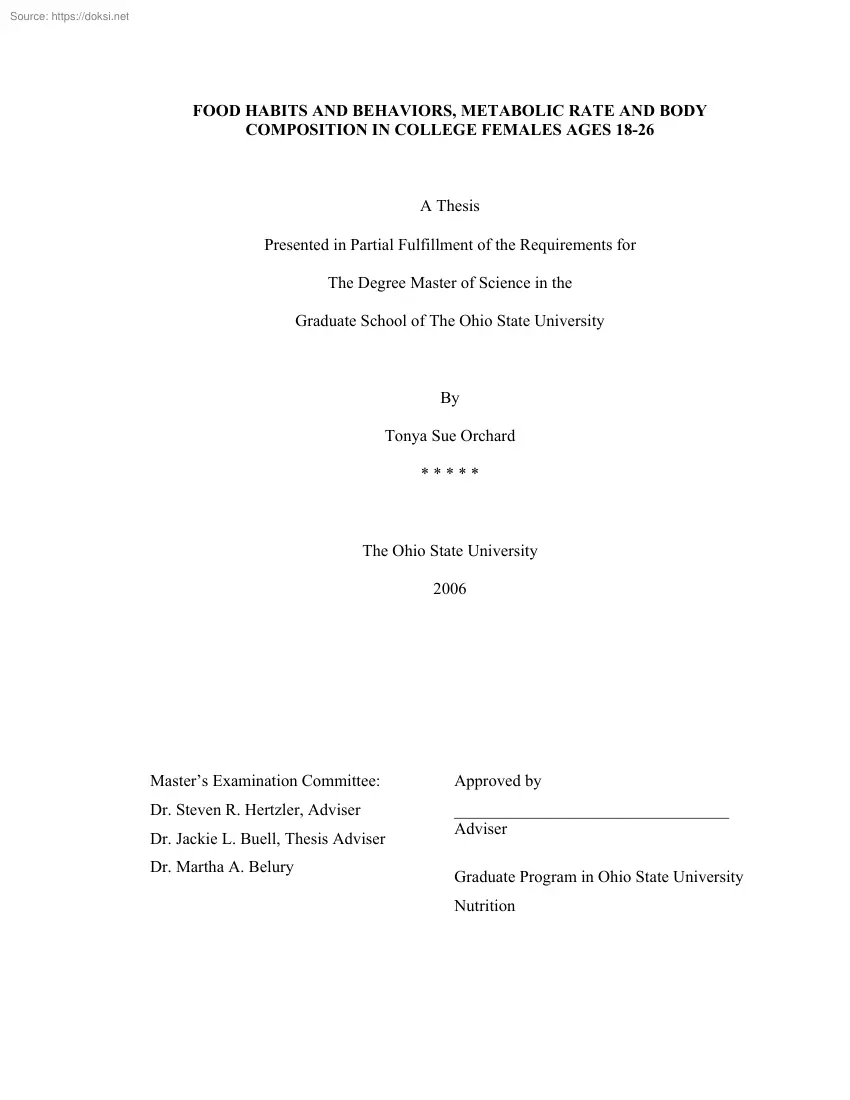
FOOD HABITS AND BEHAVIORS, METABOLIC RATE AND BODY COMPOSITION IN COLLEGE FEMALES AGES 18-26 A Thesis Presented in Partial Fulfillment of the Requirements for The Degree Master of Science in the Graduate School of The Ohio State University By Tonya Sue Orchard * The Ohio State University 2006 Master’s Examination Committee: Approved by Dr. Steven R Hertzler, Adviser Adviser Dr. Jackie L Buell, Thesis Adviser Dr. Martha A Belury Graduate Program in Ohio State University Nutrition ABSTRACT This study undertook to examine the population-specific reliability and validity of previously published nutrition assessment questionnaires, and to examine the possible relationship of resting metabolism and body fatness to nutrition attitudes and habits. Thirty eight female subjects (19-25 years), each of whom completed a three day food record and the Nutrition Electronic Tool (NET), were evaluated. Resting metabolic rate (RMR) and body fatness were
measured using indirect calorimetry and air displacement technologies. Thirty two subjects repeated the questionnaire to document four week reliability. Excellent overall reliability for the NET was shown using the Pearson correlation (r > 0.8) Cronbach’s alpha values >07 demonstrated acceptable levels of internal reliability. The validity of the NET was investigated by comparing various questionnaire responses to analyses results of participants’ food records. Many significant associations strengthen the validity of the tool. A new linear multivariate regression model containing four significant predictors of RMR was developed; lean mass, age, meat preference and low-fat dairy use. This model explained approximately 53% (R2=.528) of the variability in RMR Analysis of validity and reliability data leads us to believe the NET instrument is valid in this population. The regression model identified from this sample to predict resting metabolic rate included two variables from
wellknown RMR predictive equations, lean mass and age. However, age was positively ii correlated with RMR in our research. Inclusion of low-fat dairy and meat variables suggest that a higher intake of low-fat dairy products and a higher preference for meat have a positive relationship to RMR. iii TABLE OF CONTENTS Page Abstract . ii Acknowledgments . iv Vita v List of Tables viii List of Abbreviations ix Chapters: 1. Introduction 1 2. Review of Literature 5 Chronic Dieting and Resting Metabolic Rate . 5 Chronic Dieting and Body Composition 9 Chronic Dieting and Macronutrient Intake . 11 Dietary Assessment Instrument Validation 12 Body Composition and Metabolism Measurement 14 3. Methodology 16 Subjects . 16 Study Design . 16 Procedure 17 Statistical Analysis . 20 Reliability Analysis . 20 Validity Analysis . 21 Regression Modeling 22 vi 4. Results 25 Subject Characteristics . 25 Reliability and Validity of Nutrition Electronic Tool . 26 Reliability .
Validity . Association of Food Habits and Behaviors to Resting Metabolic Rate . Association of Food Habits and Behaviors to Body Composition 26 27 30 32 5. Discussion 35 6. Limitations / Recommendations for the Future 39 Reference List 42 Appendices A. Original RENO Diet-Heart study Questionnaires B. Dietary Intent Scale C. Nutrition Electronic Tool Reliability Coefficients D. NET Correlations with Three-Day Food Records E. Variables of Interest for RMR Model F. RMR Regression Model Summary Statistics G. Variables of Interest for Percent Body Fat Regression Models 7 48 55 56 62 63 64 65 LIST OF TABLES Page Table 1. Subject characteristics 25 2. Correlation of average scores from the Food Habits Questionnaire (FHQ) to intake of select nutrients from 3-day food records . 27 3. Correlation of scores from the Nutrition Attitude Survey (NAS) with intake of selected nutrients from 3-day food records 29 4. Resting metabolic rate regression model coefficients 30 5.
Percent body fat regression model coefficients 33 viii ACKNOWLEDGMENTS I am indebted to numerous individuals for their help in successfully completing this thesis project. First, I would like to thank my thesis adviser, Dr Jackie Buell, for her hours of thoughtful assistance and invaluable guidance. She has truly been the epitome of a mentor. I would also like to thank Dr. Steve Hertzler, my adviser, for his helpfulness and advice, and Dr. Martha Belury, for serving on my committee and offering direction and encouragement throughout the project. A special thanks to Adam Romney, an exceptional undergraduate student in nutrition, for participating in many of the laboratory measurements of subjects and entry of much of the food record data. I also wish to thank Dr. Tim Kirby and Carmen Babcock for the use of their body composition lab and equipment; Dr. Diane Habash, for graciously allowing us to use the facilities at the General Clinical Research Center; Jason Eslick and Bryan
Turkelson for their computer expertise and work on the electronic tool; and Dr. Mohammed Rahman, Senior Statistical Consultant, for his excellent statistical advice. Finally, I would like to thank my husband, Steve, and children, Brayton, Caleb and Becky, for the sacrifices they have made to support me during the completion of this thesis. iv CHAPTER 1 INTRODUCTION Dieting to achieve weight loss is a common practice in American society, especially among females (1-4). It has become more common for female adolescents to be on a diet than not (3). Preventing a decrease in metabolism is likely important to successful weight maintenance and may aid in weight loss, but many weight-loss efforts include “starvation” methods or chronic dieting that may suppress the metabolic rate. Damage to the metabolic rate sets the stage for “yo-yo” dieting or the weight cycling of losing and then gaining weight (5,6). The purpose of this study was to examine the relationship among food habits
and behaviors, body fatness and resting metabolic rate in college-aged women. The hypothesis driving this research is that women choose nutritional practices that ironically make it more difficult to achieve the weight they desire, and those who periodically use very low calorie diets or cycle through periods of energy deficiency, will depress their metabolism and increase body fatness making desired changes more difficult. Alternatively, women who eat to support their level of activity will have a healthier metabolism that facilitates maintaining a more desirable body weight and level of fatness. 1 The ability to accurately estimate nutritional adequacy is an important part of the development of effective nutrition intervention strategies for healthy weight management. In order to evaluate food habits and behaviors, valid and reliable nutritional assessment tools are needed. Therefore, a second objective of this study was to validate an electronic nutritional assessment
instrument in college females. The Nutrition Electronic Tool (NET) contains three previously documented dietary assessment instruments; the Food Habits Questionnaire (FHQ), the Nutrition Attitudes Survey (NAS), and the Tendency to Diet Scale (TDS). Each of these original tools is contained in Appendix A The Food Habits Questionnaire is a self-assessment tool originally developed for the RENO dietheart study that measures overall dietary quality (7,8). The Tendency to Diet Scale, also authored by RENO diet-heart study investigators, assesses self-reported tendency to diet. The Nutrition Attitudes Survey, originally developed by Hollis et al (9), is a survey in the public domain that assesses behaviors that pertain to the adoption of a low-fat, low cholesterol diet. The version included in the electronic tool was modified by Carmody and Fey for the RENO diet-heart study to more closely measure four areas of cognition and behavior related to nutrition choices and dietary change(8).
Because the sample studied in the RENO diet-heart study included a wider age range, from 20-74 years old (mean age 44.1 yrs), and both males and females, validity and reliability studies in a female college population are needed to make this tool valuable for research in this age and gender group. Specific Aims: 1. To evaluate the relationship among food habits and behaviors, resting metabolic rate and body composition in college-aged women 2 2. To measure the validity and reliability of an electronic nutritional assessment tool Though it was not be measured in this study, the design of the questionnaire may promote healthful eating for the participants. The FHQ was designed as a screening tool for dietary quality related to the prevention of cancer and cardiovascular disease with a particular focus on assessment of fat. One of the unique features of the FHQ is a summary paragraph at the end of each section which gives the respondant feedback on diet quality based on a calculated
score for that section; the higher the score, the better the nutritional quality of the diet. Such feedback may prove valuable in assisting the participants to make behavioral changes that positively impact health. Participants were also given an estimation of their resting metabolic rate and body composition to give them further information upon which to base life-style and dietary decisions. We believe knowing these numbers may help guide future health-promoting decisions. As the prevalence of obesity increases to epidemic proportions in the United States (10), the quest for effective interventions increases. Understanding the relationship between caloric restriction and food habits on resting metabolism and body fatness may offer insights into treatment and/or prevention of unhealthy body composition. The ability to identify potentially harmful attitudes, behaviors, and food choices is an important primary step in working toward effective educational initiatives and interventions in
the field of weight management and body composition. 3 CHAPTER 2 REVIEW OF LITERATURE Chronic Dieting and Resting Metabolic Rate Resting metabolic rate (RMR) is the energy the body requires at rest. It is commonly associated with how easy or difficult it is for a person to change body weight and fat storage. In the classic Minnesota study of semi- starvation revisited by Dulloo and Jacquet, it was shown that after 6 months of severe energy restriction in 32 lean men, there was a marked reduction in basal metabolic rate, the energy expended in a rested state after at least 12 hours of fasting (11). At week 12 of semi-starvation, the mean basal metabolic rates (BMR), adjusted for fat free mass and fat mass, were lower than control BMR levels by approximately 20%. This value continued to drop to approximately 25% of control levels by week 24, and was still approximately 10% below control values even after 12 weeks of restricted re-feeding. The authors suggest that because the
reductions in BMR were significantly greater than predicted from the changes in fat free mass and fat mass, this provides evidence for an adaptive reduction in BMR such as reduced thermogenesis. Weyer et al reported a decreased total energy expenditure (TEE), sleeping metabolic rate and decreased spontaneous physical activity 4 (fidgeting) in 5 subjects who were energy restricted for two years due to confinement in the Biosphere 2 ecologic “miniworld” and prototype planetary habitat, when compared with controls (12). Total energy expenditure and spontaneous physical activity remained lower than predicted after subjects had left the study and regained body weight. However, sleeping metabolic rate increased to comparable control levels, thus resting metabolism did not seem to be affected long-term by energy restriction of 2 years after weight was regained. In contrast to research-imposed energy restriction related to lack of availability of food, many women choose to limit
energy intake in an attempt to control weight. Rideout et al (13) defines cognitive dietary restraint as “the perception that one is constantly monitoring and attempting to limit food intake in an effort to achieve or maintain a desired body weight”. This behavior, also termed chronic dieting, may lead to depression of the resting metabolic rate (14). In research conducted by Elliot et al in seven obese women, a decrease in resting metabolic rate (RMR) was observed during a proteinsparing modified fast of greater than 10 weeks (15). The modified fast consisted of approximately 300 Calories per day with 45 grams of protein. Resting metabolic rate decreased 22% during the initial diet phase compared to pre-diet levels. Data gathered at 4 and 8 weeks post-diet showed a sustained decrease in RMR that was not significantly different from the lowered RMR seen during the dieting phase, even after return to a maintenance caloric intake. Dieting may affect RMR to varying degrees depending
on the severity of the caloric restriction. Sweeney et al (16) reported a greater decrease in RMR in obese women on severe energy restriction versus those on moderate energy restriction over a six month 5 period. This was explained by the greater loss of fat free mass in the severely restricted group. The authors concluded that moderate energy restriction does not seem to cause the body to conserve energy, and thus lower RMR, as much as severe energy restriction. Despite numerous studies that indicate metabolic depression with restricted energy intake, not all research examining restrained eating suggests a resultant decreased metabolic rate. Some female chronic dieters have normal resting energy expenditure (REE), while others have lower than predicted REE (17,18). Fifteen female chronic dieters with REEs of less than or equal to 85% of predicted values were compared with fifteen female chronic dieters with REEs of 100% or more of predicted values, based on the Mifflin et al
equation(17). Those with normal REEs had a higher lean body mass and lower dietary restraint scores than those in the lower REE group. Thus, body composition and the degree of dietary restraint may both be associated with differences in REE among chronic dieters. In a study examining the relationship of dieting history to RMR and body composition, Wadden et al (18) reported that the number of weight cycles and lifetime weight loss was not associated with a reduced RMR or percentage of weight as body fat in 50 obese women (BMI of 37.9 +/- 1) Subjects in the low-cycling group (28 +/- 0.4 diets and lifetime weight loss of 264 +/- 3 kg) had RMR levels that were not significantly different from those in the high-cycling group (7.1 +/- 07 diets and lifetime weight loss of 83 +/- 11 kg) This study did not include a control group of non-dieters. Keim and Horn investigated the effect of prior restrained eating behavior on the metabolic response to three days of dietary energy restriction in 30
overweight women (BMI of 25-45), 20 to 46 years of age(19). Each subject was randomly assigned to a 36 day diet intervention; either an energy-adequate diet of ~30 kcal/kg or and energyrestricted diet of ~15 kcal/kg, followed by a fourth day of metabolic testing. This 4-day sequence was repeated four times for each subject, with approximately one month between intervention periods. Energy expenditure and substrate oxidation were measured after a 12 hour fast on the morning of the fourth day of each intervention. There was no significant difference in REE between restrained and unrestrained eaters. In fact, restrained eaters increased their REE during the energy-restricted diet as well as during the energy-adequate diet, leading the researchers to speculate that those classified as restrained eaters may have been consuming less energy than the restricted diet provided prior to the beginning of the intervention. If this were the case, the energy-restricted intervention actually was a
higher energy diet than was typical for these individuals. Chronic Dieting & Body Composition Besides the potential effects of chronic dieting on RMR, there is also concern that chronic dieting may impact body composition. Beiseigel and Nickols-Richardson reported that cognitive eating restraint scores as measured by the cognitive eating restraint subscale of the eating inventory questionnaire were not associated with differences in resting energy expenditure measured by ventilated hood (VMAX 29N, Sensor Medics, Yorba Linda, CA) in women of typical college age with body mass indexes between 18-25, but were associated with increased body fat mass and percentage body fat (20). Women who reported weight fluctuations during the previous two years were excluded, thus this research was limited to chronic dieters who maintained body weight during the recent past. In this study, women with high cognitive eating restraint 7 did not have significantly different total energy intake when
compared to women with low restraint. This might explain some of the similarity in REEs between the two groups In research conducted in a French sample of 466 adults and 271 adolescents, restrained eating as measured by the Three-Factor Eating Questionnaire was strongly associated with higher fat mass in normal weight subjects, but not in overweight subjects (21). Initial restrained eating did not predict weight gain over a subsequent two year period. In an eight year longitudinal study, conducted with 19 young men and 58 young women, dietary restraint alone did not predict weight gain. However, it is interesting to note that dietary restraint and self-esteem interactions did predict weight change in the females included in the sample (22). The relationship between dietary restraint and weight change in this study was best described as curvilinear, with dietary restraint being positively related to weight gain, except in individuals very high in dietary restraint, who tended to lose
weight. The investigators concluded that dietary restraint is more likely to predict weight gain in subjects with high, rather than low, self-esteem. .Many of these same studies suggest that weight regain after energy restriction is almost exclusively characterized by an increase in body fat stores (12,17,23). Deutz et al have demonstrated an increase in adiposity in athletes as a result of trying to lose weight by restricting calories (23). Participants in the Biosphere 2 experiment who were followed for 6 months after exiting the confined environment and resumed an ad libitum diet, regained body weight to pre-entry levels, almost entirely due to an increase in fat mass (12). Body fat distribution of overweight females with a history of chronic dieting and weight cycling has been investigated by Wallner et al (24). These researchers tested the 8 hypothesis that weight cycling is associated with increased upper body fat. Women who had lost at least 4 kg of weight three times in the
last four years were classified as weight cyclers. Thirty women were compared to 97 age-matched overweight and 167 normal weight women. Subcutaneous adipose tissue was measured at 15 anatomical sites from neck to calf using the Lipometer, an optical device recently developed for research purposes only. It allows a quick, precise determination of subcutaneous adipose tissue without exposure to radiation. Results of tissue measurement indicated an android or upper body fat pattern in the overweight women as compared to a gynoid fat distribution (lower body fat) in the normal weight women. This android fat pattern was even more pronounced in overweight females who were classified as weight cyclers. Weight cycling in response to “yo-yo” dieting has also been shown to decrease lean body mass and depress resting metabolic rate in non-obese college age females (6). Chronic dieters with low REE have been shown to have less lean body mass than dieters with normal REE (17). Research also
suggests that macronutrient composition of the diet may influence body fat mass in females. Specifically, lower carbohydrate and higher fat intakes have been shown to be significantly related to higher percent body fat in women (25). Chronic Dieting and Macronutrient Intake There is an association between dieting-related behaviors in college students and dietary fat avoidance (26). In a study by Rideout et al (13), female college students who were classified as having “high cognitive dietary restraint” using an eating attitudes and behaviors survey, consumed less energy and chose reduced-fat foods more frequently, resulting in a lower total fat intake, than non-restrained eaters. The authors concluded that 9 the use of reduced-kilocalorie and reduced-fat foods may be a potential indicator of high dietary restraint. Beiseigel et al (20), found that women with high cognitive eating restraint did not consume less energy than non-retrained eaters, but reported healthier eating
habits, including significantly higher fruit and vegetable intake. Thus it is important to be cautious in the interpretation of these studies; dietary restraint may not always be an indicator of inadequate energy intake, but rather may be correlated with more healthful eating in some instances. Dietary Assessment Instrument Validation Several instruments have been used to assess diet intake and quality, including lengthy food frequencies, diet behavior screening tools, 24-hour food records and 4-day food records(27-31). Validity of these instruments is usually tested by correlating nutrient estimates from one instrument with estimates obtained from another instrument (32). The current accepted trend is to validate the tool of interest back to the analysis results of a three (or more) day food record. The three nutrition questionnaires included in the Nutrition Electronic Tool (NET) were used in the RENO diet-heart study (8). The Food Habits Questionnaire (FHQ) was developed as a
screening tool for dietary quality related to the prevention of cancer and cardiovascular disease, with a focus on assessment of dietary fat and whole grains (7). When used in the RENO diet-heart study, it included 49 questions related to frequency of food intake over 6 categories. In the current study, 10 questions were added to further focus on variables of interest. Test-retest reliability of the FHQ in the RENO diet-heart study population (n=246) was assessed using Pearson correlation over a 2-week interval, 10 producing a coefficient of 0.92, indicative of very good reliability Internal consistency was measured using Cronbach’s alpha. This was within the range recommended for research purposes, with an alpha level of 0.85 In year eight of the RENO diet-heart study, the FHQ was correlated with intake of macronutrients from a one-day food record of participants. Significant correlations were found between several categories of the FHQ and total fat intake reported with the
one-day food record. Significant positive correlations were also found between all of the FHQ food group scores and relative intake of carbohydrate, expressed as percent of calories (7). For the purposes of this investigation, ten questions were added to the FHQ to help better quantify carbohydrate, vegetable and fruit, and dairy intake, as well as vitamin, mineral supplementation. The Nutrition Attitude Survey was originally developed by Hollis and is in the public domain (9). The tool estimates four aspects of nutrition attitude: dietary helplessness, food exploration, meat preference, and nutrition concern. The short-term reliability for each component is r=0.89 for dietary helplessness, r= 084 for food exploration, r=079 for meat preference, r=0.58 for nutrition concern using a two week repeat interval Hollis et al demonstrated acceptable short term reliabilities for, dietary helplessness, food exploration and meat preference. RENO investigators developed the Tendency to Diet Scale
(33). Internal reliability was measured at 0.79 using Cronbach’s alpha This set of 15 questions aims to identify the frequency and nature of the respondents food restriction habits, both quantity and quality. It was used to gauge the frequency and nature of dieting behavior in the RENO study as well as in the current study. The current study also investigated a second tool, the Dietary Intent Scale (DIS), to further strengthen indications of dieting-related 11 behaviors. The DIS is a tool developed as a measure of chronic eating restraint (34) Pilot studies (N = 117, N=59) indicated that the DIS is internally (α = 0.94) and temporally reliable (1-month test-retest = 0.92), and that the DIS correlated to fat-gram consumption (r = −0.32) Cronbach’s alpha was > 09 for repeated internal reliability tests of the scale The TDS and DIS scales were compared in this study for reliability, validity and practicality in this population. Body Composition and Resting Metabolic Rate
The Bod Pod® measures body volume and predicts fat and fat free mass using air displacement plethysmography. It is based on the same whole-body measurement principles as underwater weighing and is considered to a reference method (35). Research demonstrates the Bod Pod® is fast, safe, and easy to complete without compromising accuracy (36,37). The validity and reliability of the Bod Pod® have been confirmed by studies investigating a diverse array of populations; varying by gender, age, fitness, and ethnicity (38-41). Furthermore, the Bod Pod® has been shown to be accurate in measuring body composition under such specific conditions as weight-loss (42) and severe obesity (43). The MedGem® portable indirect calorimetry analyzer is a convenient, non-invasive method to estimate resting metabolism. Previous MedGem® validation has included metabolic cart (n=188, r=.91, r2=083, SEE +/-38 kilocalories per day) (44) and Douglas Airbag (n=63 subjects, r=0.91, SEE +/- 134 kilocalories per
day) (45,46) comparisons It has also been validated for RMR estimates (n=50, absolute mean kcal difference of 86.58 +/- 72.32 kilocalories per day)(47) and postprandial energy expenditure (n=15, no 12 significant difference between means)(48) using the traditional DeltaTrac indirect calorimeter. Recently Nieman et al have documented the use of this device in children demonstrating that the MedGem® is valid and reliable in a wide application of subjects (49). The MedGem® gives an audible and visible cue when it has successfully measured the resting metabolic rate. 13 CHAPTER 3 METHODS Subjects Subjects invited to participate in this study were limited to matriculated females between the ages of 18-26 in order to focus on a population that has been shown to have high levels of dieting behaviors, and give the study more homogeneity with traditional college students. This resulted in a study sample of 38 women Thirty two of the original 38 subjects chose to repeat the NET
questionnaire four weeks after initial completion in order to document reliability. Exclusion criteria screened at the laboratory visit included pregnancy and use of thyroid medications. Subjects received the results from measures of metabolism using the MedGem® and measures of body composition using BodPod® technology as incentive for participation. Those who repeated the NET instrument received monetary reimbursement ($5) for their additional time. Subjects could leave the study at any time without penalty. Study Design This research used a cross-sectional correlational design. Subjects recruited from undergraduate and graduate level courses completed the NET and a three-day food and activity record. Upon completion of the electronic instrument and food records, each 14 participant received body fat and metabolic rate evaluation using the BodPod® and MedGem® to estimate body composition and resting metabolism during a single laboratory visit. Approximately four weeks from
the initial recording of the NET instrument, participants were asked to complete the electronic tool a second time to document repeat reliability. Procedure After consent to participate was obtained, subjects were asked to complete the NET instrument. The NET included three sub-sections of interest, the Food Habits Questionnaire (FHQ), Nutrition Attitudes Survey (NAS), and Tendency to Diet Scale (TDS) as outlined previously. The electronic tool is available at http://www.hecosuedu/sportsnut/foodhabits, and it records answers automatically to a secure database on the Human Ecology server when the participant clicks on finish for each section. The NET is available to any person that goes to the website; therefore, participants were advised to use their OSU username to allow for data association in the data collation phase of the study. Subjects were asked to complete the NET two times to test reliability of the instrument with approximately 4 weeks between episodes. Energy intake of
subjects was evaluated using three-day food records. Participants provided the research team with a three-day food record to include two weekdays and one weekend day. The records were recorded on forms typically used for a one-day food record in undergraduate basic nutrition courses. Average dietary intake was estimated using Food Processor SQL® software, a research-quality database which provides a calculation of Calories consumed and a nutrient breakdown of macronutrients, fat types, 15 and many vitamins and minerals (50). The food record data was considered the standard for comparison for the NET variables. After completion of the NET questionnaire and 3-day food records, subjects were scheduled for laboratory evaluation of metabolism and body composition. Standard procedures for obtaining body composition measurements were followed using the BodPod®. Subjects reported to the body composition lab between 6:00 am and 9:00 a.m, after a fast of at least four hours Subjects were
instructed to abstain from exercise and limit physical activity on the morning of their lab visit. Measures were obtained with subjects in a bathing suit or similar clothing. Height in centimeters without shoes was obtained using a stadiometer, and waist circumference in centimeters was measured using a plastic coated tape measure. Waist fold was used as the standard for identification of the waist measurement site. Anthropometric measures were performed by the same technician for all subjects in the study. Subjects were then weighed on an electronic scale as part of the protocol for calibration of the BodPod®. Subjects entered the BodPod® and remained seated during measurement of body composition. The mean body density was calculated by the BodPod® computer software based on at least two volume measurements for each subject. Upon completion of volume measurements by the BodPod®, subjects were provided with a computer-generated report of their lean and fat mass estimates. Next,
participants completed the Dietary Intent Scale (DIS) and answered any questions needed to clarify their submitted food and activity records. Participants responded to the nine DIS items on 5-point Likert-type scales ranging from ‘‘never’’ to ‘‘always.’’ One dichotomous question specific to dieting status on the day of MedGem® 16 measurement was added to the questionnaire (see Appendix B for complete questionnaire). After the relative rest of the BodPod measurement, subjects sat quietly for at least five minutes prior to MedGem® measurement to ensure that the body was in a resting state. While waiting, subjects were instructed on what to expect during resting metabolic rate estimation. Subjects were instructed to relax and breathe normally while holding the device level with their elbow resting on a table. Per the MedGem® protocol, subjects wore a nose-clip and breathed into the MedGem® until the analyzer audibly signaled that the test was concluded (total of
5-10 minutes). The Calorie estimate was recorded for the researchers as well as shared with the participant. Subjects then went through an exit interview to allow them to ask questions about the meanings of the estimations. Four weeks after the submission of the first electronic tool, participants were invited via e-mail to complete the electronic tool a second time to document the reliability of the instrument. Participants completing the tool for a second time received monetary reimbursement for their time and effort. Data from this tool was automatically stored to the server. Statistical Analysis All statistical procedures were performed using SPSS 14.0 on a PC platform Standard analysis for reliability and validity of the NET tool was performed as well as regression modeling to meet the objectives of the study. Variables of interest were determined prior to modeling. 17 Reliability Analysis Initial reliability analysis was performed using the Kappa statistic to examine
reliability, but SPSS software viewed responses not chosen for a NET question as missing values and produced asymmetric tables. This forced us to consider alternative analytical approaches. After statistical consultation, Somers’ D statistic was chosen to test for association based on concordant pairs for each question on the NET. Pearson correlation coefficient was generated to compare the mean scores of each of the three sections of the NET; the FHQ, NAS and TDS, as well as each sub-category of these questionnaires. Cronbach’s alpha was calculated to examine the internal reliability of each section of the electronic tool. Validity Analysis The validity of the FHQ was investigated by comparing subjects’ responses on the FHQ to the analysis results of the subjects’ three-day food records. Questions scored positively (“healthier” choices) were originally given values from 0-4 on an ordinal scale; while questions scored negatively (“less healthy” choices) were given
values ranging from 5-1. In order to weight all questions equally, positive questions were adjusted to a 15 scale by adding one to each response In this way, a scoring system was implemented that rewarded positive behaviors with the same weight that it “penalized” for negative behaviors. Pearson correlations were calculated between intakes of selected nutrients from participants’ three-day food record results and the four sections of the NAS. The NAS consists of 24 items that were scored on a scale ranging from 1-5 (“not at all” to 18 ”extremely”). The tool assesses four nutrition attitude variables or factors: (1) dietary helplessness, (2) food exploration, (3) meat preference, and (4) nutrition concern. The range of possible scores for each factor is 10-50 for dietary helplessness, 5-25 for food exploration, 4-20 for meat preference, and 5-25 for health concern. Higher scores represent a greater propensity toward the nutrition attitude measured in each factor.
Pearson correlation coefficients were used to measure the association between the total score of the TDS (range 15-61) and the total score of the DIS instrument. The TDS score is based on the sum of 15 items. Reverse-scoring is used on 8 of the 15 items A higher total score indicates a higher tendency to diet. The DIS tool contains 9 questions with rating responses from 1-5 that focus on dietary restraint with the intent of weight control. Overall, it is scored on a scale of 9-45, with a higher score representing an increase in dieting-related behaviors. One additional dichotomous question was used to assess current dieting status (Question 10: “Are you currently on a diet?”) on the exact day of MedGem® testing. This question was correlated separately from the TDS tool The TDS score was also correlated with the four sections of the NAS to investigate associations of nutrition attitudes to dieting tendency. Regression Modeling Linear regression models were approached using a
manual hierarchical method where the most significant predictor was identified using simple correlations as the starting point. The next step would consider the significant variable(s) in combination with all other variables of interest. Evaluation of potential new models using this reiterative method considered the p values of the included variables and the significance of the 19 change in the R2 value as criteria for accepting the next best model. Once the "full" regression model was identified, the model was evaluated for goodness of fit, assumption for normality of distribution, collinearity of included variables, and the possibility of influential outliers. Specific statistical approaches for examining these newly-built models were followed (51). Goodness of fit was examined by plotting the actual versus the predicted residuals from the model. If the plot closely followed a 45 degree line between the x and y axis, the model was assumed an adequate fit. Similarly, the
residuals were helpful in checking the assumption of normal distribution of the regression variables by calculating the robust Shapiro-Wilk statistic where the assumption of normal distribution was accepted when p > 0.20 The collinearity of independent variables was judged by computing and screening for tolerance factors where the absolute value approached 1 and where the variance inflation factor (VIF) was less than 10. Examining these underlying assumptions for linear regression strengthens the proposed model. As an important step to ensure a general model that is not unduly influenced by outlying observations, two techniques to screen for outliers were applied, then any identified outliers were examined for undue influence on the model. The first method to identify outliers in the data relative to the dependent variable was to produce and examine the studentized deleted residual values where an absolute value greater than 2 was considered a potential outlier (51). A second method
to identify outliers with regards to the independent variables was performed by producing leverage values for each subject in the model and considering the criterion > 2(p/n) (p=number of independent variables, n=sample size) as a potential outlier (51). The next step was to look for high levels of 20 subject influence in the model using the DFFITS and Cook’s D methods. The DFFITS critical value of 2(p/n) 1/2 was manually calculated and compared to model output to identify cases with evidence of high influence. Assessment of the magnitude of influence for each case which was identified as an outlier was also completed using Cook’s D values compared to the F statistic at the 50th percentile. A Cook’s D value greater than or equal to criterion F value was construed to show substantial influence of the case on the model (51). Once each potential outlier was identified, the influence of the subject was examined according to these criteria to ensure a linear model that was not
highly influenced by a potential outlier. 21 CHAPTER 4 RESULTS Subject Characteristics A total of 38 college-aged females enrolled in the study. Thirty two of these original 38 subjects participated in our repeat questionnaire to document four week reliability of the NET tool. Descriptive statistics for subjects are included in Table 1 Informed consent was obtained prior to subject participation. The study was approved by the Institutional Review Board Human Subjects Committee at The Ohio State University, IRB Protocol Number 2005B0215. Characteristic Minimum Maximum Mean Std. Deviation Age (yrs) 19.00 25.00 21.29 1.58 Ht (cm) 152.00 176.50 16383 6.50 Wt (kg) 38.20 115.70 62.94 12.45 Waist (cm) 56.50 110.00 72.80 9.22 2 BMI (kg/m ) 15.21 40.99 23.37 3.94 Fat Mass(kg) 5.85 53.25 17.56 8.17 Lean Mass(kg) 32.35 62.45 45.38 6.21 %Body Fat (Brozek) 14.10 46.02 26.98 7.31 RMR (kcal) 990.00 1830.00 145368 194.71 Table 1. Subject characteristics (n=38) 22 Reliability and Validity
of Electronic Nutritional Screening Tool Reliability All subjects who completed the laboratory study were invited to repeat the NET questionnaire 4 weeks after initial completion. Thirty two of the 38 subjects (84%) completed the repeat task to document reliability. Using Somers’ D statistic, significant association was demonstrated for 58 of 59 questions in the FHQ, 23 of 24 questions in the NAS, and 14 of 15 questions in the TDS. Measures of significant association ranged from 0.309 – 10 for all NET questions, with more than 50% of questions measuring 05 or higher (all values detailed in Appendix C). Overall Pearson correlation produced a coefficient of r=0.924 for the average of the original FHQ as it was used in the RENO study, and a coefficient of r=0.918 for the average of the original questions plus three additional indicator questions used in this study to further quantify food choices. Both of these values are indicative of excellent reliability for the total average
score of the FHQ. Cronbach’s alpha was used to test for internal reliability of the NET questionnaire. Cronbach’s alpha for the original 49 questions from the RENO FHQ was 0.775 The FHQ plus three food group indicator questions from the ten questions added for this study, produced an α=0.738 based on 52 questions Cronbach’s alpha for the NAS and TDS were α=0.771 and α=0874 respectively (all values detailed in Appendix D) These alpha values for the FHQ, NAS and TDS show acceptable levels of internal reliability for each section of the NET questionnaire. 23 Validity The validity of the FHQ was investigated by comparing questionnaire responses to the participants’ 3-day food records. The relationship of FHQ average scores to intake of selected nutrients is shown in Table 2. Relationships of interest were identified prior to statistical analysis. FHQ Food Group Grain Average+ Grain Average w/question 6+ Vegetables and Fruits Average+ Vegetables and Fruits Average
w/question 8+ Dairy Average+ Dairy Average w/question 18+ Meat Average+ Other Average Fat Average+ Total FHQ Averages Original RENO FHQ Average+ Full FHQ Averaged+ Cal ns Pro (g) ns Carb (g) Fiber (g) ns ns ns ns Fat (g) .399* ns .405* ns ns ns ns ns Sat Fat (g) -.419* -.426* -.528* -.540* ns ns ns ns ns ns VitA (RAE) VitC (mg) .391* .424* ns .343* ns .406* -.381* -.374* .424* ns ns .338* ns .414* -.389* -.380* .437* ns +All positive scores adjusted (plus 1) to give equal weight to positive & negative values Ns = Correlation not significant, □ = Correlation not tested *Correlation is significant at the 0.05 level (2 tailed) *Correlation is significant at the 0.01 level (2 tailed) Table 2. Correlation of Average Scores from the Food Habits Questionnaire (FHQ) to Intake of Selected Nutrients from 3-Day Food Records Significant positive correlations were shown between FHQ vegetable and fruit average and intakes of fiber (r=.399, p<.05),
Vitamin A (r=391, p<05), and 24 Vitamin C (r=.424, p<01) Because of the focus on identifying fat intake in the original FHQ, low-fat choices were rewarded with higher point values. Lower averages on the FHQ dairy section and total of all categories of the FHQ were associated with higher intakes of total and saturated fat. Higher total averages of the FHQ (“healthier” choices) were correlated with higher intakes of protein, fiber and Vitamin A. Pearson correlation produced significant coefficients for averages of the FHQ vegetable and fruit category and number of servings from the United States Department of Agriculture’s MyPyramid vegetable (r=.491, p<01) and fruit (r=365, p<05) groups based on three-day food records. The average of the FHQ meat category was also significantly correlated (r=355, p<.05) with the number of servings from the Food Guide Pyramid meat group For a complete list of all FHQ and nutrient correlations examined, see Appendix D. Each of the
four factors on the NAS was scored and Pearson correlations were calculated between analyses of intakes of selected nutrients from participants’ three-day food records (all values detailed in Appendix E). Significant results are presented in Table 3. Higher scores on Factor 4, health concern, were significantly correlated with lower Calorie, carbohydrate, total fat and saturated fat intake. NAS Factor Calories Dietary Helplessness Food Exploration Meat Preference Health Concern ns ns ns *-0.445 Pro (g) ns *0.327 ns ns Carb (g) ns ns ns *-0.388 Fiber (g) ns ns *-0.457 ns Fat (g) ns ns ns *-0.405 Sat Fat (g) ns ns ns *-0.411 *Correlation is significant at the 0.05 level (2 tailed) *Correlation is significant at the 0.01 level (2 tailed) Table 3. Correlation of Scores from the Nutrition Attitude Survey (NAS) to Intake of Selected Nutrients from 3-Day Food Records 25 Tendency Towards Dieting Behaviors Gauged using the TDS and DIS Questionnaires The TDS questionnaire was
correlated with the DIS questionnaire to evaluate associations of dieting-related behaviors. Results of Pearson correlation produced an r=.383, (p<05) between the total TDS score and the total DIS score, and an r=373, (p<.05) between the total TDS score and current dieting status as reported on question 10 of the DIS instrument. Pearson correlations were also analyzed between TDS score and macronutrient content of the three-day food records, TDS score and selected anthropometric variables, and TDS score and the four sections of the NAS. There was a moderate association (r=.433, p<01) identified between TDS score and NAS factor 1 (dietary helplessness). No associations were detected between TDS score and %BF or RMR. Association of Food Habits and Behaviors to Resting Metabolic Rate The relationship of food habits and behaviors to RMR was investigated using linear regression. Pearson correlation coefficients were computed for RMR versus 25 variables of interest (Appendix F).
The most significant correlation (r=551, p<001) with RMR was kilograms of lean mass. This variable was used as the starting point for building a model based on hierarchical regression methods, using the variables with the lowest pvalues for model entry. A linear multivariate model containing four significant predictors of RMR was developed; and variables entered in this order; lean mass, age, NAS Factor 3 (meat preference), and FHQ dairy average. This model was able to explain approximately 26 53% (R2=.528) of the variability in RMR seen in this study (Appendix G) Regression coefficients and levels of significance for each variable are shown in Table 4. Predictors (Constant) Lean Mass (kg) Age (yrs) FHQ Dairy Average NAS 3 Meat Preference Unstandardized Coefficients β -831.760 15.715 50.811 102.750 15.759 Std. Error 429.296 3.777 15.836 50.402 6.078 Standardized Coefficients β 0.501 0.411 0.246 0.335 Significance 0.061 0.001 0.003 0.050 0.014 Dependent Variable: RMR
Table 4. Resting Metabolic Rate Regression Model Coefficients The assumption of normal distribution was checked using the Shapiro-Wilk statistic p>.20 applied to the model residuals as detailed previously It was concluded that the assumption of normality was not violated. Additionally, plotting of the predicted versus actual standardized residuals for the model closely followed a 45° line leading us to believe the model demonstrated adequate fit. Tolerance levels of 0855-0985 for the independent variables were indicative of acceptable collinearity. Studentized deleted residuals and leverage values were generated for the model and used to identify possible outlying observations. One potential outlier was identified with regard to the dependent variable and five potential outliers were identified relative to the independent variables. To test if these outlying cases were influential in the regression model, DFFITS and Cook’s D were computed. One outlier was identified as
influential, but based on a Cook’s D value of 0.086, it was determined that the influence of the case on the regression model was not substantial. All observations were retained in this model 27 In order to try to further validate the relationship of meat and dairy products in this model, the association of RMR and number of servings from the MyPyramid’s meat and dairy groups was also examined using analysis data from subjects’ three-day food records. A significant positive association (r=462, p=004) was observed between number of servings from the meat group and RMR. No significant relationship was noted between RMR and number of dairy servings. Association of Food Habits and Behaviors to Body Composition Linear regression was also used to investigate the relationship of food habits and behaviors to body composition. Univariate Pearson correlations for variables of interest (Appendix H) were calculated. Two variables, waist circumference and body mass index (BMI), were
found to have significant correlations (r=.755 and r=718, p<01) with percent body fat (%BF). However, when placed in a bivariate regression model, waist circumference remained significant (p=.034), but BMI did not Hierarchical regression methods were again used to attempt to build a model to predict the variability in %BF in our sample. Using waist circumference as the initial significant predictor of %BF, variables that indicated trends (p<.12) were added to the model for evaluation using all possible combinations of the variables of interest. The addition of the variables NAS Factor 4 (health concern) and carbohydrate intake produced a model that had significant p-values for waist circumference (p<.001) and NAS Factor 4 (p=.013), but only near-significant p-values for carbohydrate intake (p=.07) Using this marginal model to carry forward, the addition of the FHQ vegetable and fruit average variable yielded significance for carbohydrate intake (p=.037), but the 28 FHQ
vegetable and fruit average variable was not significant (p=.17), rendering this a less desirable model as well. Despite these flaws, this equation predicts approximately 66% (R2=.657) of the variability in %BF in our sample These relationships are of interest, but the procedure used to build the model was less than ideal, as trends were added during the process and we failed to identify a linear model where all variables are significant. The hierarchical regression procedure was repeated using BMI as the starting variable. The addition of the variables NAS Factor 4 and carbohydrate intake were again found to have trends toward significance, as was the case in the previous %BF model. The best model to predict %BF contained the variables BMI, NAS Factor 4 (health concern), and carbohydrate intake. All variables were significant at the α=05 level This model was able to predict approximately 61% (R2=.609) of the variability in %BF seen in our sample (model summarized in Appendix I).
Regression coefficients and significance levels are shown in Table 5. Predictors (Constant) BMI Health Concern Carbohydrate Unstandardized Coefficients β 14.413 1.336 -0.752 -0.020 Std. Error 8.056 0.201 0.287 0.010 Standardized Coefficients β 0.720 -0.306 -0.237 Significance 0.083 0.001 0.013 0.050 Dependent Variable: Brozek %BF Table 5. Percent Body Fat Regression Model Coefficients The assumption of normality of distribution was checked for both %BF regression models using the Shapiro-Wilk statistic p>.20 applied to the model residuals Plotting of 29 the predicted versus actual standardized residuals for both models followed a 45° line leading us to believe the model demonstrated adequate fit. Tolerance values for the independent variables were between 0.841-0980, demonstrating acceptable collinearity Studentized deleted residuals, leverage values, DFFITS and Cook’s D values were generated for both models, as in the RMR regression model. After examining these
statistics, two influential outliers were identified for each regression model. Using Cook’s D values, the magnitude of influence of these cases was determined to be well below the acceptable criterion (the 50th percentile of the F distribution), implying that no outlying cases were having a substantial impact on the regression models. 30 CHAPTER 5 DISCUSSION The ability to accurately estimate nutritional adequacy is an important part of the development of effective nutrition intervention strategies for healthy weight management. In order to evaluate food habits and behaviors, valid and reliable nutritional assessment tools are needed. Electronic tools provide both an efficient and convenient method of gathering dietary information. In the current study, the reliability and validity of the NET questionnaire was examined. Excellent overall test-retest reliability was demonstrated using Pearson correlation. Since reliability coefficients increase as the heterogeneity of the
subjects increases (52) this is especially noteworthy, as our sample was more homogenous in age and gender than that comprising the RENO diet-heart study sample. Internal consistency was measured using Cronbach’s alpha for each NET section. Alpha values of over 0.7 for the FHQ, NAS and TDS, point to very high internal reliability within each section of the NET. The validity of the FHQ was investigated using three-day food records. Indicators of “healthier” choices from analysis of food records such as higher intakes of fiber and Vitamin A, and lower intakes of total fat and saturated fat, were significantly correlated with the overall average FHQ score. This strengthens the criterion-related validity of the 31 FHQ, as we would expect a “healthier” diet to be higher in fiber and Vitamin A content and lower in total fat and saturated fat intake. Several moderate correlations were identified with individual sections of the FHQ and nutrients recorded from food records,
leading us to believe the tool has validity in this population. Although the FHQ does not quantify food intake, this method of gathering dietary data may prove beneficial in situations where completion of lengthy food records is unrealistic or a measure of overall dietary quality is desired. The FHQ also happens to include educational feedback to the subject about whole grains, fat content and other chemo-preventative and heart-health components of the diet. The NAS showed significant correlations with several macronutrients from food record analyses. Factor 2, food exploration, positively correlated with protein intake, while Factor 3, meat preference, negatively correlated with fiber. The NAS Factor 4 (health concern) is negatively correlated with Calorie, carbohydrate, total fat, and saturated fat intakes. It is interesting to note that health concern was one of the significant variables in the regression equation predicting %BF. Increases in the health concern factor correlated
with decreases in %BF. Completion of only five questions (as contained in this factor of the NAS) assessing health concern may give insights into dietary habits that could be useful in clinical settings. Another significant negative predictor of %BF in our regression models was carbohydrate intake. This implies that higher carbohydrate in the diet is associated with lower %BF in this sample. This is contrary to many popular dieting plans that advocate low carbohydrate intakes to lose weight and presumably, body fat. It is a possibility that more physically active individuals who may have lower body fat realize the importance 32 of carbohydrate to fuel the muscles. The TDS was not significantly associated with %BF or RMR in our data. When relationships between nutrition attitudes and tendency to diet were investigated, significant correlation was shown between total TDS score and NAS Factor 1 (dietary helplessness), as well as between the total DIS score. The fact that the NAS
measures long-term attitudes may make it a useful instrument to associate with the TDS, as the TDS is attempting to measure behaviors or attitudes contributing to chronic dietary restraint. Though these relationships are interesting, they do not provide enough evidence to support our hypothesis that those females who tend to exhibit chronic dieting behaviors suppress their metabolism and increase body fatness. The regression model identified from this sample to predict resting metabolic rate included two variables from well-known RMR predictive equations, lean mass and age. However, age was positively correlated with RMR in our research. Though we suspect this may be an artifact of having nutrition graduate students in the study, this deserves further investigation. It is possible that those students who were older may have had more formal instruction in nutrition which may have positively affected their health habits, while those who were younger may have had more unhealthy
lifestyles. A second possibility is that higher education in general may be related to improvement in health habits, in which case graduate students would be expected to have healthier lifestyles than younger undergraduate students. If the latter scenario is true, then our observation may be specific to college students overall, which deserves further study. The other variables included in the RMR regression model, FHQ dairy average and NAS Factor 3 (meat preference), suggest that a higher intake of low-fat dairy products 33 and a higher preference for meat have a positive relationship to RMR. Both meat preference and number of servings of meat from the MyPyramid group demonstrated a significant positive correlation with RMR. However, neither of these independent variables addressed lean versus high-fat meat consumption or preference. We were able to indirectly examine the association of type of dairy products to RMR by using the total dairy servings from the MyPyramid and the FHQ
dairy average variables. The distinction between low-fat and high-fat dairy intake may be important, as number of total dairy servings from the Food Guide Pyramid did not correlate with RMR, but FHQ dairy average, which increases with more frequent use of low-fat dairy products, did show significant association with RMR. Further investigation into the association between lowfat dairy consumption, meat preference, and RMR may be warranted 34 CHAPTER 6 EPILOGUE Limitations and Recommendations for Future Research The educational component of the FHQ was a potential confounding factor with regards to the test-retest reliability of the tool. Subjects could have been motivated by this feedback to make behavioral changes from the time they completed the NET for the first time and the 4-week repeat of the questionnaire. Despite this possibility, Pearson correlation coefficients indicate good reliability for the FHQ. In the current research, the majority of subjects were from
undergraduate and graduate level nutrition classes. This sample may have been biased in favor of a “healthier” population than may typically be seen in female college students age 19-25. The number of subjects in the sample is another factor to consider when evaluating this research. A sample size larger than 30 was chosen to meet guidelines of the central limit theorom (53), but a sample of 38 may still lack the power needed to detect significant differences in data. Variability in the sample, especially related to resting metabolic rate and body fatness may have had an impact on our inability to identify relationships between these variables and tendency to diet. In our sample, 14 subjects were above 30% body fat and 24 subjects were below 30% body fat, with a mean of 35 approximately 26%. The range for %BF was 14-46% This wide range may have made it difficult to detect associations related to this variable. RMR was also widely distributed, with a range of 990-1830
kilocalories per day. Self-reported food intake is another limitation of this study. Although 3-day food intake records are considered the”gold standard” for comparison of dietary data, they are not without problems. Self-reported food intake is often underestimated and of questionable acccuracy (54). We attempted to address these issues by giving instructions to subjects on the detail needed for accurate records during information sessions prior to initiation of the study, providing an example food record that was available via the internet, and having a Registered Dietitian review and clarify records with the subjects using a multi-pass method at their scheduled laboratory visit. However,weighing or measuring food consumption offers an alternative approach to collection of dietary information, and may be the preferred method in future research. Although the ESHA Food Processor® SQL software is a research quality database, limitations of the dietary analysis must also be
considered. Many items specific to local food establishments were not listed in the database, so the best alternative was chosen based on the judgement of the Registered Dietitian. This is a potential source of bias in the nutritional analysis. Methods used to estimate/measure body composition and metabolic rate must also be considered. Both the MedGem and BodPod have been well-validated in multiple populations as noted previously. Though they have been deemed accurate for research purposes, the use of a metabolic cart to estimate RMR and underwater weighing to estimate body composition may provide additional accuracy. For our purposes, the 36 MedGem and BodPod offered reliable, valid methods of obtaining measurements that were well-accepted by all of our subjects. Recognizing the metabolic cart and underwater weighing are the research standards, we chose methods that seem more widely available and tolerated. Finally, this research used a cross-sectional correlational design which
only allows relationships to be examined. Though associations were found between variables such as health concern and %BF, carbohydrate intake and %BF, low-fat dairy intake and RMR, and meat preference and RMR, future research using higher level research designs is needed to draw stronger conclusions regarding these findings. Conclusions Valid and reliable nutritional assessment tools that are not lengthy and burdensome to complete are needed to aid in accurate collection of dietary information for research and clinical purposes. The first aim of this study was to evaluate the reliability and validity of an electronic nutritional screening tool in a sample of female college students. Excellent overall reliability of the NET tool was demonstrated in our sample of 38 females between the ages of 18-26 years old. Several significant correlations were identified between the NET questionnaire and analysis of subjects’ three-day food records, supporting the validity of the tool in this
population. The second aim of our research was to examine the relationship of food habits and behaviors to resting metabolic rate and body composition. Specifically, we were interested in the impact of dieting-related behaviors on these two variables. Our results did not lend strong evidence to support the hypothesis that those females who tend to 37 chronically diet depress their metabolism and increase their body fatness. We were able to identify two regression models from this sample predictive of resting metabolic rate and percent body fat. The model that best predicted resting metabolic rate in our sample included the variables of lean mass, age, average low-fat dairy use, and meat preference. All four of these variables were positively correlated with RMR. The relationship of higher low-fat diary use, higher meat preference, and higher RMR was an interesting finding from this study. The second significant regression model identified three predictors of %BF; BMI, health
concern, and carbohydrate intake. The variables of health concern and carbohydrate intake were negatively correlated with %BF, implying that increased health concern and increased carbohydrate intake were associated with lower %BF in this sample. Future research is needed to add insight into the impact of low-fat dairy use, meat preference, health concern, and carbohydrate intake on body composition and metabolism. 38 LISTS OF REFERENCES 1. Boutelle, K, Neumark-Sztainer, D, Story, M & Resnick, M (2002) Weight control behaviors among obese, overweight, and nonoverweight adolescents. Journal of pediatric psychology 27: 531-540. 2. Neumark-Sztainer, D, Hannan, P J, Story, M & Perry, C L (2004) Weight-control behaviors among adolescent girls and boys: implications for dietary intake. Journal of the American Dietetic Association 104: 913-920. 3. Packard, P & Krogstrand, K S (2002) Half of rural girls aged 8 to 17 years report weight concerns and dietary changes, with both
more prevalent with increased age. J Am Diet Assoc 102: 672-677. 4. Serdula, M K, Mokdad, A H, Williamson, D F, Galuska, D A, Mendlein, J M & Heath, G. W (1999) Prevalence of attempting weight loss and strategies for controlling weight. Jama 282: 1353-1358 5. Brownell, K D, Steen, S N & Wilmore, J H (1987) Weight regulation practices in athletes: analysis of metabolic and health effect. MSSE 19: 546-556 6. Kajioka, T, Tsuzuku, S, Shimokata, H & Sato, Y (2002) Effects of intentional weight cycling on non-obese young women. Metabolism 51: 149-154 7. Silverstein, L J, Scott, B J & Zahrt, H (1997) Dietary Quality: The Food Habits Questionnaire. In: Obesity Assessment Tools, Methods, Interpretations (St Jeor, S T, ed.), pp 281-291 Chapman Hall, New York 8. St Jeor, S T (1997) Obesity Assessment: Tools, Methods Interpretations Chapman & Hall, New York. 9. Hollis, J F, Carmody, T P & Conner, S L (1987) The Nutrition Attitudes Survey: Associations with dietary
habits, 39psychological and physical well-being, and coronary risk factors. Health Psych 5: 359-374 10. Center for Disease Control (2005) http://www.cdcgov/nccdphp/dnpa/obesity/trend/maps/ 11. Dulloo, A G & Jacquet, J (1998) Adaptive reduction in basal metabolic rate in response to food deprivation in humans: a role for feedback signals from fat stores. The American Journal of Clinical Nutrition 68: 599-606. 12. Weyer, C, Walford, R L, Harper, I T, Milner, M, MacCallum, T, Tataranni, P A & Ravussin, E. (2000) Energy metabolism after 2 y of energy restriction: the biosphere 2 experiment. Am J Clin Nutr 72: 946-953 13. Rideout, C A, McLean, J A & Barr, S I (2004) Women with high scores for cognitive dietary restraint choose foods lower in fat and energy. J Am Diet Assoc 104: 1154-1157. 14. McCargar, L J & McBurney, R F (1999) The Chronic Dieting Syndrome: Metabolic and Behavioural Characteristics. CanJDietPractRes 60: 227-230 15. Elliot, D L, Goldberg, L, Kuehl,
K S & Bennett, W M (1989) Sustained depression of the resting metabolic rate after massive weight loss. American Journal of Clinical Nutrition 49: 93-96. 16. Sweeney, M E, Hill, J O, Heller, P A, Baney, R & DiGirolamo, M (1993) Severe vs moderate energy restriction with and without exercise in the treatment of obesity: efficiency of weight loss. Am J Clin Nutr 57: 127-134 17. Gingras, J R, Harber, V, Field, C J & McCargar, L J (2000) Metabolic assessment of female chronic dieters with either normal or low resting energy expenditures. The American Journal of Clinical Nutrition 71: 1413-1420 40 18. Wadden, T A, Bartlett, S, Letizia, K A, Foster, G D, Stunkard, A J & Conill, A (1992) Relationship of dieting history to resting metabolic rate, body composition, eating behavior, and subsequent weight loss. Am J Clin Nutr 56: 203S-208S 19. Keim, N L & Horn, W F (2004) Restrained eating behavior and the metabolic response to dietary energy restriction in women. Obes
Res 12: 141-149 20. Beiseigel, J M & Nickols-Richardson, S M (2004) Cognitive eating restraint scores are associated with body fatness but not with other measures of dieting in women. Appetite 43: 47-53. 21. de Lauzon-Guillain, B, Basdevant, A, Romon, M, Karlsson, J, Borys, J M & Charles, M. A (2006) Is restrained eating a risk factor for weight gain in a general population? Am J Clin Nutr 83: 132-138. 22. Tiggemann, M (2004) Dietary restraint and self-esteem as predictors of weight gain over an 8-year time period. Eat Behav 5: 251-259 23. Deutz, R C, Bernardot, D, Martin, D E & Cody, M M (2000) Relationship between energy deficits and body composition in elite female gymnasts and runners. MSSE 32: 659-668. 24. Wallner, S J, Luschnigg, N, Schnedl, W J, Lahousen, T, Sudi, K, Crailsheim, K, Moller, R., Tafeit, E & Horejsi, R (2004) Body fat distribution of overweight females with a history of weight cycling. Int J Obes Relat Metab Disord 28: 1143-1148 25. Paul, D R,
Novotny, J A & Rumpler, W V (2004) Effects of the interaction of sex and food intake on the relation between energy expenditure and body composition. The American Journal of Clinical Nutrition 79: 385-389. 41 26. Liebman, M, Cameron, B A, Carson, D K, Brown, D M & Meyer, S S (2001) Dietary fat reduction behaviors in college students: relationship to dieting status, gender and key psychosocial variables. Appetite 36: 51-56 27. Glasgow, R E, Perry, J D, Toobert, D J & Hollis, J F (1996) Brief assessments of dietary behavior in field settings. Addictive Behaviors 21: 239-247 28. Neuhouser, M L, Kristal, A R, McLerran, D, Patterson, R E & Atkinson, J (1999) Validity of short food frequency questionnaires used in cancer chemoprevention trials: results from the Prostate Cancer Prevention Trial. Cancer Epidemiology, Biomarkers and Prevention 8: 721-725. 29. Potosky, A L, Block, G & Hartman, A M (1990) The apparent validity of diet questionnaires is influenced by
number of diet-record days used for comparison. Journal of the American Dietetic Association 90: 810-813. 30. Shannon, J, Kristal, A R, Curry, S J & Beresford, S A A (1997) Application of a behavioral approach to measuring dietary change: The Fat- and Fiber-related Diet Behavior Questionnaire. Cancer Epidemiology, Biomarkers and Prevention 6: 355-361 31. Kristal, A R, Shattuck, A L & Henry, H J (1990) Patterns of dietary behavior associated with seldecting diets low in fat: reliability and validity of a behavioral approach to dietary assessment. Journal of the American Dietetic Association 90: 214220 32. Subar, A F, Thompson, F E, Kipnis, V, Midthune, D, Hurwitz, P, McNutt, S, McIntosh, A. & Rosenfeld, S (2001) Comparative validation of the Block, Willett, and National Cancer Institute Food Frequency Questionnaires. American Journal of Epidemiology 154: 1089-1098. 33. Kayman, S & Brunner, R L (1997) Dieting Behaviors In: Obesity Assessment Tools, Methods,
Interpretations (St. Jeor, S T, ed), pp 352-362 Chapman and Hall, New York. 42 34. Stice, E, Ozer, S & Kees, M (1997) Relation of dietary restraint to bulimic symptomatology: the effects of the criterion confounding of the Restraint Scale. Behav Res Ther 35: 145-152. 35. Heyward, V H & Wagner, D R (2004) Applied Body Composition Assessment, Second ed. Human Kinetics, Champaign 36. Dempster, P & Aitkens, S (1995) A new air displacement method for the determination of human body composition. MSSE 27: 1692-1697 37. McCrory, M A, Gomez, T D, Bernauer, E M & Molé, P (1995) Evaluation of a new air displacement plethysmograph for measuring human body composition. MSSE: 1686-1691. 38. Fields, D A & Hunter, G R (2004) Monitoring body fat in the elderly: application of air-displacement plethysmography. Current Opinion in Clinical Nutrition and Metabolic Care 7: 11-14. 39. Maddalozzo, G F, Cardinal, B J & Snow, C M (2002) Concurrent validity of the BOD POD and
dual energy x-ray absorptiometry techniques for assessing body composition in young women. Journal of the American Dietetic Association 102: 16771679 40. Nicholson, J C, Duffie, M C, Jr, Bonat, S H, Russell, D L, Boyce, K A, McCann, S., Michael, M, Sebring, N G, Reynolds, J C & Yanovski, J A (2001) Estimation of body fatness by air displacement plethysmography in African American and white children. Pediatric Research 50: 467-473 41. Utter, A C, Goss, F L, Swan, P D, Harris, G S, Robertson, R J & Trone, G A (2003) Evaluation of air displacement for assessing body composition of collegiate wrestlers. MSSE 35: 500-505 43 42. Weyers, A M, Mazzetti, S A, Love, D M, Gomez, A L, Kraemer, W J & Volek, J. S (2002) Comparison of methods for assessing body composition changes during weight loss. MSSE 34: 497-502 43. Petroni, M L, Bertoli, S, Maggioni, M, Morini, P, Battezzati, A, Tagliaferri, M A., Liuzzi, A & Testolin, G (2003) Feasibility of air plethysmography (BOD POD)
in morbid obesity: a pilot study. Acta Diabetologica 40: S59-S62 44. Melanson, E L, Coelho, L B, Tran, Z V, Haugen, H A, JKearney, J T & Hill, J O. (2003) Validation of the Gem Hand-held Indirect Calorimeter Nutrition Week, San Antonio, TX. 45. Nieman, D C, Trone, G A & Austin, M D (2003) A new handheld device for measuring resting metabolic rate and oxygen consumption. J Am Diet Assoc 103: 588592 46. Nieman, D C, Trone, G & Austin, M (2001) Validation for a new handheld device for measuring resting metabolic rate [abstract]. North American Association for the Study of Obesity, October 9, 2001. 47. Stewart, C L, Goody, C M & Branson, R (2005) Comparison of two systems of measuring energy expenditure. JPEN J Parenter Enteral Nutr 29: 212-217 48. St-Onge, M P, Rubiano, F, Jones, A, Jr & Heymsfield, S B (2004) A new handheld indirect calorimeter to measure postprandial energy expenditure Obes Res 12: 704709 49. Nieman, D C, Austin, M D, Chilcote, S M &
Benezra, L (2005) Validation of a new handheld device for measuring resting metabolic rate and oxygen consumption in children. International journal of sport nutrition and exercise metabolism 15: 186-194 44 50. (2005-06) The Food Processor SQL Nutrition Analysis and Fitness Software ESHA Research. 51. Neter, J, Kutner, M, Nachtsheim, C, and Wasserman, W (1996) Applied Linear Regression Models, Third ed. The McGraw-Hill Companies, Inc, Chicago 52. Ary, D, Jacobs L, Razavieh A (1985) Introduction to Research in Education, 3 ed CBS College Publishing. 53. King, B a M E (2003) Statistical Reasoning in Psychology and Education, Fourth ed. John Wiley & Sons 54. Block, G (1989) Human dietary assessment: methods and issues Prev Med 18: 653660 45
 Szovjet-orosz elbeszélő, regény- és drámaíró1871. május 11-én született Kijevben.Apja a Hittudományi Akadémia professzora, anyja tanárnő volt.1909-ben felveszik az orvosi karra, s a világháború első esztendeiben kórházi munkát végez mint orvostanhallgató. 1913-ban megnősül, s tanulmányait ‘16-ban fejezi be. Egy járási kórházban, majd frontkórházakban kezdi

