Comments
No comments yet. You can be the first!
What did others read after this?


Content extract
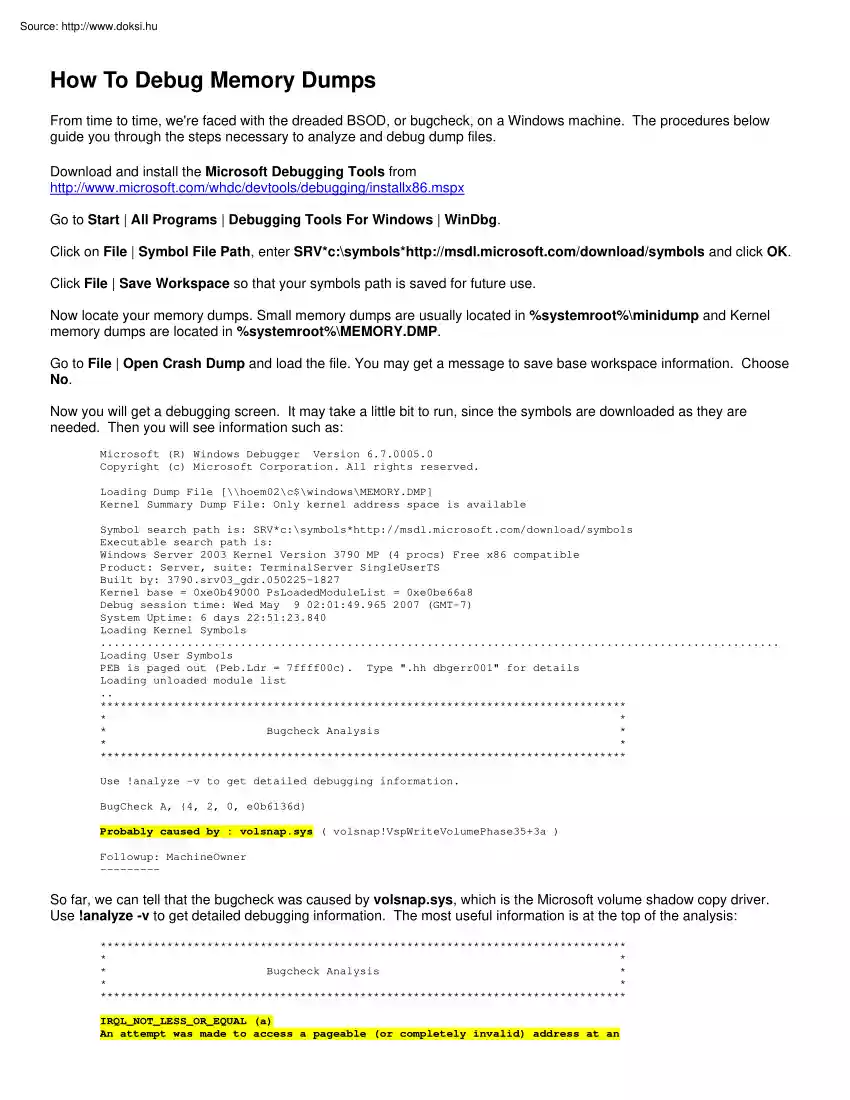
How To Debug Memory Dumps From time to time, we're faced with the dreaded BSOD, or bugcheck, on a Windows machine. The procedures below guide you through the steps necessary to analyze and debug dump files. Download and install the Microsoft Debugging Tools from http://www.microsoftcom/whdc/devtools/debugging/installx86mspx Go to Start | All Programs | Debugging Tools For Windows | WinDbg. Click on File | Symbol File Path, enter SRV*c:symbolshttp://msdl.microsoftcom/download/symbols and click OK Click File | Save Workspace so that your symbols path is saved for future use. Now locate your memory dumps. Small memory dumps are usually located in %systemroot%minidump and Kernel memory dumps are located in %systemroot%MEMORY.DMP Go to File | Open Crash Dump and load the file. You may get a message to save base workspace information Choose No. Now you will get a debugging screen. It may take a little bit to run, since the symbols are downloaded as they are needed. Then you will see
information such as: Microsoft (R) Windows Debugger Version 6.700050 Copyright (c) Microsoft Corporation. All rights reserved Loading Dump File [\hoem02c$windowsMEMORY.DMP] Kernel Summary Dump File: Only kernel address space is available Symbol search path is: SRV*c:symbolshttp://msdl.microsoftcom/download/symbols Executable search path is: Windows Server 2003 Kernel Version 3790 MP (4 procs) Free x86 compatible Product: Server, suite: TerminalServer SingleUserTS Built by: 3790.srv03 gdr050225-1827 Kernel base = 0xe0b49000 PsLoadedModuleList = 0xe0be66a8 Debug session time: Wed May 9 02:01:49.965 2007 (GMT-7) System Uptime: 6 days 22:51:23.840 Loading Kernel Symbols . Loading User Symbols PEB is paged out (Peb.Ldr = 7ffff00c) Type "hh dbgerr001" for details Loading unloaded module list . * * * * Bugcheck Analysis * * * * Use !analyze -v to get detailed debugging information. BugCheck A, {4, 2, 0, e0b6136d} Probably caused by : volsnap.sys ( volsnap!VspWriteVolumePhase35+3a )
Followup: MachineOwner --------- So far, we can tell that the bugcheck was caused by volsnap.sys, which is the Microsoft volume shadow copy driver Use !analyze -v to get detailed debugging information. The most useful information is at the top of the analysis: * * * * Bugcheck Analysis * * * * IRQL NOT LESS OR EQUAL (a) An attempt was made to access a pageable (or completely invalid) address at an interrupt request level (IRQL) that is too high. This is usually caused by drivers using improper addresses. If a kernel debugger is available get the stack backtrace. Arguments: Arg1: 00000004, memory referenced Arg2: 00000002, IRQL Arg3: 00000000, value 0 = read operation, 1 = write operation Arg4: e0b6136d, address which referenced memory From here, we can tell that volsnap.sys tried to read memory from an IRQL that was too high This is usually caused by a bad driver, in this case, volsnap.sys Next, let's find out what process was calling volsnap.sys Enter !thread in the kd>
command line input box and look for the line that begins with Owning Process: 2: kd> !thread THREAD faa03658 Cid 0568.1954 Teb: 7ffac000 Win32Thread: 00000000 RUNNING on processor 2 Not impersonating DeviceMap e1003978 Owning Process fc1913b0 Image: cvd.exe Wait Start TickCount 38443765 Ticks: 0 Now enter !process fc1913b0 0 (the hex number of the Owning Process) , a space and the number 0. 2: kd> !process fc1913b0 0 PROCESS fc1913b0 SessionId: 0 Cid: 0568 Peb: 7ffff000 ParentCid: 0218 DirBase: dd4a3000 ObjectTable: e141a910 HandleCount: 475. Image: cvd.exe We can now tell that the cvd.exe process (in this case, Commvault) called the volsnapsys driver Since volsnapsys is a Microsoft driver, a quick check on TechNet reveals that there is an updated VSS package available for our server (http://support.microsoftcom/kb/887827) which addresses the problem Note: Writing debugging information must be configured on the machine prior to the BSOD in order to get a memory dump. This is
done in the Advanced tab of system properties Set it to "Kernel memory dump" in order to get the process information