Comments
No comments yet. You can be the first!


Content extract
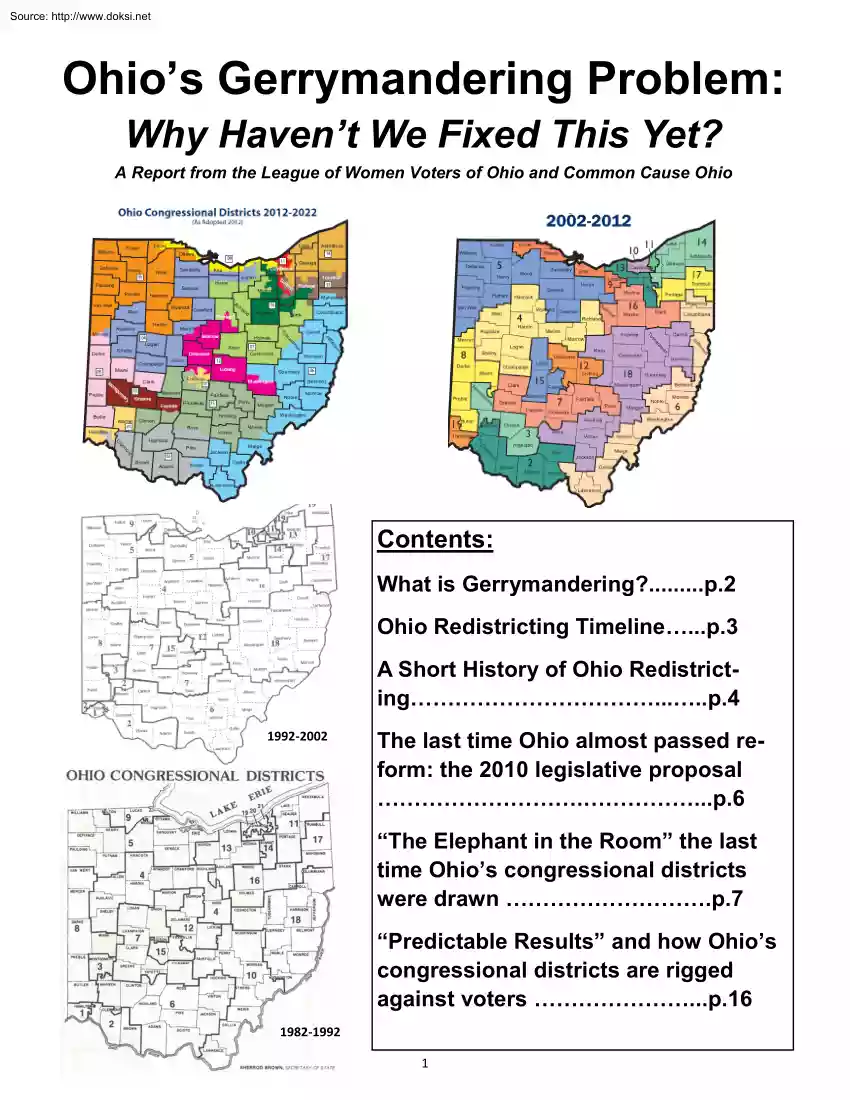
Source: http://www.doksinet Ohio’s Gerrymandering Problem: Why Haven’t We Fixed This Yet? A Report from the League of Women Voters of Ohio and Common Cause Ohio Contents: What is Gerrymandering?.p2 Ohio Redistricting Timeline.p3 A Short History of Ohio Redistricting.p4 1992-2002 The last time Ohio almost passed reform: the 2010 legislative proposal .p6 “The Elephant in the Room” the last time Ohio’s congressional districts were drawn .p7 “Predictable Results” and how Ohio’s congressional districts are rigged against voters .p16 1982-1992 1 Source: http://www.doksinet What is Gerrymandering? Redistricting 101: Why do we redraw districts? • Every ten years the US Census is conducted to measure population changes. • The US Supreme Court has said all legislative districts should have roughly the same population so that everyone’s vote counts equally. This is commonly referred to as “one person, one vote” • In the year following the Census, districts
are redrawn to account for people moving into or out of an area and adjusted so that districts again have equal population and, for US House districts, may change depending on the number of districts Ohio is entitled to have. • While the total number of state general assembly districts is fixed -- 99 Ohio House and 33 Ohio Senate districts -- the number of US House districts allocated to each state may change following the US Census depending on that state’s proportion of the total US population. For example, following the 2010 Census, Ohio lost two US House seats, going from 18 US House seats in 2002-2012 to 16 seats in 2012-2022. What is Gerrymandering? • Gerrymandering is the manipulation of political districts to rig the outcome of elections to favor one political party or candidate over another. • Both Republicans and Democrats have done it when they controlled districting. In Ohio, US House districts are drawn by the General Assembly, with a simple majority needed
for approval. • This type of map-making reduces voter choices and leads to fewer competitive elections and elected officials who are less accountable to their constituents. • How do map-makers create unfair districts? The two main ways are called “packing” & “cracking.” The party that has the majority can pack voters of the minority party into one district so that they reduce the number of minority party districts. The majority party can also crack voters of the minority party into the remaining districts to dilute their voting power. 2 Source: http://www.doksinet 3 Source: http://www.doksinet A Short History of Ohio Redistricting Advocates of fair elections have been working on redistricting reform for more than 35 years. In 1981, a constitutional amendment was placed on the Ohio ballot to change the method of state legislative and congressional redistricting to a more formulaic, mathematical approach that favored compact dis- “It wasn’t fun drawing the
districts and moving them through the tricts. courts, but it was all worth it when In 1981, David L. Horn, an agricultural engineer from Ath- the results of the 1972 election were ens County, told the Cleveland Plain Dealer, “I was counted. We won the majority in the cleaning out a ditch when I thought about compactness of [Ohio] House 58-41, an increase of districts, a mathematical relationship.” 13 seats for the Democrats. That’s the power of the pencil.” This idea grew to become Issue 2, the Fair and Impartial Redistricting (FAIR) proposal. - Former Speaker Vern Riffe Whatever’s Fair: The Political AutobiThis amendment was supported by good government or- ography of the Ohio House Speaker ganizations such as the League of Women Voters of Vern Riffe Ohio, as well as by the Ohio Republican Party. Joe Elton, the coordinator of the committee, said, “It’s easy for Republicans to be for good government when they’re down and out. However, I honestly believe that the
adoption of the FAIR amendment will be in the best interests of both the Republican and Democrat parties over the long run.” This redistricting reform effort was opposed by the Democrats and their allies, who at that time controlled the redistricting process and saw no need to change it. It’s hard to fight fairness but Ohioans saw Issue 2 of 1981 as a partisan issue, rather than a change to ensure good government. The opposition questioned the rigid mathematical formula of compactness and the amendment was soundly rejected by the voters Following this defeat, Joan Lawrence, vice chair of the Committee for Fair and Impartial Redistricting commented, “Who would try again?” The answer to the question was Joan Lawrence and the League of Women Voters. Representative Joan Lawrence (R-Galena, 1983-1999) led the way by introducing redistricting reform legislation every year that she served in the Ohio General Assembly. 4 “I support the FAIR constitutional amendment. I believe this
proposal integrates fair play and common sense into our election process. Gerrymandering is not a Republican or Democrat problem. It is a fundamental problem of government that must be corrected.” - Former Governor James A. Rhodes in a July 3, 1981 letter to Benson Wolman and Robert S. Graetz Source: http://www.doksinet Throughout the 1980s and the 1990s the League of Women Voters of Ohio and its allies including David L. Horn tried to keep redistricting on the front burner In 1999, the League even attempted to collect signatures for a redistricting reform ballot measure focused on compactness but came up short. When Democrats lost control of the Apportionment Board (the body tasked with drawing districts for the state legislature) in 1990, they became more sympathetic to changing the system but unsurprisingly, Republicans had lost their enthusiasm for change. The Republicans held on to the Apportionment Board, the legislature, and the Governor’s office through the 2000
elections and thus saw no need to change the system for the post-2000 redistricting. In 2005, a coalition of individuals and organizations came together under the rubric of Reform Ohio Now (RON) to promote a package of four constitutional amendments, one of which dealt with state legislative and congressional redistricting. The RON redistricting amendment also took a formulaic, mathematical approach, only this time the main criterion was competitiveness. As the chair of the Ohio Democratic Party, Paul Tipps opposed redistricting reform in 1981. In 2005, following his retirement from a high profile career as a lobbyistand with the Democrats out of power Tipps became one of the biggest proponents for ending “pay to play” and gerrymandering. RON included some academics, some good government organizations, some labor unions, and some Democrats but very few Republicans. Ultimately, the Ohio Republican Party and many prominent Republicans opposed the RON amendments. The Ohio Democratic
Party did not endorse the amendments, with some county organizations supporting the reform and some opposing. The Reform Ohio Now amendments were overwhelmingly rejected by the voters. The Republican opposition was not surprising since the GOP controlled the existing process. But the tepid Democratic organizational support was somewhat surprising One explanation given for the weak Democratic support was the expectation of many Democrats that they would sweep the 2006 and 2010 elections and thus control the post-2010 redistricting process. Recent legislative efforts began over a decade ago. 2006 saw the emergence of a strong Republican advocate for redistricting reformJon Husted. During the debate over the RON redistricting amendment in 2005, its leading Republican opponents then House Speaker Jon Husted (R- Kettering) and then Ohio Representative Kevin DeWine (RFairborn) acknowledged that Ohio’s method of redistricting was flawed. While arguing that the RON amendment was not the
solution, they pledged to take up the issue of redistricting reform in 2006, if RON was defeated. 5 Source: http://www.doksinet Speaker Husted and Representative DeWine kept their word, negotiating with various reform groups and some Democrats. Their 2006 proposal would have placed Ohio in a national leadership position, since it explicitly included competition as a secondary criterion in choosing a redistricting plan, with compactness as the primary goal. When the time came for a legislative vote to approve an amendment for the ballot, only one Democrat supported the proposal and it failed While the reasons for this result are complex, it appears that Democrats did not trust the Republicans or did not want the Republicans to get credit for political reform. Andperhaps most importantlythey believed that there was no need to change a system that might soon benefit them The last time Ohio almost passed reform: the 2010 legislative proposal Redistricting reform again took center
stage at the Statehouse in the 128th General Assembly (2009 -2010) when the Ohio House was dominated by Democrats and the Ohio Senate by Republicans. A redistricting reform measure sponsored by then State Senator Jon Husted was approved by the Republican Senate in September 2009. This resolution would have created the Ohio Redistricting Commission to draw state legislative and congressional districts with rules focused on compactness, with competitiveness as a secondary goal. Then in May 2010, the Democratic-controlled House passed a different proposal sponsored by then Representatives Tom Letson (D-Warren) and Jennifer Garrison (D-Marietta) and strongly supported by then Speaker Armond Budish (D-Beachwood). This proposal which addressed state legislative and congressional redistricting focused on establishing rules for mapmaking and would have established a public competition for redrawing district lines similar to a 2009 competition sponsored by the Ohio Secretary of State, the
League of Women Voters of Ohio, Common Cause Ohio and Ohio Citizen Action. As former Speaker, Husted used his floor privileges to encourage fellow Republicans to support the Democratic proposal with the hope of merging the two redistricting reform measures through negotiation and the measure was supported by both Democrats and Republicans 69-28. The mapmaking requirements of the Ohio House plan focused on creating compact districts, keeping political subdivisions together, creating as many competitive districts as possible and fair representationthe partisan leanings of state legislative and congressional districts should reflect the statewide partisan vote. This plan also included prohibitions on gerrymandering Merging the two alternatives looked possible. One primarily focused on establishing a bipartisan commission for mapmaking with few rules; the other on establishing strong guidelines or rules. Unfortunately, the Ohio House and the Ohio Senate were unable to reconcile the two
different versions leaving the Ohio Apportionment Board – the Governor, the Secretary of State, the Auditor of State, one legislative Democrat, and one legislative Republican responsible for drawing new state legislative district lines and the state legislature responsible for the Congressional districts. 6 Source: http://www.doksinet Ohio Redistricting Reform Competition 2011 In 2011, redistricting reform advocates joined forces to create the Ohio Campaign for Accountable Redistricting. Together, they held a real-time competition using census data and partisan information from Cleveland State University. This gave citizens the opportunity to draw state legislative and congressional districts Criteria for the 2011 Ohio Redistricting Competition focused on the following: 1) compactness, 2.) competitiveness, 3) representational fairness (requiring maps to reflect the partisan makeup of Ohio as a whole), and 4) respect for county and municipal boundaries Mapmakers were also give
guidance on how to create majority-minority districts. While the 2011 competition focused on both state legislative and congressional districts and gave ordinary Ohioans the opportunity to better understand redistricting and highlighted the problems with the way Ohio draws state legislative and congressional lines, it did not impact the actual mapmaking. “The Elephant in the Room” the last time Ohio’s congressional districts were drawn Editor’s note: “Ohio Redistricting Transparency Report: The Elephant in the Room” was originally published in December 2011. The full report, complete with citations to the public records published in the appendices can be found at bit.ly/OhRedistReports The 2011 redistricting process was in many ways “business as usual.” The party in power used the process to gain maximum political advantage. The minority party was shut out Public input was ignored The result was the approval of new districts that will provide for largely predetermined
elections where we will know which party will win before we even know who the can- How power was used in the political backrooms to manipulate districts to benefit the political insiders. didates are. The districts were drawn and critical decisions were made in the backrooms outside of public view. When maps were unveiled, they were raced through the process in an effort to avoid public scrutiny. The elephant in the room that those drawing the maps would not publicly acknowledge drove the process. While the Republican officials talked about creating fair and constitutional districts, the driving force was how they could manipulate district boundaries in order to gain the maximum political advantage for the Republican Party – much like Democratic politicians have done when they had the power of the pen. 7 Source: http://www.doksinet In this report we carefully evaluate and document the level of transparency. We conclude that for the following reasons those responsible for Ohio’s
2011 redistricting process deserve a grade of D-: • • • • • • Decisions were not made in public Public input was ignored The public had limited opportunity to review “Information is the currency proposed maps of democracy.” The public was not provided with relevant data for proposed districts - Thomas Jefferson Nonpartisan redistricting criteria was not used The criteria used to evaluate plans was never publicly identified Much of the above is apparent from observing the official process. By reviewing the records, we uncovered secrets which were not known Some of these include: • • • A concerted strategy of secrecy was employed which included use of a national consultant, secret meetings, and a secret redistricting office $210,000 was secretly paid to two Republican staffers Then Speaker of the House John Boehner’s team was the primary decision maker for the congressional map • A last minute change was made to the congressional districts to honor a
request from Boehner’s team to move the corporate headquarters of a major campaign contributor into a different congressional district • Republican officials believed that changes they made to state legislative districts could save them millions of dollars in future campaign expenses • Based on their own political indexes, Republican officials believed they created a congressional plan which would provide a 12 – 4 Republican advantage and a state legislative plan which would ensure their control of the legislature even if there were a strong Democratic year • Multiple maps were considered including pairings of Congressman Sutton and Fudge, Gibbs and Johnson, and Turner and Jordan • Requests by State Senator Chris Widener to keep Clark County in one congressional district were ignored because this would hurt the political index for Congressman Stivers’ district • A last minute change was made to split Mercer County into three congressional districts in order to
move State Senator Keith Faber’s home from the 8th congressional district to the 4th congressional district 8 Source: http://www.doksinet Because many records were not provided even though public record requests were made, many things are still not known, including: • • • • What lobbying did legislators and congressmen engage in for their districts? What congressional district plans were proposed in private negotiations between Democratic and Republican politicians? How many other district boundaries were manipulated to raise campaign funds? What else was discussed in the political backrooms? Did the public have an opportunity to review maps? Not much. While the Legislature is often criticized for issues dragging on for months or years without resolution, on congressional redistricting they demonstrated an impressive ability to move with speed and efficiency. On Sept. 12, Rep Matt Huffman, Chair of the House Government and Elections Committee issued a notice indicating
the next afternoon the Committee would hear testimony on a yet to be introduced bill, with a further hearing on the 14th, at which time the bill would be voted on. The next day HB 319 was introduced with the maps unveiled that afternoon. 24 hours later the House Committee voted on the legislation and within 48 hours of the maps being introduced HB 319 was approved by the full House in a near party line vote. The Senate moved just as quickly the next week On Sept 20 the Senate Committee on Government Oversight and Reform held two hearings on the bill, and approved the bill on a straight party line vote the next day, with the only change being to add a monetary appropriation to assist local boards of elections in implementing the new districts. One hour later, HB 319 was approved by the full Senate and still later the same day the full House concurred with the Senate amendment. The Apportionment Board schedule provided even less time for public scrutiny. Proposed maps were unveiled on
Friday, Sept. 23, considered by the Apportionment Board on Monday, Sept 26, and voted on Sept 28 All of this was designed to limit the time that the public could have to review, analyze, and raise questions about the proposed maps. Were nonpartisan redistricting criteria used? The lack of nonpartisan redistricting criteria is most apparent when the congressional and state legislative maps were compared with maps generated through the citizen competition and scored using these criteria. Mathematical formulas were used to score the competition maps based on the following nonpartisan criteria: • • • • Compactness Minimizing the number of county and municipalities split into different districts Competitiveness – maximizing the number of districts which either party could win Representational fairness – balancing the number of districts which favor each party The maps of the new congressional and state legislative districts were scored using the same formulas used to score
the competition maps and they couldn’t compete with maps generated from the competition. In fact the congressional maps scored dead last! 9 Source: http://www.doksinet This was most apparent with the congressional maps. 53 congressional district plans were submitted during the competition Not only did all 53 plans score higher than the congressional plan adopted by the Legislature, but it wasn’t even close, as is shown by the following table which shows for comparison purposes the scores for the 1st place, 10th place, and 53rd place competition plans, as compared to the congressional plan (HB 319) which was adopted by the Legislature. Competition Scores for Congressional Plans 1st place 222.6 10th place 194.7 53rd place 84.1 HB 319 38.5 A closer examination of the districts which were adopted demonstrates why they scored so low when evaluated based on nonpartisan redistricting criteria. The first place plan resulted in 11 of the state’s 16 congressional districts being
heavily competitive, which was defined as having a political index in which neither political party had an advantage of more than 5%. The HB 319 districts which were adopted had no districts which were heavily competitive and only two districts in which the difference in the political index was less than 10%. As a result, we can already determine which party’s candidate is likely to be elected in each of Ohio’s 16 congressional districts for the next ten years. This deprives Ohioans of having a meaningful opportunity to hold their congressmen accountable in future elections. Ohio’s congressional districts as passed would likely result in an Ohio congressional delegation of 12 Republicans and four Democrats for the next decade regardless of whether most Ohioans vote for the Democratic or Republican candidate. In contrast, under any of the top ten congressional plans generated through the citizen competition, the ulti“The liberties of a people never were, mate balance of
Ohio’s congressional delegation will denor ever will be, secure, when the pend on the preferences of the voters. transactions of their rulers may be This type of partisan imbalance was created by splitting concealed from them. To cover up counties and municipalities in a way that packed with the veil of secrecy the common Democratic voters into four congressional districts and routine of business, is an abominaprovided comfortable Republican majorities in the retion in the eyes of every intelligent maining 12 districts. This resulted in splitting every major man” Ohio city and 27 counties into different districts. In com- Patrick Henry parison, the winning congressional map kept cities intact and split only five counties into separate districts. Secrecy was the game plan. From the start, the plan was to determine the new districts in secret. This strategy was handed down from national party leaders and included private meetings, a secret office, and a plan to keep maps under
wraps until the last minute. 10 Source: http://www.doksinet Secrecy strategy – As early as May 2010, the Republican National Committee conducted training on redistricting. The theme of the training was – “Keep it secret, keep it safe” The training was attended by Michael Lenzo, Ohio House Majority Counsel Materials from the training were provided to Heather Mann and Ray DiRossi, who were assigned to draw the Ohio maps. John Morgan who provided this training served as a consultant to the Republican officials in charge of Ohio’s redistricting efforts. The plan to keep maps secret until the last minute is also apparent from proposed timelines found in the files of the redistricting officials. These called for completing the congressional map by Aug. 19 and then holding it “in the can” until the Legislature came back Sept 13-14 The Apportionment Board timeline called for plans to be submitted by Sept 23 and voted on Sept 28 or 29 Secret meetings – Even though Ohio’s
Sunshine Law generally requires “public officials to take official action and to conduct all deliberations upon official business only in open meetings unless the subject matter is specifically excepted by law,” every effort was made to conduct all of the deliberations in private. Hotel used as secret redistricting office – At a taxpayer cost of $9,600, redistricting officials rented a downtown hotel room from July 17, 2011 to Oct. 15, 2011 to use as a secret redistricting office The address of the hotel room never shows up on any correspondence. Meetings scheduled for the hotel room appear to be described as meetings in the “bunker” or simply as “off site.” The purpose of renting the hotel appears to be twofold – to ensure that no one could gain access to the redistricting plans and to provide a place where those drawing the maps could meet with interested parties without being seen by other staff. Using “attorney-client privilege” to keep records secret – The
Apportionment Board hired Washington D.C attorney Mark Braden to serve as legal counsel, even though the Ohio Attorney General is their statutory legal counsel. Braden served for ten years as chief legal counsel to the Republican National Committee and promotes himself as being the “father of soft money.” House Majority Counsel Michael Lenzo refused to provide records of any communications with Braden on the basis of attorney-client privilege. It appears that Braden did more than simply provide legal advice Rather, he was involved in redistricting strategy. He hired consultant John Morgan and participated in meetings with him and Ohio redistricting officials The secretaries of the Apportionment Board submitted draft maps to him for consideration. Braden’s name is even listed as the author of one of the final three congressional plans considered by Republican legislative leaders. $210,000 secretly paid to two Republican staffers. At its initial meeting on Aug. 4, 2011 the Ohio
Apportionment Board named Ray DiRossi and Heather Mann as its joint secretaries. It was assumed that DiRossi and Mann were working as state employees as both had been employed by the House and Senate. However, a public records search revealed that neither were state employees while the Apportionment Board met. Instead, each were paid $105,000 ($210,000 total) through contracts the Republican Legislative Task Force members entered into with Policy Widgets, LLC and Capital Advantage, LLC, which were companies Mann and DiRossi established. 11 Source: http://www.doksinet Mann resigned from the House on Aug. 4 and returned to the House payroll on approximately Nov 11, during which time she was paid under the contract with Policy Widgets. This resulted in Mann’s compensation increasing over six fold during the 14 weeks she was compensated under the redistricting contract ($1202/wk as House employee to $7,500/wk under the contract). By contracting with Policy Widgets and Capitol
Advantage, rather than contracting with Mann and DiRossi personally, or having them on the payroll as state employees, Republican officials were able to hide the lucrative payments they were making to close staffers. Congressional map approved by Boehner When Rep. Huffman testified in support of HB 319, he was asked who drew the map He advised that it was drawn by staff. This was partially true Heather Mann and Ray DiRossi were the Ohio staff responsible for the map. However, their direction came from Tom Whatman, Executive Director of Team Boehner, and Adam Kincaid, Redistricting Coordinator for the National Republican Congressional Committee. During the weekend before HB 319 was introduced, Senator Keith Faber and Senator Chris Widener sought modifications to the map. However, Senate President Thomas Niehaus made clear that the critical requirement was to create a map which Speaker Boehner fully supported. “I am still committed to ending up with a map that Speaker Boehner fully
supports, with or without votes from two members of leadership.” - Sept. 11 e-mail from Niehaus to Whatman The next morning when Ray DiRossi provided Senator Niehaus with the final map for his approval, Niehaus’ question was: “Did Whatman sign off?” Mapmakers were chasing campaign money Not only were politicians choosing their voters, but redistricting was used to maximize potential campaign contributions. This is most obvious in the 16th Congressional District, where a puppet shaped peninsula was carved into Canton and attached to the District. The total population in this peninsula is zero! No other portion of Canton is in the 16th District. This zero population area was attached to the 16th District because it contains the Timken manufacturing plant and their corporate headquarters. The portion outlined in red in the upper right Those connected with Timken are major camshows the area that was added to District 16 paign contributors to Congressman Renacci. to include a
political donor. Keeping the plant in his district gave these contributors a reason to continue to contribute to Renacci. 12 Source: http://www.doksinet So, who requested this bizarre change? None other than Tom Whatman, Chief Executive of Team Boehner, requested this carve out the night before HB 319 was introduced and it took only 8 minutes to get this approved! Sept 12 e-mails: 9:28 PM - Whatman to Kincaid and DiRossi: “Guys: really really sorry to ask but can we do a small carve out down 77 in Canton and put Timken hq in the 16th. I should have thought about this earlier.” 9:36 PM - Kincaid: “Yeah, sure, no problem. Ray/Heather, do you want me to do it and send the file over, or will y’all do it?” 9:36 PM - DiRossi: “You do and get equivalence file to us asap. Thanks” 9:39 PM - Kincaid: “10-4” 9:41 PM – Whatman: “Thanks guys. Very important to someone important to us all I really should have thought of this” Speaker Boehner’s control over this process
is demonstrated by the fact that there was no hesitation to honor this request and no explanation was necessary. Moreover the change was made after Ohio House Speaker William Batchelder and Senate President Thomas Niehaus had already signed off on the bill. DiRossi apparently understood that he was to make changes requested by Boehner without the necessity of obtaining further approval from Batchelder, Niehaus, or the bill’s sponsor. The records establish that Speaker Boehner was not the only one concerned about how redistricting would affect campaign funds. The map drawers also looked at how redistricting would affect funds needed for state legislative races. One week before the state legislative districts were released, Ohio House Majority Caucus Chief of Staff Troy Judy provided Ray DiRossi with an analysis which ranked the top 43 state house districts by the amount of in kind campaign contributions provided by the Republican Party or caucuses. DiRossi’s response was: “But we
have made significant improvements to many HDs on this list. Hopefully saving millions over the coming years” Republican mapmakers analyzed political indexes to maximize Republican seats No political data was presented when HB 319 was introduced or when the state legislative districts were unveiled. However, this data not only existed, but had been thoroughly analyzed with the explicit goal of increasing the Republican advantage in multiple districts By early July, Republican map drawers had agreed upon the indexes they would use to evaluate districts. 13 Source: http://www.doksinet They made a strategic decision to evaluate districts under the most favorable Democratic conditions, so that Republican candidates could safely win a solid majority of districts even in a heavily Democratic year. To do this they generally evaluated districts two ways The first was to look at the percentage of votes which McCain received in a district in the 2008 Presidential race, since McCain
received 469% of the vote which is approximately 5% less than a typical statewide Republican candidate would receive The second comparison was to create what they labeled as a “unified index” which was based on the 2004 Presidential race, the 2006 Attorney General and Auditor’s races, the 2008 Presidential race, and the 2010 Governor’s race. Since this included two races in which the Democratic candidate won by approximately 5% and no races in which the Republican candidate won by more than 2%, this resulted in a Democratic leaning index. For the congressional districts, they also looked at the 2010 Attorney General race. Charts were created which provided the following information for each district: the incumbent, the indexes, and how much the McCain vote and the unified index changed. Republican map drawers concluded that 12 of the 16 new congressional districts favored Republicans and that only the 14th District (LaTourette) could be considered a swing district. Multiple
maps considered In an effort to obtain the most advantageous possible districts, multiple different configurations were considered. For example by Sept 10, two weeks before the state legislative districts were unveiled, between 11 and 21 different Franklin County maps had been considered. Four primary congressional maps were considered, which would have paired the following congressmen: • • • • Kaptur/Kucinich & Sutton/Fudge (labeled 4-way split) Gibbs/Johnson & Kaptur/Jordan & Sutton/Fudge (open seat in Franklin Co) Turner/Austria & Kaptur/Kucinich & Sutton/Fudge (open seat in Franklin Co) Turner/Jordan & Kaptur/Kucinich & Sutton/Fudge (open seat in Franklin Co) This evolved into two Sept. 2 variations of the Turner/Austria pairing and finally a Sept 8 variation of the Turner/Austria plan. The final three versions also changed the Sutton/Fudge pairing to a Sutton/ Renacci pairing. While the precise reasons one map was chosen over another cannot be
conclusively determined from the records, several things are apparent 13 – 3 Republican map effort. The number of attempted GOP seats is listed for each map The 4 way split map is the only one which attempts to obtain 13 Republican seats. This map was likely rejected because while it created 13 seats which favored Republicans, in four of the 13 Republican districts McCain received less than 50% of the vote. Jordan. There was much speculation prior to the congressional maps being released, that Speaker Boehner would attempt to create a district which punished Congressman Jim Jordan because he led a faction in the Republican congressional caucus that opposed Speaker Boehner on various budget compromises. In one plan Jordan was paired with Republican Congressman Turner In another he was paired with Democratic Congresswoman Kaptur in a Democratic district. While these options were rejected, it is unknown whether possible retaliation against Congressmen Jordan was a reason these plans
were created. 14 Source: http://www.doksinet Sutton/Renacci. It is likely that Congresswoman Sutton was moved out of Congresswoman Fudge’s district and into Congressman Renacci’s district in order to appease African-American legislators, with whom Republican officials were negotiating in an effort to pick up some Democratic votes. Moreover, since the Sutton/Renacci district is strongly Republican and only includes 25% of Congresswoman Sutton’s former district, pairing these two Congressmen into the same district does little to jeopardize Republican control of the district. Widener. During the final weekend before the proposed congressional map was unveiled, State Senator Chris Widener, with the support of other current and former Clark County legislators, strongly advocated that the congressional map keep Clark County in a single district. This request was rejected because it would have made the district prepared for Congressman Stivers less Republican. The Boehner team
described that request as “crazy” This demonstrates how little concern there was about splitting up counties and cities if to do so would provide a greater political advantage. Faber. Also during the final weekend before the proposed congressional map was unveiled, there were multiple discussions, e-mails, and exchanges of proposed maps between State Senator Keith Faber and Ray DiRossi. Under the original maps, Mercer County was divided into two congressional districts, with Faber’s residence in Celina being in the 8th Congressional District (Boehner) and the rest of the County in the 5th Congressional District (Latta). Different options were considered, apparently to move Faber into the 4th Congressional District (Jordan) Ultimately, the map proposed in HB 319 divided Mercer County into three districts, with a small segment which included Faber’s residence being attached to the 4th Congressional District. The Elephant in the Room’s Conclusion Much of what happened in the
backrooms remains unknown. Establishing the boundaries of legislative and congressional districts has historically been an insider issue However, it is an issue which is central to our democracy. How these lines are drawn largely determines who may be elected and more importantly who will make our laws. This is an issue which affects us all While individual legislators may have a desire to create districts in which they can easily be elected, the public has an interest in creating districts in which the voters will actually decide who is elected. Our goal is to shine a light on this process both to expose what took place in the backrooms and to help provide a roadmap to how we might do better in the future so that the voters can choose their politicians instead of the other way around. Postscript In September 2011, the Ohio General Assembly approved a congressional map that was so gerrymandered that the Democrats sought a voter referendum on the bill. Democrats were unable to collect
enough signatures for the referendum but the state legislature went back to work and tweaked their first map to craft a new congressional redistricting map. The new congressional map was a marginal improvement but the congressional districts aren’t any more competitive and established a virtual Republican lock on twelve of the sixteen districts. The political party favored in each district – Democrat or Republican was a perfect predictor of the party of the winner in every congressional district. 15 Source: http://www.doksinet “Predictable Results” and how Ohio’s congressional districts are rigged against voter choice The League of Women Voters of Ohio has prepared a report every two years comparing the 2011 gerrymandering to the 2012, 2014, and 2016 election results to analyze how effective the gerrymandered districts were at controlling election results. The report specifically addresses these questions: • Were Ohio’s U.S Congressional and state General Assembly
districts drawn to favor one political party over the other? • Did the political index of each district so heavily favor one party that it was virtually guaranteed to win that seat? • Did Ohio have any competitive districts that did not strongly favor one party over another? • Did any candidates win despite their district being drawn to favor the opposing party? • Did the total number of votes each party received statewide match the number of district seats they won? The results? Entirely predictable. Ohio’s current legislative districts were drawn in 2011. The Ohio General Assembly redrew district boundary lines for Ohio’s U.S Congressional districts, and the Ohio Apportionment Board redrew district boundary lines for Ohio’s state General Assembly districts. There are three major criticisms of the final maps. • Each district was drawn to favor either the majority Republican Party or the minority Democratic Party, and the makeup of the new districts determined
the outcome of the election. • The districts were drawn to disproportionately favor the political party that controlled the redistricting process. • Districts were not compact and instead twisted over a wide geographic area. A visual inspection of the maps bears this out All three criticisms are the natural outcomes of Ohio’s current map drawing process, which grants broad discretion to members of the majority political party to fashion districts favorable to its interests. Analysis of Ohio’s U.S Congressional Districts The chart on the next page compares the projected partisan index of each Congressional district (the column labeled “Projected %”) and the percentage of official votes cast in 2012, 2014 and 2016 for the Republican and Democratic candidates. Those districts that favor Republicans and a Republican won the seat are shaded red, and those districts that favor Democrats and a Democrat won the seat are blue. Eight of the 2012 US House races, nine of the 2014
races, and seven of the 2016 races had third party or write-in candidates, so the totals may not add up to 100%. Partisan indexes perfectly predicted the party of the winner in ALL of the Congressional districts in 2012, 2014 and 2016. 16 Source: http://www.doksinet Ohio’s U.S House Races % of time district index predicted winning party District PROJECTED % No. %R 1 2 55.92% 57.02% 3 35.73% 4 59.61% 5 57.52% 6 53.86% 7 56.23% 8 9 64.30% 36.38% 10 54.14% 11 20.33% 12 59.42% 13 37.70% 14 54.36% 15 56.46% 16 56.62% %D 44.08 % 100% 100% 2012 RESULTS 2014 RESULTS %R 57.73% (Chabot) 58.63% 42.98 % (Wenstrup) 64.27 % 40.39 % 42.48 % 46.14 % 43.77 % 26.35% (Long) 58.35% (Jordan) 57.27% (Latta) 53.25% (Johnson) 56.40% (Gibbs) 99.97% (Boehner) 23.03% 63.62 (Wurzelbach % er) 59.54% 45.82 % (Turner) 0% 79.67 % (no cand.) 63.47% 40.58 % (Tiberi) 27.23% 62.30 % (Agana) 54.04% 45.64 % (Joyce) 61.56% 43.54 % (Stivers) 52.05% 43.38 % (Renacci) 35.70 % %D
37.60% (Sinnard) 41.37% (Smith) 68.29% (Beatty) 36.49% (Slone) 39.16% (Zimmann) 46.75% (Wilson) 43.60% (HealyAbrams) 0% (no cand.) 73.04% 100% %R %D 63.22% (Chabot) 36.78% (Kundrata) 59.19% (Chabot) 65% 65.96% 34.04% (Weinstrup (Tyszkiewicz) ) (Wenstrup) 35.93% 64.06% 31.43% (Adams) (Beatty) (Adams) 67.67% 32.33% 67.99% (Jordan) (Garrett) (Jordan) 66.46% 28.92% 70.90% (Latta) (Fry) (Latta) 58.23% 38.58% 70.68% (Johnson) (Garrison) (Johnson) 100% 0% 64.03% (Gibbs) (no cand.) 67.19% (Boehner) 27.36% (Poetter) 32.17% 67.74% (Kaptur) (May) (Kaptur) 37.49% (Neuhardt) 100% (Fudge) 36.53% (Reese) 72.77% (Ryan) 38.73% (Blanchard) 38.44% (Lang) 47.95% (Sutton) 65.18% (Turner) 17 2016 RESULTS %R %D 20.55% (Zetzer) 68.11% (Tiberi) 31.46% (Pekarek) 63.26% (Joyce) 66.02% (Stivers) 63.74% (Renacci) 40.77% (Young) 32.82% (Smith) 68.57% (Beatty) 32.01% (Garrett) 29.10% (Neu) 29.32% (Lorentz) 28.96% (Gibbs) 68.76% (Davidson) 31.31% (Rich) 26.97% (Fought) 68.69% (Larson) 31.53%
64.09% (Klepinger) (Turner) 79.45% 19.75% (Fudge) (Goldstein) 27.75% 66.55% (Tibbs) (Tiberi) 68.49% 32.26% (Ryan) (Morckel) 33.02% 62.58% (Wager) (Joyce) 33.98% 66.16% (Wharton) (Stivers) 36.26% 65.33% (Crossland) (Renacci) (Kaptur) 32.67% (Klepinger) 80.25% (Fudge) 29.84% (Albertson) 67.73% (Ryan) 37.37% (Wagner) 33.84% (Wharton) 34.67% (Mundy) Source: http://www.doksinet Districts tilted heavily towards one party or the other tend to deter opposition. In 2012 two candidates were unopposed, and in 2014 one candidate was unopposed No candidates were unopposed in 2016, but the win margin in every district was nonetheless very high The table below compares the total votes for the two major parties with the seats each won. In 2016, Republicans candidates for Congress received 3,101,556 (60%) of the total votes statewide for major party candidates, and the Democrats received 2,048,984 (40%) of the total major party candidate votes statewide. And yet, the majority Republican Party won
75% of the seats despite having only 60% of the total votes statewide. The difference between the percentage of seats and percentage of votes -- 15% -- represents a high level of disproportionality in the level of representation versus the overall strength of candidates with the statewide electorate. By comparison, in 2012, 51% of the votes went to the Republican candidates with the same result – 75% of the seats. In 2014, 57% of the votes again yielded 75% of the seats. The disproportionality is slightly less in 2016 but is still quite large. 2016 RESULTS REPUBLICANS DEMOCRATS # OF VOTES 3,101,556 2,048984 % OF VOTES 60% 40% # OF SEATS 12 4 % OF SEATS 75% 25% While the percentage of each party’s vote share changed from year to year, the percentage of seats each party won remained unchanged. This further demonstrates that the districts are not designed to reflect voter preferences from year to year. Analysis of Ohio General Assembly Districts The results are just as
bleak in the state legislature, where the partisan index of the districts likewise predicted the winning party nearly every time. In the Ohio House of Representatives, the partisan district index projected winners in 97 of the 99 districts in 2012, 96 of the 99 districts in 2014, and 95 of the 99 districts in 2016. In the Ohio Senate, the partisan district index projected winners in ALL of the districts in 2012, 2014, and 2016. 18 Source: http://www.doksinet Better Ways of Drawing Districts Legislative districts do not have to be drawn to reach such disproportionate results. Applying a few simple rules can yield districts that more fairly and accurately reflect voter preferences. The map-drawing competitions held in 2009 and 2011, for example, scored proposed congressional maps based on whether they could meet several “public interest” criteria: • Compactness. Sometimes referred to as the “look” of a district, compactness assures that bizarrely-shaped legislative
districts are minimized. • Communities of Interest. Counties, municipalities, and other government boundaries give Ohioans a sense of place and shared interests. This measure seeks to minimize political subdivisions divided between districts • Competitiveness. Our democracy thrives when the marketplace of ideas is truly competitive, especially on Election Day Ohio’s current maps are comprised entirely of “safe seats” where one party or the other is virtually guaranteed to win, even though many parts of the state are not politically homogeneous. This measure seeks to increase the number of legislative districts that could be won by either party, providing Ohioans with a stronger voice in choosing their representatives. • Representational Fairness. A final redistricting plan does not unfairly bias one party over another. Maps also needed to meet three basic legal thresholds: • Population equality. Federal case law requires that districts be roughly equal in
population (see 2012 US Supreme Court case Tennant v Jefferson County Commission, Case No. 11-1184 decided Sept 25, 2012) • Contiguity. Every part of a district must be reachable from every other part without crossing the district’s borders • Voting Rights Act. All plans must adhere to applicable federal law and case law about protecting minority voting rights and representation. If it is possible to draw a majorityminority districts, then the map makers should do so Map makers should also endeavor to draw minority-opportunity districts in communities where population levels would support it. Voters would be better served if districts were drawn to take into account widely-respected, good government principles of redistricting rather than the current majority party takes all system. Ohio Overwhelmingly Supported Fair District Rules for the State Legislature In December 2014, the Ohio General Assembly reached a bipartisan deal to put new fair redistricting rules for the
General Assembly before voters. The proposal, HJR12, was approved at the close of session by a strong bipartisan vote of 28-1 in the Senate and 81-7 in the House. The legislature’s reform proposal appeared on the November 2015 general election ballot as Issue 1 and was overwhelmingly approved by voters, with more than 71% voting in favor. That reform did not include U.S House districts, which will require separate approval 19 Source: http://www.doksinet 20
 Just like you draw up a plan when you’re going to war, building a house, or even going on vacation, you need to draw up a plan for your business. This tutorial will help you to clearly see where you are and make it possible to understand where you’re going.