Comments
No comments yet. You can be the first!


Content extract
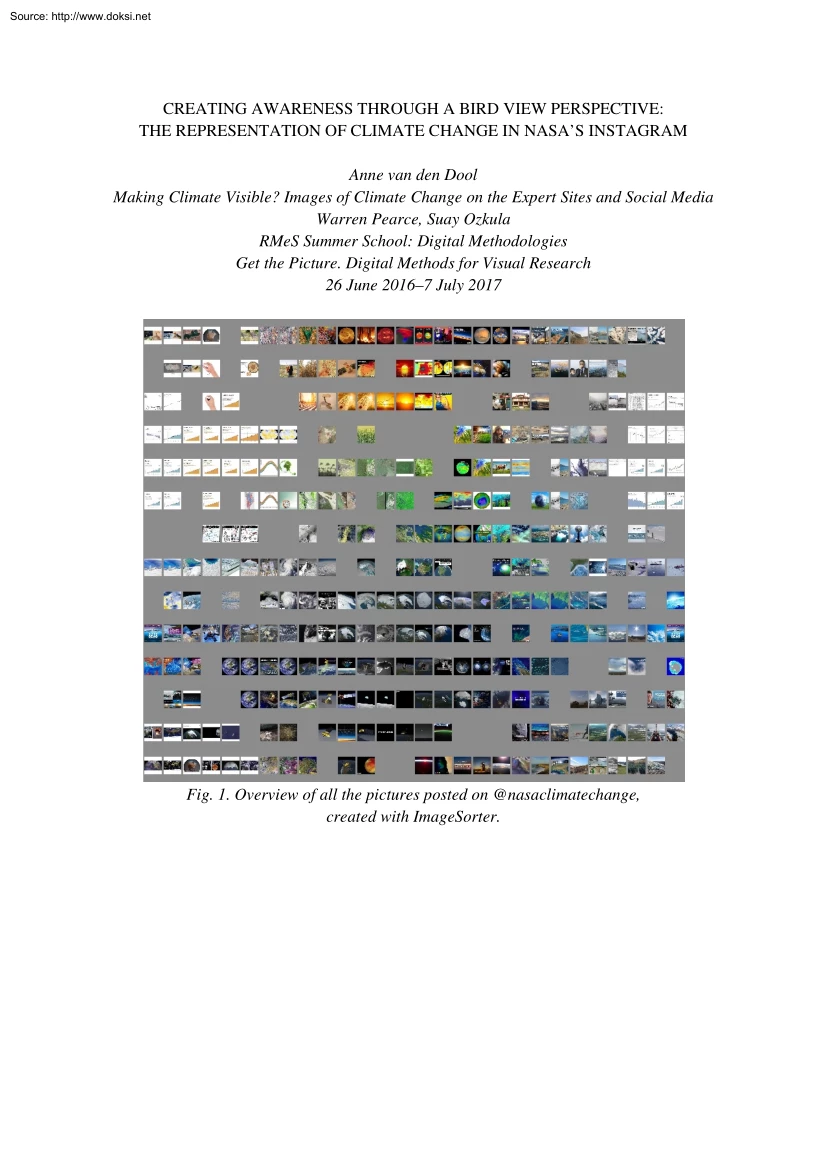
Source: http://www.doksinet CREATING AWARENESS THROUGH A BIRD VIEW PERSPECTIVE: THE REPRESENTATION OF CLIMATE CHANGE IN NASA’S INSTAGRAM Anne van den Dool Making Climate Visible? Images of Climate Change on the Expert Sites and Social Media Warren Pearce, Suay Ozkula RMeS Summer School: Digital Methodologies Get the Picture. Digital Methods for Visual Research 26 June 2016–7 July 2017 Fig. 1 Overview of all the pictures posted on @nasaclimatechange, created with ImageSorter. Source: http://www.doksinet 1. Introduction No extensive introduction is needed to explain the importance of social media in the creation of awareness of climate change. NASA has understood this quite well: having launched the separate account @nasaclimatechange on Instagram, on which posts are placed related to environmental issues, changes in the climate can be looked upon from above by millions of Instagram users, their 93.600 followers in particular As they themselves state in the description of their
account, ‘Rocket science isn’t enough; we’re climate scientists, too. Follow us to keep up with climate change and global warming’ – a statement already making clear their goal, not so much showing the beauty of planet Earth, but mainly the way humankind is harming it. Apart from their general Instagram account (@nasa), NASA thus takes up the task of informing Instagrammers all over the world about ongoing environmental developments, most of the time highlighting the disastrous impact humans have on the planet’s nature, in this way taking in a very specific political position as well. It might be interesting to look at the way NASA uses Instagram not only for its common aesthetical goal, such as concluded by Hu, Manikonda and Kambhampati, but combining this with a didactic function, adding large captions of over three-hundred words in which they set out their political interpretation of the images (598). It may be interesting to compare NASA’s approach considering this
specific account to the recommendations made in the Climate Visuals report launched in 2015 by Adam Corner, Robin Webster and Christian Teriete on behalf of Climate Outreach (formerly COIN), a ‘charity focused on building cross-societal acceptance of the need to tackle climate change’ (2). In this report, seven principles for visual climate change communication are summed up, which together should lead to more persuasive and effective communicative strategy in the field of climate change. A question answered when looking at NASA’s communication about this subject on Instagram is whether @nasaclimatechange can in this respect be considered successful. Fig. 2 Still of the most watched video posted by @nasaclimatechange, showing changes in the amount of Arctic sea ice over the past few years. 2 Source: http://www.doksinet 2. Initial Data Sets Top ten posts by @nasaclimatechange between 1 June 2016 and 30 June 2017, divided into most viewed videos and most liked images (since
likes and views are not comparable). 3. Research Questions MAIN QUESTION How has climate change been represented by NASA on their @nasaclimatechange Instagram, both in word (descriptions) and image (photo, video) during the period of June 2016 until June 2017, and how does this representation relate to the seven principles for visual climate change communication as mentioned in the Climate Visual report by Climate Outreach? SUBQUESTIONS • Which messages are most engaged with in terms of views, likes and comments? • How can the descriptions, images and their interaction of these messages be characterized? • Which hashtags are used most, and what do they say about the images? • What is the overall message conveyed by NASA through their @nasaclimatechange Instagram account? • How do the visual methods used relate to the recommendations made in the Climate Visuals report? HYPOTHESIS • Use of a bird view perspective in order to draw attention to climate change on a global level.
• Focussed not so much on human beings, but on Earth in general. • Trying to fulfil a didactic function, but also focusing on aesthetics. • Not being able to score positively on all the points made in de Climate Visuals report – especially not on the locally oriented points, since NASA mostly focusses on the Earth and outer space from a distant perspective. 4. Methodology • Creation of overview of ten most viewed videos and ten most liked images in the period June 2016–June 2017, including the subject of the posted videos and images, the date of the posts, their description, the used hashtags and their location. • Sorting on most viewed (videos) and most liked (images). • Comparing images, descriptions, hashtags, their paragonical qualities and responses by other Instagram users for both the top ten videos and images. • Comparing findings with recommendations made in Climate Visuals report. • Comparing NASA’s strategy in use of videos and pictures, and their
relation to their descriptions. 3 Source: http://www.doksinet Fig. 3 Still of the most liked image posted by @nasaclimatechange, showing the cross section of a tree, emphasizing the age it can reach, showing the environmentally related information extractable from such a profile. 5. Findings VIDEOS Images All animated GIF-like videos of Earth from bird view perspective, showing environmental developments concerning the melting of glaciers and the amount of carbon dioxide in the air and the Earth’s temperature – of which the former is the most prominent, taking in 60 percent of the top ten results. Scientific animations with black backgrounds showing timeline, roughly dating from the 1970s until now, sometimes including graphs. Surprisingly, all of these videos are looking really similar. Descriptions • Very explanatory: explanation of difficult terms (e.g ‘Perennial sea ice, also known as multi-year ice, is the portion of the sea ice that survives the summer melt season’)
– addressing large public. • Often, a link to a longer article or image is placed at the end of the description. • General build-up: general introduction about phenomenon shown (e.g sea ice) – information about developments concerning this phenomenon (e.g melting) – relation to developments shown in video, including statistics, and explanation for laics – link, implicitly using description of link to give summary of description in one sentence – video credit (mostly NASA itself – implicit commercial value for their own work). • No use of location option. • Extensive discussions on climate change in comments. 4 Source: http://www.doksinet • • No explicit political references, but nevertheless taking in a very specific political standpoint considering climate change: it is happening, is it visible, and humans are taking in a very important role causing, signalling and stopping it. Rhetoric tone: we are at a critical point considering climate change – use
of words such as ‘record’ is really prominent. Hashtags • Almost every hashtag series starts with #nasa, #globalwarming and #climatechange. • Top three also has #arctic as a hashtag, which suggests that their this is a subject concerning a lot of Instagram users, or it causes the most spectacular images. • Use of many general hashtags, such as #ice, #summer, #winter, #earth, #water, #science and #data. • Use of some directive hashtags, such as #earthrightnow and #actonclimate. • Use of some popular abbreviations, such as #tbt and #icymi. • Not location option but hashtags are used to show location, #florida, #columbiaglacier and #greenland. Response • Surprisingly, one video is viewed almost 280.000 times, which is significantly more than the average 7.000 views in the rest of the top ten – despite the fact that it does not seem to differ from the other videos in terms of hashtag use (no use of more general hashtags), severeness of message conveyed in the
description, or any other characteristics. • Comments can roughly be divided in three categories: – Affirmative negative responses, explicating implicit message from NASA (e.g ‘We have ruined our beautiful earth’, @astronautamanda). – Contradicting positive responses, questioning humanity’s influence on climate change (‘Such a small glimpse at out earths history leads people to jump to conclusions’, @7t7o7n7y). – Confused responses, wondering whether they should believe climate change sceptics (mentioning Donald Trump as the most important example) or NASA. Comparison with Climate Visuals • (x) Show ‘real people’, not staged photo-ops. No people visible expressing identifiable emotions (impossible because of viewpoint) – but not staged either. • (x) Tell new stories. Stories told are not new, but are brought with scientific conviction and evidence. No use of classic imagery such as rainforests and polar bears Probable limited knowledge of Instagram users is
partly overcome by extensive description, but still requires time and interest, looking more like classic journalism. • (+) Show climate causes of scale. Scale is definitely shown, but we may wonder whether scale is not too large: in this way it loses its concreteness. • (+) Climate impacts are emotionally powerful. Indeed, impacts are shown, not so much solutions. Causes are mentioned in description 5 Source: http://www.doksinet • • • (–) Show local (but serious) climate impacts. Using a bird eye perspective, NASA shows exactly the opposite of a local image: in this case, we may wonder whether the image might be ‘too big’ to have an emotional impact. (+) Be careful with protect imagery. No ‘typical environmentalists’ are shown – also, descriptions are not calling for action, but only – seemingly neutrally – mentioning facts around climate change. (Only hashtags subtly show some protest-like intention) (x) Understand your audience. In the case of NASA on
Instagram, this is an interesting point: on the one hand, they do not seem to adjust their messages to the Instagram medium, both in length and in accessibility. On the other hand, their images are aesthetically appealing, in this way fitting in the way Instagram is commonly used. We here thus find an opposition in the use of text and image. IMAGES Images Showing far greater variety in images than videos, e.g explanation of growth of trees, arctic sea, landscape of Greenland from above, image of the Earth as a whole, glaciers, landscape, close-up of grain, an icebreaker, et cetera. Still not showing any people, but does seem to show a more humane perspective: not only showing bird’s eye perspective, and also paying less attention to scientific approach in images. Descriptions • More accessible: reader is addressed personally, aiming at awareness (‘If you look out the window, you can tell if it’s rainy or sunny right now’; ‘When you sit down for breakfast, you’re probably
not thinking about every step in the supply chain that ultimately allowed you to pour a bowl of cereal’), easier words (e.g explanation of climate), more emotional (‘Earth: the only planet we’ve ever been to, and the only home we’ve ever known. Show her some love on Valentine’s Day’) • Explicitly mention themselves as a source of their findings. • Giving advice on personal level, e.g purchase of artificial Christmas trees • Use of regrams a couple of times, as opposed to videos: less authentic NASA material. • Texts are not written bearing in mind they still have to convince the reader, but assume the reader is on their side, and only needs to be informed about the specific details of processes involving climate change. Hashtags • Once again, the hashtags #nasa, #globalwarming, #climatechange are used every time. • General hashtags used are more often than in the case of the videos, adding to their accessibility, such as #tree, #ice, #holiday, #ocean, #water,
#food, #photo, #image, #planet, #love and #beautiful. • Less directive hashtags than in the case of the videos. • No use of popular abbreviations, such as #tbt and #icymi, as in the case of the videos. • Location is used to show where image is taken, instead of hashtags. Both times, this is ‘Greenland’. 6 Source: http://www.doksinet Response • No specific images getting far more likes or comments than others. • Instagram users are themselves drawing interpretative conclusions based on descriptions that are not necessarily asking for such a response, e.g the picture of the development of a tree, as we can e.g draw from this reaction by @sarah murphy90: ‘#resist #scientistsmarchonwashington #savetheearth #wedonothavefouryearstospare #sciencemarchdc #marchforscience #marchfortheenviornment’. • Critical reactions on seemingly neutral political position taken in by NASA, such as by @ vmc: ‘Yet NASA won’t post the leading cause of climate change’ and
‘@nienkella: These satalites ruin the universe (too)’ Comparison with Climate Visuals • (x) Show ‘real people’, not staged photo-ops. Once again, there are no ‘real people’ in NASA’s pictures, despite their closer point of view. However, they do not show any staged situations either. • (+) Tell new stories. No classic images, more surprising points of view than in the case of the videos, e.g Christmas tree • (+) Show climate causes of scale. Links between personal life and the great impact on climate change are certainly made, by showing the influence of small daily decisions on the Earth’s well-being. • (+) Climate impacts are emotionally powerful. Indeed, more attention is being drawn to impacts than to causes or solutions – however, solutions are given more implicitly by showing the influence of personal decisions on the environment. • (+) Show local (but serious) climate impacts. Climate impacts addressed are more local than in the case of the videos.
Their severeness can not be questioned • (+) Be careful with protect imagery. No images depicting protests are shown Aesthetical images are used to draw the attention of the user, after which they are invited to read more about a specific topic on climate change. • (+) Understand your audience. NASA uses a combination of both distant and close-up images in order to inform people on a scientific level and to generate emotional responses as well. 6. Discussion • Most important message: everything on Earth is connected (e.g ‘These stores of freshwater feed water supplies that support millions of people around the world, raise global sea levels, and can even change the rate of Earth’s rotation’) – influencing one environmental is influencing another, in this way affecting the Instagram user’s everyday life as well. • Account also seems to function as a platform showing the significance of NASA’s work in everyday life, and for updating their followers considering
developments on a technical level (e.g new ways of measurement, new telescopes and cameras, et cetera). 7 Source: http://www.doksinet 7. Conclusion One might say that @nasaclimatechange shows the difficulty of conveying a negative message through the positively connotated medium of Instagram. In their images, NASA seems to be able to meet to this implicit criterion: their use of photos – and, to a somewhat lesser extent, their videos as well – do carry the aesthetic and positive characteristics an Instagram picture seems to ask for. However, when looking at the descriptions placed, NASA’s tone of voice is of a scientific character, using long texts to make their point clear, in this way going against the implicit rules on how to use Instagram. Surprisingly, it is this last warning message that is mostly being reacted to by other Instagram users: even when the negative effects of climate change are not explicitly mentioned, responses are mainly focussed on the question whether
climate change actually exists. It seems like NASA tries to bridge this gap between positivity and aesthetics on the one hand and negativity and scientific inaccessibility on the other by using hashtags that can be linked to both categories, for example #summer, #food, #love and #valentinesday when considering the former, and #earthrightnow, #arctic, #science and #data in the case of the latter. In general, one might say that NASA uploads more images which can be placed in the first category, while their videos – often explaining a complex environmental phenomenon – mostly belong to the last one. The @nasaclimatechange can thus function as an example showing the difficulty of bridging both the gap between a scientific approach and an impatient image-driven audience, and between a negatively connotated message on the one hand and a social medium with a positive mind set on the other. This difficulty may be partly overcome by the use of shorter descriptions and the use of a more
surprising and locally situated scope – which is done more successfully in the case of the pictures than with the videos. However, in the case of @nasaclimatechange, we may say that NASA, using both videos and pictures in different ways, has found a strategy in which they can combine both the users’ wishes and the message they try to convey. In this way, they also lay bare the emphasis on emotions being laid in the Climate Visuals report, which is not really paying attention to the option of conviction via a scientific route, but almost solely seems to focus on emotional methods to convey the message of climate change. 8. References • Corner, A., Webster, R & Teriete, C (2015) Climate Visuals: Seven Principles for Visual Climate Change Communication (Based on International Social Research). Oxford: Climate Outreach. • Hu, Y., Manikonda, L, & Kambhampati, S (2014) What We Instagram: A First Analysis of Instagram Photo Content and User Types. In Icwsm •
@nasaclimatechange Instagram page. Last visited on 30 June 2017 <https://www.instagramcom/nasaclimatechange/?hl=nl> 8 Source: http://www.doksinet Appendix 1. Overview of top ten pictures posted by @nasaclimatechange in the period between June 2016 and June 2017, ranked by number of views nr. date subject 1 04/11/2016 Arctic sea ice views 279.651 description One significant change in the Arctic region in recent years has been the rapid decline in perennial sea ice. Perennial sea ice, also known as multi-year ice, is the portion of the sea ice that survives the summer melt season. Perennial ice may have a life-span of nine years or more and represents the thickest component of the sea ice; perennial ice can grow up to 4 meters thick. By contrast, first year ice that grows during a single winter is generally at most 2 meters thick. hashtags #nasa #globalwarming #climatechange #arctic #seaice #ice #summer #winter #science #data #earthrightnow location link https://www
.instagramc om/p/BMZu TOojQ0y/ This truncated animation shows the weekly sea ice age between 1994 and 2016. (The full animation, starting in 1984, is at the link in our bio.) The animation shows the seasonal variability of the ice, growing in the Arctic winter and melting in the summer. In addition, this also shows the changes from year to year, depicting the age of the sea ice in different colors. Younger sea ice, or first-year ice, is shown in a dark shade of blue, while the ice that is at least four years old is shown as white. A color scale identifies the age of the intermediary years. A graph in the lower right corner quantifies the 9 Source: http://www.doksinet change over time by showing the area in millions of square kilometers covered by each age category of perennial sea ice. This graph also includes a memory bar the green line that represents the current maximum value seen thus far in the animation for the particular week displayed. For example, when showing the first
week in September, the memory bar will show the maximum value seen for all prior years’ first week of September since the beginning of the animation. 2 15/08/2016 Arctic sea ice 19.668 Learn more about how Arctic sea ice is losing its bulwark against warming summers: http://climate.nasagov/news/2510/see-how-arcticsea-ice-is-losing-its-bulwark-against-warmingsummers/ Video credit: NASA’s Scientific Visualization Studio Arctic sea ice appeared to have reached its annual lowest extent on Sept. 10, NASA and the NASAsupported National Snow and Ice Data Center (NSIDC) at the University of Colorado at Boulder reported today. An analysis of satellite data showed that at 1.60 million square miles (4.14 million square kilometers), the 2016 Arctic sea ice minimum extent is effectively tied with 2007 for the second lowest yearly minimum in the satellite record. Since #nasa #globalwarming #climatechange #arctic #ice #ocean #earth #science #data #earthrightnow #actonclimate - https://www
.instagramc om/p/BKY3 Iwxjt j/ 10 Source: http://www.doksinet satellites began monitoring sea ice in 1978, researchers have observed a steep decline in the average extent of Arctic sea ice for every month of the year. FULL STORY: http://climate.nasagov/news/2496/arctic-sea-iceannual-minimum-ties-second-lowest-on-record/ 3 17/11/2016 Cyclone 16.547 Video credit: NASA Goddard’s Scientific Visualization Studio/C. Starr A large cyclone brought so much heat and humidity to the frigid, dry Arctic in December 2015 that it thinned the sea ice cover by almost 4 inches (10 cm) on average during the time of the year when it should have been growing thicker and stronger. The cyclone’s power was equivalent to one year of energy used by half a million American homes, causing sea ice coverage loss equaling the area of Florida. #nasa #globalwarming #climatechange #arctic #florida #cyclone #storm #science #data - https://www .instagramc om/p/BM65 nrJjrGc/ NASA scientists say the
storm’s effects on the sea ice could have been a tipping point, leading to the record low Arctic sea ice maximum observed this past winter. Model projections of Arctic sea ice show that ice thickness will continue to decline over the next 11 Source: http://www.doksinet decades, making the sea ice cover even more vulnerable to winter storms. FULL STORY: http://climate.nasagov/news/2516/extremely-warm2015-16-winter-cyclone-weakened-arctic-sea-icepack 4 5 02/06/2016 Arctic sea ice minimum 30/08/2016 Thinning of glacier 8.416 8.217 Video: This visualization starts with a global view of the Western Hemisphere. The viewer then moves in over the Arctic on December 27, 2015. Winds and air temperature fade in as time moves forward. A low pressure system then moves in, pushing warm air ahead of it. The warm air moves over the Arctic sea ice, contributing to dramatic melting of the sea ice concentration in this region. Credit: NASA’s Scientific Visualization Studio. How’s our
planet doing? Get the lowdown on the state of the climatecarbon dioxide concentration, global temperature, Arctic sea ice, land ice and sea level: https://climate.nasagov/vital-signs Video: The annual minimum of Arctic sea ice from 1979 to 2016. Credit: NASA/Goddard Space Flight Center Scientific Visualization Studio. Blue Marble data courtesy of Reto Stockli (NASA/GSFC). Alaska’s Columbia Glacier descends through the Chugach Mountains into Prince William Sound. #nasa #globalwarming #climatechange #sealevelrise #ice #data #science #earth #home - https://www .instagramc om/p/BU1s V-DjFsH/ #nasa #globalwarming - https://www .instagramc 12 Source: http://www.doksinet 6 05/01/2017 Carbon dioxide 7.749 When British explorers surveyed the glacier in 1794, its nose extended to the northern edge of Heather Island, near the mouth of Columbia Bay. The glacier held that position until 1980, when it began a rapid retreat. The glacier has thinned so much that the up and down motion of
the tides affects its flow as much as 12 kilometers (7.5 miles) upstream, until the glacier bed rises above sea level and the ice loses contact with the ocean. These images show glacier retreat from July 28, 1986 to July 2, 2014. Images taken by the Thematic Mapper onboard Landsat 5 and the Operational Land Imager onboard Landsat 8. Source: NASA Earth Observatory, using data from the U.S Geological Survey View more images of your changing planet: http://climate.nasagov/images-of-change A new NASA supercomputer project builds on the agency’s satellite measurements of carbon dioxide and combines them with a sophisticated Earth system model to provide one of the most realistic views yet of how this critical greenhouse gas moves through the atmosphere. #climatechange #alaska #columbiaglacier #chugachmountains #princewilliamsound #ice #glacier #science #earthrightnow #nasa #globalwarming #climatechange #data #visualization #science #earth #icymi #tbt om/p/BIdkL p5jKMz/ - https://www
.instagramc om/p/BO48 4 -h FT/ Atmospheric carbon dioxide acts as Earth’s thermostat. Rising concentrations of the greenhouse gas, due primarily to the burning of fossil fuels for energy, have driven Earth’s current long-term warming trend. The visualization highlights the 13 Source: http://www.doksinet advances scientists are making in understanding the processes that control how much emitted carbon dioxide stays in the atmosphere and how long it stays there – questions which ultimately will determine Earth’s future climate. Scientists know that nearly half of all human-caused emissions are absorbed by the land and ocean. The current understanding is that about 50 percent of emissions remain in the atmosphere, about 25 percent are absorbed by vegetation on the land, and about 25 percent are absorbed by the ocean. However, those seemingly simple numbers leave scientists with critical and complex questions: Which ecosystems, especially on land, are absorbing what amounts of
carbon dioxide? Perhaps most significantly, as emissions keep rising, will the land and the ocean continue this rate of absorption, or reach a point of saturation? FULL STORY: http://climate.nasagov/news/2530/nasa-releaseseye-popping-view-of-carbon-dioxide/ This is an abbreviated video showing carbon dioxide patterns from January to August 2015. Access the full version, starting in September 2014, here: http://svs.gsfcnasagov/cgi14 Source: http://www.doksinet bin/details.cgi?aid=4514 7 15/06/2017 Atlantic Meridional Overturning Circulation 7.480 Credit: NASA’s Scientific Visualization Studio The oceans play a significant role in absorbing greenhouse gases, like carbon dioxide, and heat from the atmosphere. This absorption can help mitigate the early effects of human-emissions of carbon dioxide. The Atlantic Meridional Overturning Circulation acts as a conveyor belt of ocean water from Florida to Greenland. Along the journey north, water near the surface absorbs greenhouse
gases, which sink down as the water cools near Greenland. In this way, the ocean effectively buries the gases deep below the surface. 8 18/01/2017 Temperature 6.738 raise More graphics and multimedia: https://climate.nasagov/resources/graphics-andmultimedia Earth’s 2016 surface temperatures were the warmest since modern record-keeping began in 1880, according to independent analyses by NASA and the National Oceanic and Atmospheric Administration (NOAA). Globally-averaged temperatures in 2016 were 1.78 degrees Fahrenheit (099 degrees Celsius) warmer than the mid-20th century mean. This makes 2016 the third year in a row to set a new record for #nasa #globalwarming #climatechange #ocean #sealevelrise #science #florida #greenland #earth #water #video - https://www .instagramc om/p/BVXRPxj70O/ #nasa #noaa #globalwarming #climatechange #2016 #earth #science #datavisualization #data - https://www .instagramc om/p/BPaer fejIZN/ 15 Source: http://www.doksinet global average
surface temperatures. The 2016 temperatures continue a long-term warming trend, according to analyses by scientists at NASA’s Goddard Institute for Space Studies (GISS) in New York. NOAA scientists concur with the finding that 2016 was the warmest year on record based on separate, independent analyses of the data. This color-coded map displays a progression of changing global surface temperatures anomalies from 1880 through 2016. The final frame represents global temperature anomalies averaged from 2012 through 2016 in degrees Celsius. 9 10/02/2017 Melting glaciers 6.734 FULL STORY: http://climate.nasagov/news/2537/nasa-noaa-datashow-2016-warmest-year-on-record-globally/ #Repost @nasajpl: Glaciers and ice sheets hold massive amounts of freshwater locked up as ice. These stores of freshwater feed water supplies that support millions of people around the world, raise global sea levels, and can even change the rate of Earth’s rotation. It is now nearly certain that as Earth’s
atmosphere and oceans warm over the coming centuries, glaciers and ice sheets will continue to retreat and sea levels will continue to rise. The big question now is at what rate and by #Earth #Earthscience #space #science #talk #lecture #glaciers #NASA #JPL #EarthRightNow - https://www .instagramc om/p/BQVt XrilSKV/ 16 Source: http://www.doksinet 10 23/06/2017 Melting glaciers 6.183 how much? In this talk JPL’s Alex Gardner reveals a world of rapid change as seen through the eyes of a NASA glaciologist. Watch here: http://www.ustreamtv/recorded/99804936 (link in bio) The area of the Arctic Ocean covered in ice increases during the winter and then shrinks during the summer, usually reaching the year’s low point in September. The minimum coverage for 2012 set a record low since at least 1979, when the first reliable satellite measurements began. These images compare the 1984 minimum, which was roughly equal to the average minimum extent for 1979–2000, with that of 2012,
when the minimum was about half that. The 2013 minimum was larger, but continued the long-term downward trend of about 12 percent sea-ice loss per decade since the late 1970s, a decline that accelerated after 2007. The 2016 minimum was tied for the second-lowest on record. “At the rate we’re observing this decline,” said NASA scientist Joey Comiso, “it’s very likely that the Arctic’s summer sea ice will completely disappear within this century.” Visit the link in our bio for more images of your changing planet. #nasa #globalwarming #climatechange #arctic #ice #ocean #summer #data #science #earth - https://www .instagramc om/p/BVpN BriDPT9/ 17 Source: http://www.doksinet Appendix 2. Overview of top ten pictures posted by @nasaclimatechange in the period between June 2016 and June 2017, ranked by number of likes nr. date subject 1 27/01/2017 Tree drawing Likes 2.193 2 1.990 24/03/2017 Arctic sea ice description If you look out the window, you can tell if it’s
rainy or sunny right now, but that doesn’t say very much about your region’s climatethe area’s average weather conditions over a long period of time (30 years or more). However, that big tree in your backyard has been keeping a detailed climate record for decades. Trees can live for hundredsand sometimes even thousandsof years. Over this long lifetime, a tree can experience a variety of environmental conditions: wet years, dry years, cold years, hot years, early frosts, forest fires and more. But how do trees keep track of this information? Find out: http://climate.nasagov/news/2540/treerings-provide-snapshots-of-earths-past-climate/ Arctic sea ice appears to have reached a record low wintertime maximum extent on March 7, according to scientists at NASA and the NASA-supported National Snow and Ice Data Center (NSIDC) in Boulder, Colorado. And on the opposite side of the planet, on March 3 sea ice around Antarctica hit its lowest extent ever recorded by satellites at the end of
summer in the Southern Hemisphere, a surprising turn of events after decades of moderate sea ice hashtags #nasa #globalwarming #climatechange #tree #treerings #climate #weather #environment #science #nature #forest location link https://www .instagramc om/p/BPxlG 8vlfDC/ #nasa #earth #climatechange #globalwarming #arctic #antarctica #ice #science - https://www .instagramc om/p/BSCG 5S Dj-I/ 18 Source: http://www.doksinet expansion. The sea ice “maximum” occurs at the end of the winter cold season and marks the day of the year when sea ice reaches its largest extent. Ice extent is a measurement of the area of ocean where there is at least some sea ice. 3 25/05/2017 Greenland glaciers 1.973 Learn more: https://climate.nasagov/news/2569/seaice-extent-sinks-to-record-lows-at-both-poles/ Image credits: NASA Goddard’s Scientific Visualization Studio/L. Perkins A new NASA study finds that during Greenland’s hottest summers on record, 2010 and 2012, the ice in Rink Glacier
on the island’s west coast didn’t just melt faster than usual, it slid through the glacier’s interior in a gigantic wave, like a warmed freezer pop sliding out of its plastic casing. The wave persisted for four months, with ice from upstream continuing to move down to replace the missing mass for at least four more months. #nasa #globalwarming #climatechange #greenland #ice #glacier #sealevelrise #science #picture Greenla nd https://www .instagramc om/p/BUh9 FlxDc-l/ This long pulse of mass loss, called a solitary wave, is a new discovery that may increase the potential for sustained ice loss in Greenland as the climate continues to warm, with implications for the future rate of sea level rise. 19 Source: http://www.doksinet Full story: https://climate.nasagov/news/2591/nasadiscovers-a-new-mode-of-ice-loss-in-greenland 4 16/01/2017 Greenland’s melting 1.970 5 14/02/2017 Classic Earth image 1.966 6 21/04/2017 Greenland glaciers 1.561 Image: Rink Glacier in
western Greenland, with a meltwater lake visible center. Credit: NASA/OIB “Photography and science are a quite powerful combination. The extent of [Greenland’s] melting is increasing and the net loss is worsening every single year. I want to put images right in front of people that show that global warming is, in fact, happening.” @thaw2017 Get the full story, ‘Science on canvas: Photographs capture thawing Greenland,’ here: http://climate.nasagov/blog/2552/science-oncanvas-photographs-capture-thawing-greenland/ Image credit: Timo Lieber Via @laurafayetenc Earth: the only planet we’ve ever been to, and the only home we’ve ever known. Show her some love on Valentine’s Day. Download this image: http://climate.nasagov/climate resources/74/ A new NASA-funded study has identified which glaciers in West Greenland are most susceptible to thinning in the coming decades by analyzing their shape. The research could help predict how much the Greenland Ice Sheet will contribute to
sea level rise #globalwarming #climatechange #greenland #science #art #ice #melt #photo #image #beautiful - https://www .instagramc om/p/BQlsP hVjZsU/ #nasa #earth #valentinesday #love #home #planet https://www .instagramc om/p/BQf1 WPBF40w/ #nasa #globalwarming #climatechange #sealevelrise #greenland #glacier https://www .instagramc om/p/BTJi1 aCjOmD/ Greenla nd 20 Source: http://www.doksinet in the next century, a number that currently ranges from inches to feet. #ice #science #image Full story: https://climate.nasagov/news/2576/glacier-shapeinfluences-susceptibility-to-melting/ 7 02/12/2016 Christmas trees 1.516 Image: Terminus of Kangerlugssuup Sermerssua glacier in West Greenland. Credit: Denis Felikson, Univ. of Texas Yes, most Christmas trees are grown on farms specifically to become Christmas trees. They may take 8 to 12 years to grow to a good size, but they’re taking in carbon dioxide and releasing oxygen during that time. In other words, they’re
cleaning the air and helping to slow climate change. When the holidays are over and you’re done with your potted tree, you can recycle it or even transplant it in your backyard if it still has roots. #nasa #globalwarming #climatechange #christmas #christmastree #holiday #science #earthrightnow - https://www .instagramc om/p/BNhj4 oDDaXU/ No matter how many years you reuse an artificial tree, someday it will get thrown away and end up in a landfill for the next 1,000 years, contributing more greenhouse gas emissions to the atmosphere. FULL STORY: http://climatekids.nasagov/christmas-tree/ 21 Source: http://www.doksinet 8 09/02/2017 Melting Greenland glacier 1.438 9 04/05/2017 Grain closeup 1.394 Image credit: Denis Tabler / Shutterstock.com Glaciers on the edge Imagine the edge of an unimaginably complicated winding coastline, that unknown place where ice meets water meets seafloor. Big chunks of remnant sea ice clog up the water, and the glacier has retreated so
recently that the coastline is changing as fast as, or even faster than, we can study it. Greenland’s ice melt is accelerating, which explains why NASA is paying attention to it. NASA’s Oceans Melting Greenland (OMG) team is ready for another year of decoding Greenland’s accelerating ice melt. Via @laurafayeten and @omgnasa FULL STORY: http://climate.nasagov/blog/2544/glaciers-on-theedge/ Image credit: NASA’s Oceans Melting Greenland (OMG) mission When you sit down for breakfast, you’re probably not thinking about every step in the supply chain that ultimately allowed you to pour a bowl of cereal. However, for scientists and policymakers, understanding this complicated process is an important step toward ensuring food security in the United States and across the globe. #nasa #globalwarming #climatechange #omg #oceansmeltinggree nland #greenland #ice #glacier #ocean #water - https://www .instagramc om/p/BQTH p7Wlb2o/ #nasa #globalwarming #climatechange #food #agriculture
#seafood #earth #science #water #crops #food #drought - https://www .instagramc om/p/BTr15 bVDWcb/ NASA satellites are constantly keeping a close eye on our planet. And their observations are helping 22 Source: http://www.doksinet farmers, scientists and policymakers develop strategies to improve food production and availability. 10 09/03/2017 Ocean area change 1.357 Full story: https://climate.nasagov/news/2582/keeping-an-eyeon-food-supply/ Sea ice helps maintain Earth’s temperature, so predicting how the ice extent (a measurement of the area of ocean where there is at least some sea ice) might change helps us understand our warming climate. NASA scientists have developed a new model for better predicting the Arctic’s annual changes. Full story: https://climate.nasagov/news/2557/nasa-studyimproves-forecasts-of-summer-arctic-sea-icecoverage/ Image: A Canadian Coast Guard icebreaker travels through the Beaufort Sea ice pack in September 2016. Credit: Alek Petty/NASA’s
Goddard Space Flight Center. #nasa #globalwarming #climatechange #arctic #ice #ocean #science - https://www .instagramc om/p/BRbJ HL4DS y/ 23
 When reading, most of us just let a story wash over us, getting lost in the world of the book rather than paying attention to the individual elements of the plot or writing. However, in English class, our teachers ask us to look at the mechanics of the writing.