Comments
No comments yet. You can be the first!
Most popular documents in this category


Content extract
CAUSES AND PREDICTABILITY OF THE 2012 GREAT PLAINS DROUGHT by M. Hoerling, J Eischeid, A Kumar, R Leung, A Mariotti, K Mo, S Schubert, and R Seager The 2012 summertime drought over the Central Great Plainsthe most severe seasonal drought in 117 years resulted mostly from natural variations in weather. C entral Great Plains’ rains, occurring mostly during May–August, failed in 2012. Absent was the usual abundance of slow-soaking precipitation-bearing systems and evening thunderstorms that characterize the Great Plains climate, and as a result surface moisture conditions greatly deteriorated. The US Drought Monitor estimated that over threequarters of the contiguous United States experienced at least abnormally dry conditions by the summer’s end with nearly half of the region, especially the Great Plains, experiencing severe drought. Conditions were comparable to those of a quartercentury earlier during 1988, and the combination of rainfall deficits and high temperatures even
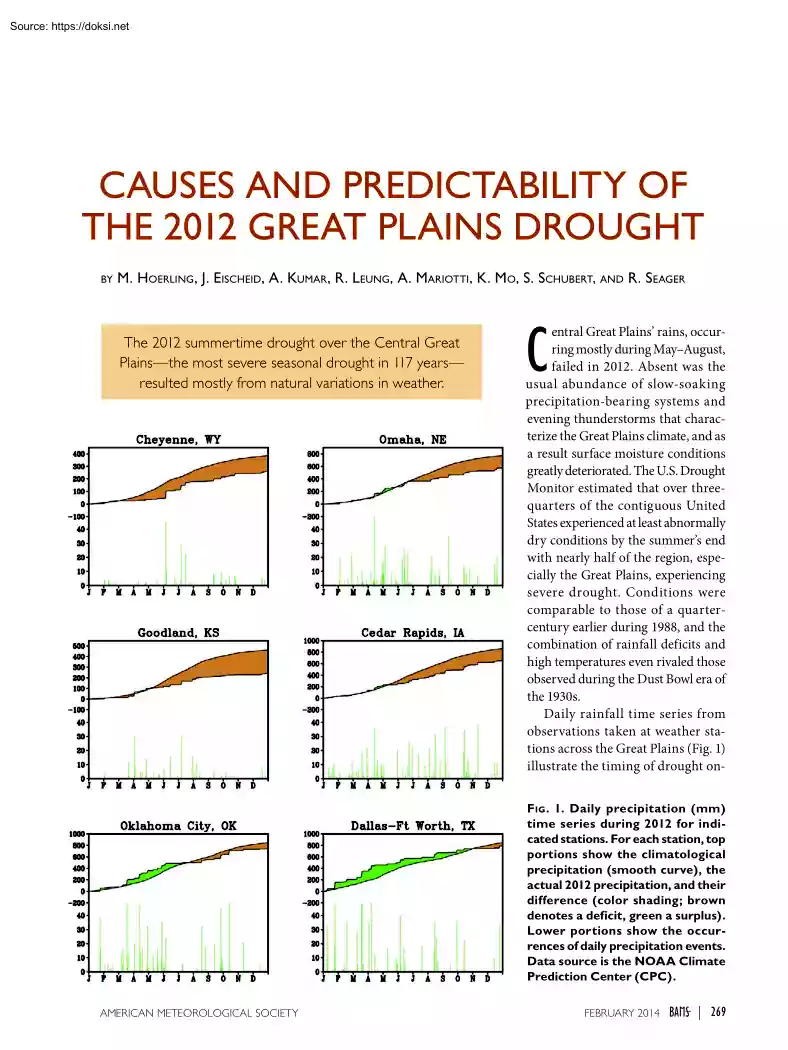
rivaled those observed during the Dust Bowl era of the 1930s. Daily rainfall time series from observations taken at weather stations across the Great Plains (Fig. 1) illustrate the timing of drought onFig . 1 Daily precipitation (mm) time series during 2012 for indicated stations. For each station, top portions show the climatological precipitation (smooth curve), the actual 2012 precipitation, and their difference (color shading; brown denotes a deficit, green a surplus). Lower portions show the occurrences of daily precipitation events. Data source is the NOAA Climate Prediction Center (CPC). AMERICAN METEOROLOGICAL SOCIETY FEBRUARY 2014 | 269 set. After a period of near to above normal winter and early spring precipitation at most stations over the central Great Plains, rains abruptly halted in May. For instance, there were virtually no rainy days at Cedar Rapids, Iowa, during May, a signature of the paucity in migratory cyclones and frontal systems that have been previously
identified as drought-causing mechanisms for spring and some summer droughts (e.g, Dole 2000). Neighboring stations also experienced prolonged stretches of rainfree days, with no measurable precipitation at Omaha, Nebraska, during July consistent with an F ig . 2 Standardized anomalies averaged over May–Aug 2012 for (a) absence of rain-producing precipitation, (b) surface air temperature, (c) 3-month accumulated runoff, thunderstorms that typiand (d) soil moisture. Precipitation data were taken from the CPC unified cally account for the bulk precipitation analysis. Temperature data were taken from the surface of midsummer rainfall in temperature analysis from the University of Washington. The May–Aug mean and standard deviation were computed using the base period 1979– the U.S heartland (eg, 2011. The contour intervals are given by the color bar The runoff index Dai 2001). Likewise, the and soil moisture are shown as percentiles with those data taken from the western plains
stations of ensemble-mean National Centers for Environmental Prediction (NCEP) Goodland, Kansas, and North American Land Data Assimilation. Cheyenne, Wyoming, saw only infrequent rains of light intensity during July and August. By contrast, Dallas–Fort Worth, which was near the center of the AFFILIATIONS: Hoerling NOAA/Earth System Research Laboratory, Boulder, Colorado; Eischeid Cooperative Institute prior year’s southern plains drought, accumulated for Research in Environmental Sciences, University of Colorado above normal rainfall for the prior 6-month period Boulder, Boulder, Colorado; Kumar and Mo NOAA/Climate through summer 2012. This greatly improved their Prediction Center, Camp Springs, Maryland; LeungDepartment soil moisture balance, and the U.S Drought Monitor of Energy, Pacific Northwest National Laboratory, Richland, estimated that northeast Texas was drought free by Washington; Mariotti NOAA/Climate Program Office, May 2012. Oklahoma City also showed strong signs
Silver Spring, Maryland; SchubertNASA Global Modeling and of recovery from the 2011 drought with above averAssimilation Office, Greenbelt, Maryland; SeagerLamont Doherty Earth Observatory, Columbia University, Palisades, New York age rains falling through May 2012, but then skies CORRESPONDING AUTHOR: Martin Hoerling, NOAA/Earth abruptly cleared and June through July was virtually System Research Laboratory, 325 Broadway, Boulder, CO 80305 rain free, attesting to the dearth of thunderstorm E-mail: martin.hoerling@noaagov activity that also plagued other Great Plains areas. The abstract for this article can be found in this issue, following the Various measures of drought intensity paint a contable of contents. sistent picture of widespread and severe surface moisDOI:10.1175/BAMS-D-13-000551 ture deficits that spanned the central Great Plains during May–August 2012. The summer-averaged A supplement to this article is available online (10.1175/BAMS-D-13-000552) precipitation was nearly
two standardized departures In final form 14 June 2013 below normal from the Rockies to the Ohio Valley 2014 American Meteorological Society (Fig. 2a) indicative of meteorological drought Surface 270 | FEBRUARY 2014 temperatures were likewise about two standardized departures above normal over this region (Fig. 2b), consistent with the strong inverse relationship between summer rainfall and surface air temperature (e.g, Madden and Williams 1978; Hoerling et al. 2013) Severe agricultural drought occurred throughout the region as affirmed by estimated soil moisture anomalies that were in the lower decile of the historical distribution (Fig. 2d) And, as expected from the deficient rainfall and depleted soil Fig. 3 Historical US corn yields from 1866 to 2012 (bushels per acre) Linear moisture, estimated surfit to different segments of the time series shown in solid lines, including face runoff was also in the regression formula. The 2012 yield is plotted in the blue circle based on
Aug lower decile, especially in estimates. Subsequent data revised the 2012 yield downward to about 123 the western Missouri and bushels. Data source is USDA lower Ohio River drainage basins (Fig. 2c) Impacts from the drought emerged swiftly. Loss prediction of climate impacts on agriculture (among estimates by the end of July 2012 were $12 billion many other sectors vulnerable to drought) might have (U.S dollars; wwwkansascityfedorg/publicat/mse been rendered /MSE 0312.pdf) The US Department of Agriculture (USDA) estimated that corn yield (per acre of planted HISTORICAL CONTEXT AND RELATIONcrop) was only 123 bushels (www.nassusdagov) This SHIPS TO ANTECEDENT CONDITIONS By is 26% below the 166-bushel yield expectation that measures of rainfall deficits, the summer of 2012 was the USDA had at the commencement of the growing an unprecedented year. Figure 4 shows the 1895–2012 season. Figure 3 shows the time series of US corn yield time series of May–August rainfall departures
aversince 1866, the most prominent feature of which is the aged over the multistate region (Wyoming, Colorado, growth in yield since about WWII as a consequence of Nebraska, Kansas, Missouri, and Iowa) that experiimproved agricultural practices and more productive enced the most severe drought conditions in 2012. and heartier strains of seed. However, 2012 corn yield The deficit in rainfall in 2012 was -342 mm, which fell strikingly below the recent trend line. The 2012 was about 53% of the region’s long-term mean rainfall crop yield deficit and the implied climatic impact was (73.5 mm) This deficit broke the record of -284 mm a historic event. In terms of absolute loss in bushels of observed in 1934 and corresponds to a departure of corn production, no single year since 1866 experienced 2.7 standard deviations so large a curtailment as occurred during 2012. The 2012 event would not have been anticipated It was mostly via extrapolation of the recent his- from simple considerations of
central U.S rainfall torical yield time series that the USDA offered its behavior in the recent past. The 1930s droughts lay initial expectation in spring 2012 that the annual in distant memory and, though not forgotten, may corn yield would be about 166 bushels per acre. This have resulted from unique conditions of that era is a reasonable prediction given that year-to-year (Schubert et al. 2004a,b; Seager et al 2005; Cook variations are mostly small relative to the trend et al. 2009) These included remote effects of tropi“signal” of unabated improved yields Of course, these cal sea surface temperatures, land use practices, and variationsrelative to trendare mostly the result of the potential feedbacks that abundant soil-related climate variability. The question is thus whether this aerosols may have exerted on rainfall An important drought could have been anticipated and if actionable role for random atmospheric internal variability has AMERICAN METEOROLOGICAL SOCIETY FEBRUARY
2014 | 271 Fig. 4 (top) The 1895–2012 time series of May–Aug central Great Plains rainfall departures (mm) and (bottom) surface air temperature departures (°C). Reference period is 1895–2011. Black curve is a 9-point Gaussian filter. The area is composed of the six-state region of WY, CO, NE, KS, MO, and IA. Data source is the NOAA U.S Climate Divisions also been proposed (Hoerling et al. 2009) However, since the 1930s, summer rainfall has shown less severe declines in the 1950s and 1970s, while the last two decades were noted mostly by abundant summer rainfall (e.g, Wang et al 2009) Looking at the whole time period, there is no clear long-term trend toward either drying or wetting. The 2012 drought thus appears to be a climate surprise from such empirical considerations alone. But did early warning signs exist based on other information, for instance, in the sequence of seasonal events that immediately preceded the 2012 drought? The answer appears to be no. Much of the
southern and central Great Plains experienced near-normal precipitation during the period October 2011 through April 2012 (not shown), and this situation significantly improved soil moisture conditions over the southern plains by spring 2012 (more information can be found online at http://dx.doiorg/101175 /BAMS-D-13-00055.2; Fig ES1) and was responsible for the amelioration of agricultural drought severity over this region that had developed in prior years. Precipitation was thus mainly driving a recovery in soil moisture through spring 2012 over the southern plains, and surface moisture conditions over the central plains were not severely stressed despite a very warm early spring. 272 | FEBRUARY 2014 Is there empirical evidence that droughts over the southern plains, such as occurred during 2010/11, tend to migrate northward as part of a life cycle? Here the instrumental record dating to 1895 is examined to explore how Great Plains droughts typically evolve. From the historical time
series (Fig. 4), the prior driest May–August periods are identified The 10 driest years (including 2012), ranked in order of their rainfall deficits, were 2012, 1934, 1936, 1901, 1976, 1913, 1988, 1953, 1911, and 1931. For these nine historical cases, composite averages of precipitation for the 12 months preceding peak central Great Plains May–August rainfall deficits were calculated and are shown in Fig. ES2 No evidence for appreciable dryness in the prior summer over the southern plains is found in this composite, suggesting that southern plains drought such as occurred in 2011 is not a necessary condition for subsequent central Great Plains drought. There is some indication for prevailing dryness in the antecedent conditions across the central Great Plains as a whole, however. This dry signature is partly related to the fact that several of the individual driest central plains summers in the composite were immersed within dry epochs that spanned much of the 1930s and also from
the late-1940s through the mid-1950s. PROXI MATE C AU S E S FO R TH E 2012 DROUGHT. Why did the 2012 drought happen the way it did? This is meant as a simple starting query toward interpreting the drought, though recognizing that answers to this question alone may not provide predictive understanding. As is common with droughts, atmospheric moisture in both absolute and relative measures is typically deficient, and 2012 was no exception. A second, and often inexorably linked, factor is the absence of processes that produce rainfall over the central plains. These include springtime low pressure systems and their attending warm and cold fronts that act to lift air masses and produce widespread rains. During summertime, the key process involves thunderstorms that normally occur with considerable frequency and from which the majority of precipitation falls in July and August. Both of these mechanisms were largely absent or inoperative to a considerable degree in 2012 over the central Great
Plains. Diagnosis of 500-hPa height anomalies during summer 2012 reveals considerable monthly variability (Fig. 5), implying that the drought was not a consequence of some steady sustained forcing Yet each of these monthly anomaly patterns in their own manner squelched rainfall-inducing processes over the central plains. In May and June (Fig 5, top panels), a zonal together with the impacts on US production resulted ridge of high pressure anomalies inhibited the typi- in substantial wheat price increases worldwide (www cal southward push of cold fronts from Canada that .businessweekcom/news/2012-08-23/russia-may often serve to organize widespread rains. July (bottom -run-out-of-exportable-grain-surplus-in-november) left) saw a somewhat different pattern, though no less Over the United States, the aggregate consequence effective in inhibiting rainfall. An intense anticy- of these various drought-inducing circulation features clone was centered over the northern plains region, was
that the principal source of water vapor in the preventing frontal incursions while also stabilizing summer over the central United States from the Gulf the atmosphere and inhibiting deep convection that of Mexico region was greatly impaired. The spatial typically contributes appreciably to midsummer distribution of climatological 700-hPa meridional rainfall totals. The August 500-hPa height pattern (north–south component) wind (Fig ES3) exhibits a (bottom right), though also drought producing, was peak 2 m s-1 southerly flow immediately on the coast yet different again from May, June, and July. A deep of southwest Texas, a feature related to the clockwise Ohio Valley trough acted to inhibit Gulf of Mexico air motion around the mean subtropical high of the moisture inflow, while subsidence over the western Atlantic Ocean. This climatological influx of Gulf air Great Plains was enhanced on the western edge of this masses is also a signature of the integrated effects of low pressure
system. migratory midlatitude storm systems, especially in Together, these conditions conspired to create the late springtime when they exhibit a geographically a 4-month sequence of record rainfall reduction preferred cyclogenesis in the lee of the southern Rocky over the central Great Plains. The impression is ren- Mountains The southerly flow was 50% reduced dered of a sequence of unfortunate events given the during May–August 2012, with a seasonal anomaly of considerable monthly variability in the upper-level about -1 m s-1 along the Gulf Coast region (Fig. ES3) circulation over North America. There were none- Consistent with this, the summertime 700-hPa spetheless indications of more persistent planetary-scale cific humidity was anomalously low throughout the features of atmospheric circulation during summer Great Plains. 2012. These consisted of zonally averaged positive height anomalies i n mid lat it udes a nd negative anomalies in subtropical latitudes (not shown). Previous
studies have found such distinct zonally symmetric features of the Northern Hemisphere summertime circulation to be at least weakly controlled by sea surface temperature anomalies (e.g, Schubert et al 2002; Kumar et al. 2003; Ding et al. 2011) Such a global pattern entails a widespread poleward shift of the prevailing westerlies and is consistent w it h t he fact that the Eurasian grain belt also experienced record heat and drought Fig . 5 Observed monthly 500-hPa geopotential height anomalies (m) for beginning in May 2012. May, Jun, Jul, and Aug 2012. Data are from the NCEP–NCAR reanalysis, and These reduced harvests anomalies are relative to a 1981–2010 climatology. AMERICAN METEOROLOGICAL SOCIETY FEBRUARY 2014 | 273 UNDERLYING CAUSES FOR THE 2012 DROUGHT. Why did drought occur over the central Great Plains during summer 2012 (and what caused the proximate conditions discussed above)? We have already surmised, from empirical analysis, that the central plains drought was
unlikely part of a single multiyear drought life cycle having its incipient stage over the southern plains in late 2010 and subsequently spreading northward. Although large portions of the United States are experiencing a third year of drought, it is plausible that various phases may have had different causes [see Hoerling et al. (2013) and Seager et al (2014) for studies of the 2010/11 drought]. Here we explore whether particular forcings, including sea surface temperature (SST) and sea ice conditions and also the trace gas composition of the atmosphere, may have contributed to the occurrence of a drought over the central plains in summer 2012. Concerning SST forcing, it is useful to first assess the evidence for recurrent patterns of ocean conditions attending the prior nine severe summer Fig . 6 The May–Aug 2012 sea surface temperature anomalies (°C) calculated (top) relative to a 1901–90 historical reference period during which the prior nine severe Great Plains droughts
occurred and(bottom) relative to a modern 1981–2010 reference period. 274 | FEBRUARY 2014 droughts in the historical record. For these events, three cases (1910/11, 1933/34, and 1975/76) experienced moderate La Niña conditions the prior winter season, two occurred after wintertime El Niño conditions (1930/31 and 1987/88), while the remaining four cases were neutral with respect to ENSO’s phase. Consistent with this weak evidence for a coherent precursor SST condition, at least in the equatorial east Pacific, evidence for a strong simultaneous SST effect is not found either. An analysis of the linear correlation between the index of central Great Plains summer precipitation with summertime global ocean surface temperatures for the entire 1895–2011 period (Fig. ES4) reveals no statistically significant relationship The lack of such relationships between summer U.S precipitation and sea surface temperatures has thwarted efforts at successful seasonal forecasting. Global SSTs
have appreciably changed, however, since the occurrence of past major central plains droughts. Figure 6 presents two analyses for the SST anomalies of May–August 2012: one calculated relative to a 1901–90 climatology (top) that brackets the era in which the prior nine historical droughts occurred and the other calculated relative to a conventional modern 1981–2010 30-yr climatology (bottom). A key point is the indication for an appreciable warming of most ocean basins as revealed by the much larger warm ocean anomalies during the 2012 summer when calculated relative to the long historical reference. The implication is that the prior severe Great Plains droughts occurred when global oceans, and climate overall, was appreciably cooler. Nonetheless, several regional features of SST conditions in 2012 are robust to the choice of reference, including the presence of anomalous warmth in the North Atlantic and an enhanced east–west contrast in equatorial SSTs between the
climatological warm pool of the Indo–west Pacific and typically cooler waters of the central to east Pacific. Given such nonstationarity in climate, and in particular the change in global SSTs, it becomes important to examine the particular attributes of climate forcings that operated during 2012 and assess how they may have conditioned the probability for severe drought over the central Great Plains in 2012. The warm SSTs in the Atlantic basin during 2012 are noteworthy, and recent studies point to a summertime U.S climate sensitivity to Atlantic forcing (e.g, Schubert et al 2009; Findell and Delworth 2010; Kushnir et al. 2010) Also, the tropical-wide SST anomalies of the past year have attributes of the so-called perfect ocean for drought pattern, with an enhanced west–east contrast in ocean temperatures Fig. 7 The May–Aug 2012 standardized anomalies of (left) precipitation, (middle) soil moisture, and (right) surface air temperature for (top) observations and (bottom)
general circulation model (GCM) simulations. Observed soil moisture estimated from the CPC is a one-layer bucket water balance model driven with observations of monthly temperature and precipitation. The GCM is based on a 30-member multimodel ensemble simulation forced with the observed SSTs, sea ice, and greenhouse gas conditions for 2012. For the model data, the standardization is calculated for each separate run, and the standardized anomalies are then averaged across all 30 realizations. Period of reference is 1981–2010 between the Indo-Pacific and central Pacific. Land precipitation was found to be sensitive to this structure, especially for the cold season over the southern United States (Hoerling and Kumar 2003). Retrospective climate simulations in which the variations of ocean surface conditions and atmospheric trace gas composition during 1979–2012 have been specified are next diagnosed (see the appendix for model details and an assessment of the model climatology). Two
particular aspects of the simulated sensitivity are of interest. First is the average response to the specified forcings, and here we diagnose the ensemble-mean response of 30 simulations based on two different climate models. Second is the so-called tail response, an assessment exploring how the probability of a particular threshold exceedance (e.g, the odds of eclipsing a prior record value) changes as a consequence of the specified forcing. Figure 7 compares the observed May–August 2012 anomalies for rainfall (left), soil moisture (middle), and surface air temperature (right) with the ensemble-mean signal of the fully forced climate AMERICAN METEOROLOGICAL SOCIETY model simulations. A forced signal of reduced rainfall is apparent in the models, though geographically focused over the Southwest and intermountain west rather than over the central Great Plains region (outlined in the black box) and having magnitudes much weaker than those observed. For the central Great Plains
region, the area-averaged simulated rainfall is -0.5 standardized departures, a dry signal appreciably smaller than the -2.0 standardized departures observed, and there is virtually no dry signal simulated east of the Missouri River where observed drought was quite severe. A similar assessment holds for soil moisture, though the standardized departure of the model’s soil moisture deficit is somewhat greater than that of its simulated rainfall deficit. This reflects two factors. One is the long memory of soil moisture and the effect of a simulated signal of reduced rainfall over the Southwest during prior seasons and into 2011 (not shown). The other is the strong contemporaneous warming of surface air temperature during summer 2012 (right side panels) that may have also contributed to land surface drying via FEBRUARY 2014 | 275 increased evapotranspiration. For the central Great Plains region, the area-averaged simulated warmth is 0.8 standardized departures compared to the 23
standardized warm anomaly observed. Perhaps a more intriguing indication for how the 2012 event was related to forcing is the simulated increase in the probability for an extreme drought event having the intensity observed in 2012. The box-and-whisker display in Fig. 8 shows the model distribution of its 30 simulations for summer 2012 (far right) and also for each summer during 1979–2012 for both rainfall (top) and surface air temperature (bottom). The overall distribution for various rainfall anomaly thresholds within the 30 realizations shifts toward drier states in 2012, consistent with the simulated mean signal of reduced rainfall. Interestingly, for summer 2012, the extreme driest model member (red asterisk), is also the single driest simulation occurring in any year during 1979–2012. It is difficult to reliably determine the change in extreme drought event probability for 2012 from such a small 30-member simulation suite. However, inspection of the full 33-yr time series of
such distributions suggests that the recent drought may have occurred during a climate regime supporting increased likelihood for severe Great Plains drought events. There is, for instance, a roughly 4-fold increase in the frequency of occurrence for a two standardized rainfall deficit in the 17-yr period after 1996 compared to 17-yr period before. Once again, this is consistent with an ensemble-mean dry signal in the model in virtually all years in the recent period and not due to increased variability per se. The increased probability, nonetheless, represents the risk of an event that remains rare within the model spread. It is reasonable to propose, based on the analysis of these model experiments, that the fact that a drought of such severity did occur in 2012 was largely coincidental and that such an occurrence was almost as likely during any year since the late 1990s but more likely than in the years prior. To be sure, the event likelihood is seen as a low probability in any
given year. Yet, it is plausible that, while perhaps unbeknownst and undetectable from the observations, the recent 10–15-yr period may have been one of heightened risk for the occurrence of a record setting summer drought over the central Great Plains. The indication from the model simulations is of an abrupt shift to a warmer (Fig. 8, bottom) and drier (Fig. 8, top) climate in the late 1990s over the Great Plains, at least relative to the climate of the preceding decade. (This is hard to discern based on the observational record alone as seen in Fig. 4) There are at least two candidate mechanisms that may explain the model behavior, both associated with known patterns of natural variability. One Fig . 8 Box-and-whisker plots of the May–Aug simulated central Great Plains (top) rainfall anomalies (mm) and (bottom) surface is a tropical Pacific shift with no temperature anomalies (°C) for 1979–2012. The distribution sumlarge El Niños but an abundance of marizes the statistics of
30 simulations for each summer. Red (blue) strong La Niñas in the period since asterisk denote the extreme dry (wet) ensemble member for each the 1997/98 El Niño. A second is a summer, and the dashed red lines are the model’s one standardsudden shift in North Atlantic SST ized departure of May–Aug precipitation and temperature. Green conditions from a persistent cool circles plot the observed values. The region consists of the six-state state during the 1980s to late 1990s, average of WY, CO, NE, KS, MO, and IA. Anomalies are relative to followed by a persistent warm state a 1981–2010 reference. 276 | FEBRUARY 2014 of the North Atlantic thereafter, consistent with North Atlantic multidecadal variability (e.g, Delworth and Mann 2000). Analysis of model sensitivity experiments by Schubert et al. (2009) found that a combination of warm Atlantic and cool tropical Pacific SST patterns produced substantial precipitation deficits and surface warming for annual-mean responses over
the continental United States. The model sensitivity is supported by empirical evidence for a relationship between natural multidecadal states of the Pacific and Atlantic Oceans and multidecadal drought frequency over the United States (McCabe et al. 2004) An additiona l quesFig. 9 (top) The NOAA official seasonal drought outlook for the contiguous United States issued on 17 May 2012 and valid for the period 17 May–31 Aug tion these results pose is 2012. (bottom) The equal-weighted composites of 12 operational centers’ whet her t he si mu lated seasonal predictions for Jun–Aug 2012 for (left) North American sector prechange in extreme drought cipitation departures (mm) and for (right) North American sector surface risk is a symptom of climate temperature anomalies (°C). Forecasts are based on May 2012 initializations change forcing related to Data source is the WMO GPC project (www.wmolcorg/) global warming. There are several indications that this behavior is largely unrelated
to the model’s sensitivity PREDICTIONS OF THE 2012 DROUGHT. to gradually increasing anthropogenic forcing. One The summer 2012 central Great Plains drought indication is the rather sudden character of change developed without an early warning. The National in model simulations toward dry conditions in the Oceanic and Atmospheric Administration (NOAA) late 1990s. Though one cannot dismiss the possibil- operational seasonal drought outlook, issued 17 May ity that a steady forcing (for instance increasing CO2) 2012 for the subsequent June–August period (Fig. 9, may provoke an abrupt change in responses, there are top), did not predict a tendency toward increasing other plausible physical explanations for the shift in drought over the central Great Plains. Instead, surface model behavior in the 1990s including natural swings moisture conditions were expected to improve over in ocean states as mentioned above. A second issue Iowa and western Nebraska Otherwise, the majority concerns the
lack of any appreciable long-term change of the central Great Plains was forecast to experience in seasonal-mean climate during the summer over near-normal moisture conditions. Only over the intethe central Great Plains since 1895 (see Fig 4) Nor rior west was drought expected to persist or intensify has there been an indication for an increasing trend The drought outlook ref lected three primary in the occurrences of severe summer droughts over considerations. One was the initial monitored state of the region, with the last severe drought happening drought, for which the U.S Drought Monitor revealed a quarter century earlier. Additional analysis will surface moisture over the Great Plains had appreciabe required to assess the role of global warming on bly recovered during winter/early spring The second recent precipitation variability over the Great Plains was the seasonal rainfall forecast, which did not yield using the full suite of the phase 5 of the Climate Model strong guidance
on the summer rainfall pattern. For Intercomparison Project (CMIP5) models. instance, the May 2012 initialized predictions for AMERICAN METEOROLOGICAL SOCIETY FEBRUARY 2014 | 277 June–August based on the composite of 12 centers’ seasonal forecast systems showed no appreciable rainfall signal (Fig. 9, bottom left), although it did indicate a widespread large amplitude warm signal (Fig. 9, bottom right) A third consideration for the drought outlook was the expectation for the rainy season onset. The climatological normal rainy season over the Great Plains is May–August. Since empirical and dynamical tools gave no strong reason to suspect it would not arrive as usual, those rains were expected to alleviate existing surface moisture deficits. In some ways, the drought outlook and the results from initialized coupled model predictions are not inconsistent with the retrospective climate simulations presented in the underlying causes for the 2012 drought section. There may,
however, be additional useful information in the ensemble spread of the retrospective climate simulations that were not readily available to the forecasters, especially concerning a possible increase in the tail-risk for severe drought. SUMMARY COMMENTS ON THE 2012 DROUGHT AND IMPLICATIONS FOR FORECASTING. Overall assessment of origin and cause. The 2012 drought developed rapidly over the central Great Plains during May and reached peak intensity by August. In many ways, the event was a “flash drought,” owing to the unusual speed and intensity with which it developed and became entrenched over the Great Plains in the summer. The 4-month cumulative rainfall deficit, averaged over a six-state area of the central Great Plains, was the greatest since record keeping began in 1895, ranking this event as the most severe summertime seasonal drought over the central Great Plains in 117 years, eclipsing 1988, 1934, and 1936. The immediate cause for the drought was predominately
meteorological in nature. This involved reduced Gulf of Mexico moisture transport and reduced cyclone and frontal activity in late spring. It also involved an inhibition of summer convection resulting from increased subsidence and atmospheric stabilization that accompanied anomalous upper-tropospheric high pressure over the region. The drought can thus be seen as a symptom of classical meteorological conditions that control the region’s warm season rains. The 2012 summertime central Great Plains drought resulted mostly from natural variations in weather. The assessment did not find substantial evidence for underlying causes associated with the effects of long-lived boundary forcings. Retrospective climate simulations identify a mean 278 | FEBRUARY 2014 dry signal during 2012 summer having a magnitude 4 times weaker than that observed for an area average of the Great Plains region. Indicated hereby is that neither the variations in ocean states nor in greenhouse gases played
significant roles in determining the intensity of the rainfall deficits in summer 2012. Furthermore, analysis of the retrospective climate simulations found virtually no dry signal over the major corn-producing regions of the eastern Great Plains including most of Missouri, Iowa, southern Wisconsin, Illinois, and Indiana where severe drought occurred and resulted in major curtailment of corn crop yields, indicating that neither the variations in ocean states nor in greenhouse gases played significant roles in determining the precise location of rainfall deficits during summer 2012. The simulations did reveal, however, a more substantial drying over the southwest United States and the far western Great Plains, especially New Mexico, Colorado, western Nebraska, western Kansas, and Wyoming. These areas also suffered severe drought in 2012. A few words are in order concerning the model suggestion of a regime shift to warmer and drier summers over the last 10–15 years, especially over the
southwest United States and western plains. The underlying tendency since the late 1990s for drought conditions over the United States has a plausible physical basis, being likely linked to natural states of the Pacific and Atlantic Oceans. In this sense, while the 2012 drought was not well predicted, it perhaps should not be a surprise that a drought of some severity occurred (see also McCabe et al. 2004) Large portions of the United States are experiencing a third year of drought, although the central plains drought of 2012 was not a simple progression or northward creeping of the prior year’s southern plains drought event. Further, the southwestern United States has been overwhelmingly in a state of abnormally dry or drought conditions since 1998. This widespread state of dryness appears at least qualitatively consistent with a longer time scale climate control associated with natural oceanic variability. In the Southwest, it is also consistent with the expected climate response
to rising greenhouse gases (e.g, Seager and Vecchi 2010), though that influence on precipitation is likely smaller at the current time than the influence of natural long-term variability. However, despite the role of these ocean and radiative boundary conditions in tilting the odds toward a dry state, the peculiar severity of summer 2012 can only be explained by an additional heavy role for random weather variability. Implications for drought prediction. What are some of the lessons learned in this assessment concerning U.S drought forecasting? On the one hand, the appraisal offered herein paints a picture of an extreme event that apparently had limited potential for skillful prediction. This conclusion would thus appear to be consistent with, and furthermore offer an explanation for, the poor performance of both official forecasts of drought and numerical predictions of rainfall that were rendered in late May 2012 for the subsequent June–August 2012 season. On the other hand,
our diagnosis of the spread among an ensemble of retrospective climate simulations indicates an increased probability for an extreme Great Plains drought event in 2012. For instance, the single driest simulation for Great Plains summer conditions, among the sample of 990 summer simulations during the entire 1979–2012 period analyzed herein (30 members for each year of the 33-yr period), occurred in the suite of 2012 runs. The models thus reveal that the so-called tail risk was heightened in summer 2012. Furthermore, these same simulations indicate that the statistical likelihood for a severe summer drought occurring over the Great Plains during the last decade may have been severalfold greater than the odds of occurrence during the prior period spanning the 1980s and 1990s. The retrospective analysis thus argues for elevated risk of an extreme drought event, even though the precise timing of any single event was uncertain and the overall strength of the signal on seasonal-mean
rainfall was quite small. Given the existing practices of operational drought prediction, what might have been the impact on the forecast process if various information contained in this assessment had been available in early 2012? It is useful to frame that question in the context of expected skill. The history of the operational seasonal forecast performance reveals little or no skill for U.S summer rainfall since routine forecasts were issued beginning in the mid-1990s. Furthermore, an assessment of U.S drought hindcast skill over a longer period since 1982 recently concluded that dynamical seasonal predictions did not materially increase summer skill over the Great Plains beyond a persistence forecast benchmark (Quan et al. 2012) The reason given for the limited overall skill was small SST sensitivity of that region’s summer rainfall and a small impact of antecedent soil moisture conditions, on average, upon the region’s summer rainfall. A pathway forward for summer drought
prediction might thus be to consider conditional skill and to identify so-called events of opportunity. There AMERICAN METEOROLOGICAL SOCIETY are ample examples of those for rainfall and drought during the cold season in the southern United States associated with the strong conditioning by the El Niño–Southern Oscillation phenomenon. For instance, there was considerable skill in the seasonal forecasts of the 2010/11 southern plains drought, especially during the winter and spring season (e.g, Hoerling et al 2013) The current study builds upon a body of climate sensitivity studies and physical reasoning that a conditioning of U.S summer rainfall by particular large-scale oceanic conditions may also exist (e.g, Schubert et al 2009; Findell and Delworth 2010). Yet, contrary to ENSO effects, the magnitude of that conditioning is still highly uncertain and requires further investigation before it can be quantitatively incorporated into seasonal forecasts. One of the opportunities for
improving seasonal drought predictions is to move toward expressing the outlooks in a probabilistic manner, as is done currently for seasonal forecasts of precipitation and surface temperature. The current drought outlook product is deterministic, notwithstanding some subjective language that attempts to express the most probable tendency of drought conditions over the upcoming season. The full information of ensemble prediction systems, in particular the spread information contained in such tools, can thus not be readily incorporated into current practices for U.S drought forecasting. Further research is also required on evaluating the spread information on drought statistics from such ensemble modeling systems. Much has yet to be learned about the robustness of spreads across multimodels and how those spreads differ when examined in simulation mode (using uninitialized models) versus prediction mode (using initialized models). In the case of the 2012 drought, for instance, it remains
to be determined if the particular event’s probability was materially conditioned by antecedent soil moisture. A related issue is the need to reconcile the identification of a modest Great Plains dry signal in the retrospective climate simulations studied herein with the lack of any dry signal in the summertime 2012 predictions of the World Meteorological Organization (WMO) Global Producing Centers (GPC) multimodel ensemble. It is unclear if this was a consequence of errors in the SST predictions. Did the process of averaging 12 different models and merging them in producing the GPC forecast cause large cancellation among appreciably different signals occurring in individual models? Or was the ensemble-mean prediction for drier than normal FEBRUARY 2014 | 279 conditions in these models simply too small in amplitude and thus perhaps deemed unreliable to include in the forecasts? One might reasonably wonder, given the suggestion from the rainfall time series produced in the
retrospective climate simulations, whether the risk of a severe Great Plains drought is once again elevated in 2013 or beyond. Clarification will require better knowledge of the factors controlling the low-frequency variability of Great Plains moisture conditions. The analysis presented here has mainly proposed the roles of long time scale natural variability in sea surface temperatures. And, while this study is not intended to be a comprehensive assessment of the possible effects of global warming on the 2012 central plains drought, the results here are inconclusive on that specific question. Here we merely note the conclusion of the U.S Climate Change Science Program Synthesis and Assessment Products (Dole 2008) that SST anomalies have been important in forcing some multiyear severe droughts over the United States during the last half-century, whereas short-term droughts (flash droughts having monthly seasonal time scales) were judged to be mostly due to atmospheric variability. The
report assessed that it is unlikely that a systematic change has occurred in either the frequency or area coverage of drought over the contiguous United States from the midtwentieth century to the present. Subsequently, in 2012, the Special Report of the Intergovernmental Panel on Climate Change (IPCC; Field et al. 2012) regarding extreme events expressed only medium confidence in a projected increase in drought in some regions by end of the twenty-first century, including the southern Great Plains and Mexico but not the northern plains and Midwest regions. How Great Plains drought will respond under global warming therefore continues to be a key unresolved question and a matter of future research (see also Hoerling et al. 2012) ACKNOWLEDGMENTS. The authors acknowledge resources and organizational support for the Drought Task Force from the Modeling, Analysis, Predictions and Projections Program (MAPP) of NOAA’s Climate Program Office; activities are supported by MAPP in partnership
with the National Integrated Drought Information System (NIDIS) Program. The authors also gratefully acknowledge support from their home institutions and various funding agencies, which help sustain their work. This research article is a follow-up study to an initial assessment of the 2012 Central Great Plains drought by the Drought Task Force Narrative Team (2013). Authors 280 | FEBRUARY 2014 gratefully acknowledge members of the Narrative Team and other Drought Task Force participants for their input and discussions. APPENDIX: CLIMATE MODEL SIMULATIONS. Two global atmospheric models are run over the period 1979–2012. The only constraining information representing observed conditions in these simulations is the sea surface temperature, sea ice, and external radiative forcing that are specified in the model as monthly time-evolving boundary conditions from January 1979 to December 2012. Climate simulations of this type are referred to as Atmospheric Model Intercomparison Project
(AMIP) experiments and are designed to determine the sensitivity of the atmosphere and the extent to which its temporal evolution is constrained by known boundary forcings. Key to this modeling technique for assessing the impact of boundary conditions is an ensemble approach, whereby the period of simulation is repeated a multitude of times. Here simulations that have been repeated 30 times (a 30-member ensemble) and that differ from one another only in the initial atmospheric conditions in January 1979, but in which identical time-evolving forcings are specified, are analyzed. The strategy is to average the monthly variability across the 30 members in order to determine the mean response to specified forcings. The process of averaging eliminates the random internal variability of the atmosphere and facilitates identifying the coherent signal from the forcing. One model used is the National Center for At mospheric Resea rch (NCAR) Communit y Atmosphere Model, version 4 (CAM4), global
climate model (Gent et al. 2011), with the simulations performed at a 1° ~100 km) resolution and 26 atmospheric levels, and for which a 20-member ensemble is available. The second global climate model is the European Center Hamburg model version 5 (ECHAM5; Roeckner et al. 2003), with simulations performed at T159 (~80km) resolution and 31 atmospheric levels and for which a 10-member ensemble is available. In both models, monthly varying SSTs and sea ice and the external radiative forcings consisting of greenhouse gases (e.g, CO2, CH4, NO2, O3, and CFCs) are specified. CAM4 runs also specify varying anthropogenic aerosols, solar, and volcanic aerosols. The model output has been interpolated to U.S climate divisions to facilitate comparison with observations. Ensemble means are computed by doing simple equal-weighted averages of the CAM4 and ECHAM5 20- and 10-member averages, respectively. For the May–August period and for a spatial average of the six-state central Great Plains
region, the combined GCMs’ climatological-mean precipitation (temperature) is 302 mm (22°C) versus 298 mm (20°C) observed. The standard deviation of May–August precipitation (temperature) in the combined GCM is 12 mm (0.9°C) versus 13 mm (0.7°C) observed REFERENCES Cook, B. I, R L Miller, and R Seager, 2009: Amplification of the North American Dust Bowl drought through human-induced land degradation. Proc Natl. Acad Sci USA, 106, 4997–5001 Dai, A., 2001: Global precipitation and thunderstorm frequencies. Part I: Seasonal and interannual variations J Climate, 14, 1092–1111 Delworth, T. L, and M E Mann, 2000: Observed and simulated multidecadal variability in the Northern Hemisphere. Climate Dyn, 16, 661–676 Ding, Q., B Wang, J M Wallace, and G Branstator, 2011: Tropical–extratropical teleconnections in boreal summer: Observed interannual variability. J. Climate, 24, 1878–1896 Dole, R. M, 2000: Prospects for drought forecasts in the United States. Drought: A Global
Assessment, D A Wilhite, Ed., Routledge, 83–99 , Ed., 2008: Reanalysis of historical climate data for key atmospheric features: Implications for attribution of causes of observed change. A Report by the U.S Climate Change Science Program and the Subcommittee on Global Change Research, Randall Dole, Martin Hoerling, and Siegfried Schubert, Eds., National Oceanic and Atmospheric Administration National Climatic Data Center, 136 pp. [Available online at http://downloads.globalchangegov/sap /sap1-3/sap1-3-final-all.pdf] Drought Task Force Narrative Team, 2013: An interpretation of the origins of the 2012 central Great Plains drought. NIDIS Assessment Rep, 44 pp [Available online at w w w.droughtgov/drought/content /drought-task-force-report-page.] Field, C. B, and Coauthors, Eds, 2012: Special Report on Managing the Risks of Extreme Events and Disasters to Advance Climate Change Adaptation (SREX). Cambridge University Press, 582 pp. Findell, K. L, and T L Delworth, 2010: Impact of common
sea surface temperature anomalies on global drought and pluvial frequency. J Climate, 23, 485–503. AMERICAN METEOROLOGICAL SOCIETY Gent, P. R, and Coauthors, 2011: The Community Climate System Model version 4. J Climate, 24, 4973–4991. Hoerling, M. P, and A Kumar, 2003: The perfect ocean for drought. Science, 299, 691–694 , X. Qua n, a nd J Eischeid, 20 09: Distinct causes for two principal U.S droughts of the 20th century. Geophys Res Lett, 36, L19708, doi:10.1029/2009GL039860 , J. Eischeid, X Quan, H Diaz, R Webb, R Dole, and D. Easterling, 2012: Is a transition to semipermanent drought conditions imminent in the US Great Plains? J. Climate, 25, 8380–8386 , and Coauthors, 2013: Anatomy of an extreme event. J Climate, 26, 2811–2832 Huang, J., H van den Dool, and K Georgokakis, 1996: Analysis of model-calculated soil moisture over the U.S (1931–1993) and applications to long range temperature forecasts J Climate, 9, 1350–1362 Kumar, A., S Schubert, and M Suarez, 2003:
Variability and predictability of 200-mb seasonal mean heights during summer and winter. J Geophys Res, 108, 4169, doi:10.1029/2002JD002728 Kushnir, Y., R Seager, M Ting, N Naik, and J Nakamura, 2010: Mechanisms of tropical Atlantic influence on North American hydroclimate variability. J Climate, 23, 5610–5628 Madden, R., and J Williams, 1978: The correlation between temperature and precipitation in the United States and Europe. Mon Wea Rev, 106, 142–147 McCabe, G. J, M A Palecki, and J L Betancourt, 2004: Pacific and Atlantic Ocean inf luences on multidecadal drought frequency in the United States. Proc Natl. Acad Sci USA, 101, 4136–4141 Quan, X. W, M P Hoerling, B Lyon, A Kumar, M A Bell, M. K Tippett, and H Wang, 2012: Prospects for dynamical prediction of meteorological drought. J. Appl Meteor Climatol, 51, 1238–1252 Roeckner, E., and Coauthors, 2003: The atmospheric general circulation model ECHAM5. Part I: Model description. Max Planck Institute for Meteorology Rep. 349,
127 pp [Available online at wwwmpimet .mpgde/fileadmin/models/echam/mpi report 349 .pdf] Schubert, S. D, M J Suarez, P J Pegion, M A Kistler, and A. Kumer, 2002: Predictability of zonal means during boreal summer. J Climate, 15, 420–434 , , , R. D Koster, and J T Bacmeister, 2004a: Causes of long-term drought in the United States Great Plains. J Climate, 17, 485–503 , , , , and , 2004b: On the cause of the 1930s Dust Bowl. Science, 33, 1855–1859, doi:10.1126/science1095048 FEBRUARY 2014 | 281 , and Coauthors, 2009: A U.S CLIVAR project to assess and compare the responses of global climate models to drought-related SST forcing patterns: Overview and results. J Climate, 22, 5251–5272 Seager, R., and G Vecchi, 2010: Greenhouse warming and the 21st century hydroclimate of southwestern North America. Proc Natl Acad Sci USA, 107, 21 277–21 282. , Y. Kushnir, C Herweijer, N Naik, and J Velez, 2005: Modeling of tropical forcing of persistent 282 | FEBRUARY 2014 droughts and
pluvials over western North America: 1856–2000. J Climate, 18, 4068–4091 , L. Goddard, J Nakamura, N Henderson, and D. Lee, 2014: Dynamical causes of the 2010/11 Texas– northern Mexico drought. J Hydrometeor, in press Wang, H., S D Schubert, M J Suarez, J Chen, M. Hoerling, A Kumar, and P Pegion, 2009: Attribution of the seasonality and regionality in climate trends over the United States during 1950–2000. J. Climate, 22, 2571–2590