Comments
No comments yet. You can be the first!
What did others read after this?


Content extract
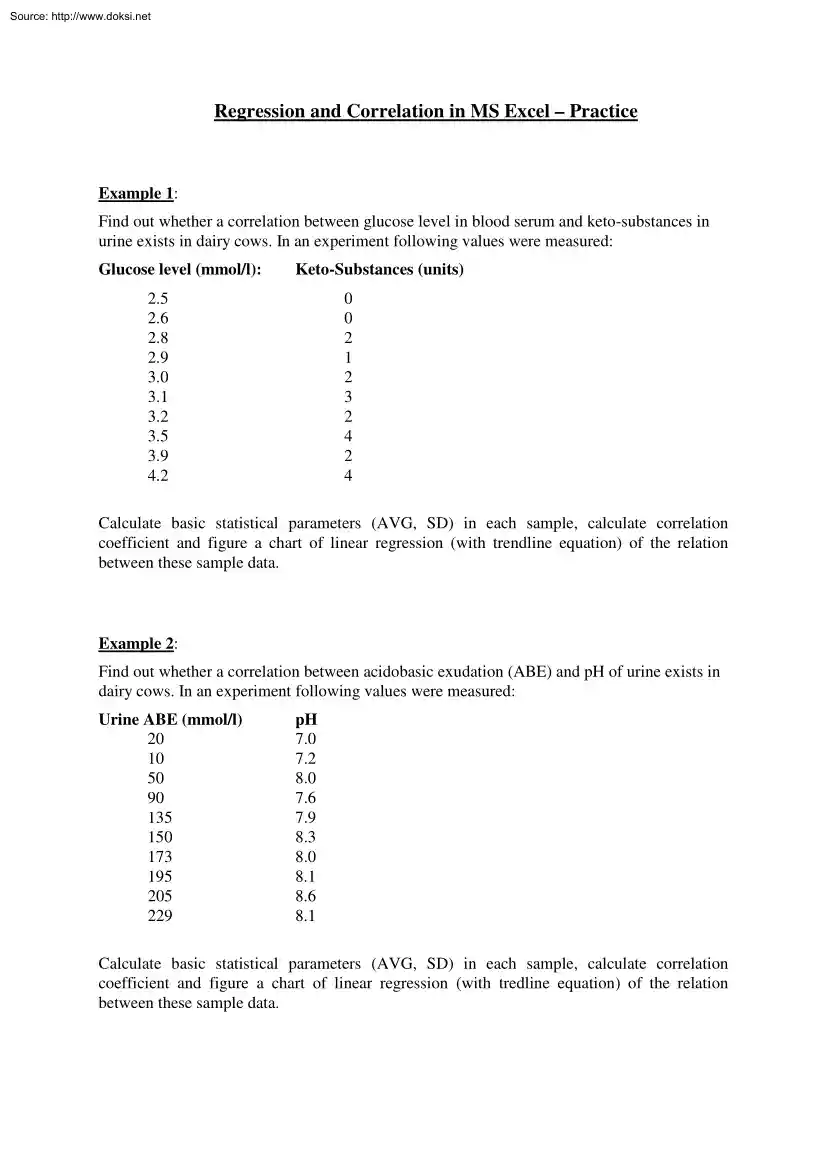
Source: http://www.doksinet Regression and Correlation in MS Excel – Practice Example 1: Find out whether a correlation between glucose level in blood serum and keto-substances in urine exists in dairy cows. In an experiment following values were measured: Glucose level (mmol/l): Keto-Substances (units) 2.5 2.6 2.8 2.9 3.0 3.1 3.2 3.5 3.9 4.2 0 0 2 1 2 3 2 4 2 4 Calculate basic statistical parameters (AVG, SD) in each sample, calculate correlation coefficient and figure a chart of linear regression (with trendline equation) of the relation between these sample data. Example 2: Find out whether a correlation between acidobasic exudation (ABE) and pH of urine exists in dairy cows. In an experiment following values were measured: Urine ABE (mmol/l) 20 10 50 90 135 150 173 195 205 229 pH 7.0 7.2 8.0 7.6 7.9 8.3 8.0 8.1 8.6 8.1 Calculate basic statistical parameters (AVG, SD) in each sample, calculate correlation coefficient and figure a chart of linear regression (with tredline
equation) of the relation between these sample data
equation) of the relation between these sample data
 Just like you draw up a plan when you’re going to war, building a house, or even going on vacation, you need to draw up a plan for your business. This tutorial will help you to clearly see where you are and make it possible to understand where you’re going.