Please log in to read this in our online viewer!
Please log in to read this in our online viewer!
No comments yet. You can be the first!


Content extract
Edith Cowan University Research Online Theses : Honours Theses 2001 High school students food choices: A nutrient analysis of students canteen purchases at four high schools Jenny Kora Edith Cowan University Follow this and additional works at: https://ro.ecueduau/theses hons Part of the Dietetics and Clinical Nutrition Commons, and the School Psychology Commons Recommended Citation Kora, J. (2001) High school students food choices: A nutrient analysis of students canteen purchases at four high schools. https://roecueduau/theses hons/1435 This Thesis is posted at Research Online. https://ro.ecueduau/theses hons/1435 Edith Cowan University Copyright Warning You may print or download ONE copy of this document for the purpose of your own research or study. The University does not authorize you to copy, communicate or otherwise make available electronically to any other person any copyright material contained on this site. You are reminded of the following: Copyright owners
are entitled to take legal action against persons who infringe their copyright. A reproduction of material that is protected by copyright may be a copyright infringement. A court may impose penalties and award damages in relation to offences and infringements relating to copyright material. Higher penalties may apply, and higher damages may be awarded, for offences and infringements involving the conversion of material into digital or electronic form. EDITH COWAN UNIVERSITY High School Students Food Choices: A Nutrient Analysis of Students Canteen Purchases at Four High Schools By JennyKora A Thesis Submitted in Partial Fulfilment of the Requirements for the Award of Bachelor of Education with Honours at the Faculty of Community Services, Education and Social Services Edith Cowan University Supervisor: Dr Delia Quinn Date of Submission: 6th November 2001 USE OF THESIS The Use of Thesis statement is not included in this version of the thesis. EDITH COWAN
UNIVERSITY Declaration I certify that this thesis does not, to the best of my knowledge and belief: (i) incorporate without acknowledgment any material previously submitted for a degree or diploma in any institution of higher education; (ii) contain any material previously published or written by another person except where due reference has been made in the text; or (iii) Signed; contain any defamatory material. Date: Itt 06 I /o / I 3 EDITH COWAN UNIVERSITY Acknowledgements I wish to express my appreciation to the people who provided assistance during this project. Sincere thanks to Dr Delia Quinn for your advice, guidance and dislike of superfluous words - you helped me to get to the point. Thank you for your unending support at all stages of this project. Grateful appreciation for the assistance of Principals, teachers and students who participated in this project. A special thank you to canteen staff for your cheerful assistance with additional telephone
queries. Thank you to Robin Bromley at the WASCA for your time in supplying valuable information regarding the STARCAP program. Finally to Vern, who put up with me and fed me during some of the treacherous stages of this project. Your winning ways with frozen potato gems are a marvel. 4 Abstract Links exist between poor eating habits established during childhood and adolescence and the development of dental decay, obesity and anaemia early in life (Ruxton, Kirk, Belton & Holmes, 1993; Douglas, 1999), as well as a number of diseases of affluence, including cardiovascular disease, diabetes and some cancers later in life (Baranowski et al., 1993; Birch, 1993; National Health and Medical Research Council, 1995; Antine, 1997; Harris et al., 1997; Douglas, 1998; Melnik, Rhoades, Wales, Cowel & Wolfe, 1998; Cholin, 1999; Huon, Wardle & Szabo, 1999). Adolescence has been identified as a umque stage in the life cycle when increased amounts of nutrients are required due to
rapid growth. It has been suggested that the food and beverage items consumed by students while at school should contribute approximately one-third of their daily nutrient intake (Perth Dental Hospital and Community Dental Services, 1999). Since the mid-1980s, greater awareness of school-time eating habits has resulted in a number of initiatives aimed at promoting more healthful canteens in Australian schools. In Western Australia, the Western Australian School Canteen Association (WASCA) assists schools to adopt and maintain healthy canteens. One of WASCAs strategies is the Star Accreditation Program (STARCAP), which awards schools that operate healthy canteens using a star rating system. similar to that used in the hospitality and tourism industry 5 The Starcap programs aim is to "increase the availability, promotion and sales of healthier food choices . in schools in Western Australia" (Western Australian School Canteen Association, 2000, p. 2) The purpose of this
study was to compare the nutrient intakes of students school-time food and beverage consumption of two STARCAP canteens and two REGULAR canteens and the National Health and Medical Research Councils (1991) Recommended Dietary Intakes. Four Perth metropolitan co-educational government high schools were selected to participate in this study; two schools with canteens that were participating in the STARCAP program and two schools with REGULAR canteens. Using a modified version of the 24-hour food recall method, students in two Year 8 classes at each school were asked to recall one days food and beverage items consumed whilst at school. Analysis of data included evaluating what was offered for sale at each canteen, as well as comparing the proportion·of students who consumed the majority of their school-time food intake from the school canteen to those who consumed foods mostly brought from home. The students mean nutrient intakes of food and beverage items consumed from each canteen
were ascertained using a nutrient analysis software package (SERVE), and comparisons were made with the National Health and Medical Councils (1991) Recommended Dietary Intakes. 6 The findings from this study could be used to indicate how the STARCAP programs aim to increase the availability of healthier food choices in school canteens affects the nutrient and energy intakes of students. Furthermore, findings could have implications for future health promotion initiatives with regard to school canteens and education programs directed at adolescents. 7 Table of Contents TITLE PAGE . 1 USE OF THESIS . 2 DECLARATION . 3 ACI<NOWLEDGEMENTS . 4 ABSTRACT . 5 TABLE OF CONTENTS . 8 LIST OF TABLES . 12 LIST OF FIGURES . 13 LIST OF APPENDICES . 14 CHAPTER 1: INTRODUCTION . 15 Background to the Study . 15 Significance of the Study . 16 Purpose of the Study . 16 CHAPTER 2: LITERATURE REVIEW . 17 Introduction . ~ 17 Eating Habits and Diseases of Affluence . 17 Nutritional Concerns
During Adolescence . 19 Characteristics of Adolescence . 21 Nutritional Importance of School-time Food Intake . 23 School Canteens in Australia . 25 STARCAP Accreditation . 27 Summary . 28 Research Questions . 30 8 CHAPTER 3: MATERIALS AND METHODS . 31 Research Design . 31 Sample Selection . 33 Instruments and Equipment . 35 Data Collection Procedure . 37 Data Analysis . 40 Limitations . 45 CHAPTER 4: RESULTS . 47 Introduction . 4 7 School Canteen Menus - What Do They Offer? . 4 7 Sandwiches/Rolls . 49 Hot Savouries . 49 Hot Meals . 50 Salads/Fresh Fruit . 50 Cakes/Pastries . 50 Ice Confection/Dairy . 51 Confectionery . ~ 52 Beverages . 52 Daily Specials . 53 Who Purchased Items from the Canteen? . 53 Canteen Food as a Source of Nutrients- How Does Each Canteen Compare? . 54 Nutrient Intakes -How Do They Measure Up to the RDis and National Targets? . 58 Macronutrients . 58 Protein . 58 9 Carbohydrates . 59 Total Fat . 60 Dietary Fibre . 62 Vitamins . , 64 Folate . 64
Minerals . 65 Calcium . 65 Iron . 66 Summary . 68 CHAPTER 5: DISCUSSION . 70 Introduction . 70 Canteen Food Consumption Patterns . 70 Sandwiches/R.olls 71 Hot Savouries . 73 Hot Meals . 75 Salads/Fresh Fruit . 76 Cakes/Pastries . 78 Ice Confection/Dairy . 79 Confectionery . 80 Beverages . 82 Daily Specials . 83 Canteen Usage . 85 Nutrient Intakes - How Do They Measure Up to the RDis and National Targets? . 86 Macronutrients . 86 Protein . 86 10 Carbohydrates . 88 Total Fat. 90 Fibre . 92 Vitamins . 94 Folate . 94 Minerals . 9 5 Calcium . 95 Iron . 97 Summary . 99 CHAPTER 6: SUMMARY AND RECOMMENDATIONS . 102 REFERENCES . 108 APPENDIX A . 116 APPENDIX B . 118 APPENDIX C . 119 APPENDIX D . 120 11 List of Tables Table: Page: 1. Sample population by canteen, gender and mean age . 34 2. Weekly median household income ($AUS) of participating schools . 35 3. Sample for data analysis by canteen type, gender and mean age . 41 4. Food items offered for sale at the two Starcap
canteens and the two Regular canteens . 48 5. Gender, number and percentage of students who purchased items from each canteen or consumed no food or beverage items . 53 6. Mean nutrient intakes for female students . 54 7. Mean nutrient intakes for male students . 55 8. Example food recalls from REGULAR canteen . 56 9. Percentages ofRDis and National Targets obtained from canteen food consumption for each sub-group . 57 12 List of Figures Figure: Page: 1. Total gram weight and percentage contribution of canteenderived and home-brought foods to total school-time food intake . 42 2. Mean canteen-derived protein intake and% ofRDI . 58 3. Mean canteen-derived carbohydrate intake and % of Target set for carbohydrate as a proportion of total energy . 59 4. Mean canteen-derived total fat intake and % of Target set for fat as a proportion of total energy . 60 5. Percentage of canteen-derived monounsaturated, polyunsaturated and saturated fat to total energy intake .
62 6. Mean canteen-derived fibre intake and% of recommended intake . 63 7. Mean canteen-derived folate intake and% ofRDI . 64 8. Mean canteen-derived calcium intake and% ofRDI. 65 9. Mean canteen-derived iron intake and% ofRDI . 66 10. Percentage of canteen purchases from each food category . 71 11. Contribution of consumption of sausage rolls to saturated fat intake . 74 12. Canteen-derived types and number ofbeverages purchased by students . 96 13 List of Appendices Appendix: Page: A. Copy of permission letter to Principals . 116 B. Copy of data collection instrument. 118 C. Copy of data collection procedure . 119 D. Copy of student consent form . 120 14 CHAPTER! Introduction Background to the Study School canteens in Australia have been charged with the responsibility for providing over a third of students daily nutrient requirements (Perth Dental Hospital and Community Dental Services, 1999) and it is estimated that one quarter of students
purchase food and beverage items from school canteens daily (Western Australian School Cante,en Association, 2000, p. 2) School canteens are increasingly being encouraged to provide nutritious food and beverage items consistent with current dietary recommendations. This is due, in part, to mounting evidence fo~ diet-related links between eating patterns established during childhood and adolescence and the occurrence of diseases of affluence in adulthood (Baranowski et al., 1993; Birch, 1993; NHMRC, 1995; Antine, 1997; Harris et al., 1997; Douglas, 1998; Melnik, Rhoades, Wales, Cowel & Wolfe, 1998; Cholin, 1999; Huon, Wardle & Szabo, 1999; Law, 2000; Livingstone & Robson, 2000). In Western Australia, the Star Canteen Accreditation Program (STARCAP) was launched in July 1996. This program is an initiative of The Western Australian School Canteen Association (WASCA), in partnership with the Heart 15 Foundation of Australia (WA Division) and the Nutrition Program of the
Health Department of Western Australia. The STARCAP program aims to "increase the availability, promotion and sales of healthier food choices . in in Western Australia" schools (Western Australian School Canteen Association, 2000, p. 2) Significance of the Study Up to now, a nutritional analysis of food and beverage items consumed from STARCAP canteens does not appear to have been carried out to determine whether the programs aim to increase sales of healthier food choices in Western Australian school canteens actually provides students with improved nutrient intake. Purpose of the Study The aim of this study was to determine whether the mean nutrient intake of foods consumed from STARCAP registered canteens better meet the National Health and Medical Research Councils (1991) Recommended Dietary Intakes and the Goals and Targets for Australias Health in the Year 2000 and Beyond (1993) than the mean nutrient intake from REGULAR canteens. This study has both local
and national relevance with implications for future practice and poli~yin this area ofhealth. 16 CHAPTER2 Literature Review Introduction This literature review begins with a discussion concerning the links between eating habits that are established during childhood and adolescence and the development of various diseases of affluence later in life. Nutritional concerns specific to adolescence are examined, followed by a discussion of factors that can influence food choice during this unique stage in the life cycle. The nutritional importance of school-time food intake is assessed, as well as the role of school canteens. Health-directed school canteen initiatives since the mid-1980s are discussed and this review concludes with an analysis of the Western Australian School Canteen Associations STARCAP accreditation program. Eating Habits and Diseases of Affluence It is now well recognised that links exist between poor eating habits during both childhood and adolescence and the
development of dental decay, obesity and anaemia early in life (Ruxton, Kirk, Belton & Holmes, 1993; Douglas, 1999; johnson, 2000; Booth, Wake, Armstrong, Chey, Hesketh & Mathur, 17 2001) as well as a number of diseases of affluence including cardiovascular disease, diabetes and .some forms of cancer, later in life (Baranowski et al, 1993; Birch, 1993; NHMRC, 1995; Antine, 1997; Harris et al., 1997; Douglas, 1998; Melnik, Rhoades, Wales, Cowel & Wolfe, 1998; Cholin, 1999; Huon, Wardle & Szabo, 1999; Law, 2000; Livingstone & Robson, 2000). For example, cardiovascular disease is responsible for 41% of all deaths in Australia (Heart Foundation of Australia, 1999, p. 6) and poor diet has been recognised as a contributing factor (Ball, 1997a, p. 373) Diet has also been linked to the prevalence of Type II diabetes. According to Ball, approximately 3% of the Australian population is affected by diabetes, which then rises to between 10 to 15% of the population for
those over the age of 60 (1997b, p. 384). Similarly, a significant body ofliterature has focused on the relationship between diet and the prevalence of some forms of cancers. Huon, Wardle and Szabo maintain that "in developed countries 30% to 40% of cancers in men and up to 60% of cancers in women are attributable to diet" (1999, p. 156) To promote health, growth and development and to prevent the incidence of diseases of affluence, childhood and adolescence are life cycle stages that have been identified as important for dietary intervention (Baranowski et al, 1993; Douglas, 1998; Huon, Cholin, 1999; Wardle & Szabo, 1999). Many studies have investigated the nutrient intake of children and adolescents and findings have revealed they are often not meeting dietary recommendations. Instead, diets are generally characterised by higher than recommended intakes of fats (particularly saturated fat), sugar and sodium, and low vitamin, mineral and 18 fibre·intakes (Ruxton,
Kirk, Belton & Holmes, 1993; Gibbons, Wertheim, Paxton, Petrovich & S.zmukler, 1995; Church, 1997) Nutritional Concerns During Adolescence Adolescence has been defined as a period of "rapid physical growth, [with] large increases in hormone levels and the appearance of secondary sexual characteristics" (ODea, Abraham & Heard, 1996, p. 32) ODea (1995), NHMRC (1995), Seaman, Bower and Fleming (1997), and Neumark-Sztainer, Story, Perry and Casey (1999) have stated that it is a time when nutrient needs are higher than any other time in the life cycle except during pregnancy and lactation. Studies that have investigated the nutritional status of adolescent diets have indicated that in particular iron (Cobiac & Baghurst, 1993), calcium (Huon, Wardle & Szabo, 1999; Johnson, 2000) and fibre (Antine, 1997; Huon, Wardle & Szabo, 1999; Johnson, 2000) intakes are below the recommendations set out in the National Health and Medical Research Councils (1991)
Recommended Dietary Intakes. Therefore, each of these nutrients and their role in the adolescent diet is discussed. Dietary intake of iron is essential "to ensure the supply of oxygen to cells and tissues and for the production of energy" (Cobiac & Baghurst, 1993, p. S3) According to Jones (1997d, p. 252) common symptoms of iron deficiency 19 include anaemia and lethargy. Cobiac and Baghurst (1993) and ODea (1995) have agreed that a number of factors place a greater requirement for iron in the adolescent diet such as: rapid growth spurts, involvement in sport, dieting, vegetarianism and the commencement of menstruation. During adolescence, calcium is important for building maximal bone density and to reduce the risk of osteoporosis later in life. "Total peak bone ± 1.3 years [and therefore] mass . reaches 90 per cent of its peak by age 169 the opportunity to greatly influence bone mass acquisition must occur before late adolescence" (Weaver, 2000,
p. 515) Of concern is Huon, Wardle and Szabos (1999) findings from the 1995 National Nutrition Survey which revealed calcium intakes were less than the NHMRCs (1991) Recommended Dietary Intake for this nutrient for adolescent boys aged 12 to 15 years and females in most age groups. There is evidence concerning the protective effects of dietary fibre against diverticular disease and colon cancer (Jones, 1997c, p. 219) However, Antine (1997) has reported that fibre consumption reduces incrementally with age throughout adolescence due to the reduction in the consumption of fruits, vegetables and cereals. In support of Antines claim, Huon, Wardle and Szabo (1999) recorded a reduction in fruit consumption in a survey of the dietary intakes of 5,224 Australian schoolchildren aged between 10 and 15 years carried out in 1985. The findings revealed that only 561% of 12-year-old boys and 65.5% of i 1-year-old girls consumed any fruits on the day of the survey Mag;arey, Daniels and Smith (2001)
compared the 1985 data with the 1995 20 National Nutrition Survey for the same age group and concluded that 10 years on, fruit consumption for this age group had declined even more. Characteristics of Adolescence Adolescence is a unique stage in the life cycle when socio-cultural factors such as increasing independence, the media, sporting commitments, part-time employment and academic studies can affect food intake (Magarey & Boulton, 1995; NHMRC, 1995; Kennedy, 1996; Meyer & Conklin, 1998; Pirouznia, 2001). In addition, many adolescents experience pressure to conform to the slim body ideal and various studies have shown that adolescents, particularly girls, have a poor body image (ODea, 1995; Nowak, 1998; Nowak & Crawford, 1998; Story, Neumark-Sztainer, Sherwood, Stang & Murray; 1998; Sherwood & Neumark-Sztainer, 2001). Increasing independence was a contentious factor that emerged in the literature as influencing the food choices of adolescents (Owen,
Schickler & Davies, 1997; Douglas, 1998; Meyer, 2000). While Cholin argued that younger adolescents do not have much control over what and how food is presented to them, (1999, p. 104), Douglas claimed that as adolescents become increasingly independent with age, they have increased freedom to select whatever food they want during school-time and for snacks (1998, p. 14) 21 Peer pressure has been identified as another contentious factor that can affect adolescent food choice. While Magarey & Boulton asserted peer pressure to be "a strong determinant of food choice at this age" (1995, p. 132), Williams, et al. surveyed 2,082 Tasmanian high school students about their food perceptions and stated that peer influence did not play a particularly powerful role in food choice. They maintained that "techniques that enhance resistance to peer pressure do not need much emphasis in nutrition education for this age group" (1993, p. 161) ODea, Abraham & Heard
(1996) acknowledged that while weight gain is a normal part of adolescent development, many aspire to the slim ideal. Nowak and Crawfords (1998) inquiry into Queensland secondary school students concerns and views about food related issues revealed that weight control was the most important issue for girls, while for boys fitness was the most important concern. They attributed the gender difference to "the societal expectation of thinness in women and a muscular look in men" (1998, p. 6) Birch (1993), ODea (1995), Story, et al. (1998) and Sherwood & NeumarkSztainer (2001) identified potential hazards associated with adolescent dieting to include: lower nutrient and energy intakes due to food restriction practices~ higher levels of fatigue, use of laxatives, cigarette smoking and eating disorders. The proportion of the adolescent population engaged in weight control strategies, particularly restrictive food practices, has been the focus of many 22 studies with
much variance between reported results. Story et al (1998), stated that in the United States "approximately two-thirds of adolescent girls and about one-quarter of adolescent boys are actively attempting to control their weight" (1998, p. 1127) In Australia, Steinbeck (1995) estimated that approximately eighty percent of adolescents practice restrictive food behaviours while ODea, Abraham & Heard (1996) reported that dieting and other weight control practices have been undertaken by between 20 and 45 percent of the Australian adolescent population. Nutritional Importance of School-Time Food Intake Foods consumed during school-time provide a significant proportion of energy and nutrients to daily dietary intake. During the early 1990s, the nutrient profile of both school canteen and home-brought adolescent school-time food intakes were investigated in the United States and United Kingdom (Tilston, Neale, Gregson & Douglas, 1992; Worsfold & Griffith, 1992;
Ruxton et al., 1993). These inquiries revealed that the food items available from school canteens were mostly nutritionally imbalanced, with higher than recommended amounts of fats (especially saturated fat), protein, sodium and sugar and less than recommended amounts of iron, calcium and some vitamins. When comparing the nutritional quality of school meals served in the USA and UK with home-brought lunches, research findings are numerous but yield 23 inconsistent results (Tilson et al., 1992; Worsfold & Griffith, 1992; Bmja, Bordi & Lambert, 1996; Douglas, 1999). Tilson et al. compared the nutritional profile of canteen meals to home-brought lunches for one week at a school in the United Kingdom. They concluded that the average school meal contained 36 percent more energy than the average packed lunch and stated that students who consumed home-brought lunches may be receiving a diet deficient in energy. Similarly, when Borja, Bordi and Lambert summarised findings from
the US Department of Agricultures School Nutrition Dietary Assessment Study, they reported that students who ate school meals consumed significantly more energy from fat compared to students who brought their lunch from home (1996, p. 908) In some contrast to these investigations, Millers (1993) report regarding the nutrient profile of home-brought lunches concluded that while canteens are often cited as selling food and beverage items of poor nutritional quality, "surveys reveal that packed lunches .frequently contain foods and drinks of low nutritional value" (p. 12) However, when McBride investigated the effect of canteen menu on nutritional knowledge, attitudes and behaviour of Year 5 students in Western Australia, she argued that students who brought food from home appeared to eat more nutritious food and suggested that the promotion of nutritious home-prepared foods in schools may be beneficial (1992, p. 88) To improve the nutritional status of food available in
schools, the United Kingdoms Department of Health advised that school meals should contribute 24 one-third of students energy intake (Church, 1997). Presently, the one million free school meals served daily in the United Kingdom are obliged to comply with nutritional guidelines set out by the Caroline Walker Trust. In the United States, the Healthy Meals for Healthy Americans Act 1994 stated that the 25.7 million National School Lunch Program lunches served daily must provide one-third of the Recommended Dietary Allowance (RDA) for all nutrients (Chapman, Gordon & Bargharat, 1995; Bmja, Bordi & Lambert, 1996; Guthrie, 1996). In Australia, the National Health and Medical Research Council sets out Recommended Dietary Intakes (RDis) for total food intake, but there are not recommendations for school meals as national lunch programs are not a feature of the Australian school system. School Canteens in Australia The Federation of Canteens in Schools (FOCIS) which was
established in 1994 incorporates the national network of school canteen associations throughout Australia (Carter & Kellett, 1996). Carter and Kellett (1996) and Valentini, Walker and Riddell (1997) stated that school canteens collectively represent Australias largest take-away food outlet, with approximately 7,000 canteens catering to over one million students. Because school canteens are located within educational institutions, many believe they have a health-promoting role and should support health education mes~ages taught in schools (McBride & Browne, 1993; Kennedy, 1996; Story, 25 1996; Valentini, Walker & Riddell1997; Cholin, 1999; St. Leger & Nutbeam, 2000; Row ling & Rissel, 2000). Students are not usually permitted to leave the school grounds during school-time and, therefore, canteens are unique in that their customers usually have little or no choice about whether or not to utilise their service. This, coupled with Douglas (1998) and Valentini,
Walker and Riddells (1997) assertions that societal changes, such as the return of mothers to the workforce and reduced time available for meal preparation, has meant that adolescents tum increasingly to the school canteen as a source of food. In 1992, the Queensland Department of Education investigated issues related to adolescents and food and revealed that approximately seventy-five percent of parents and teachers believed school canteens should sell healthy food products (Kennedy, 1996). In support of this, McBrides inquiry into the effect of the school canteen on nutritional knowledge, attitudes and behaviour of Year 5 students revealed that nearly all of the students believed their canteen should sell healthy food (1992, p. 84) In response to the recognised nutritional implications of school-time food intake, there have been a number of initiatives aimed at promoting more healthful canteens in Australian schools (Victorian Dairy Industry Authority, 1978; The Australian
Nutrition Foundation Inc, 1985; National Heart Foundation (Western Australia Division), Foundation, 1995). 1993; Health Development Since the early 1990s, the Australian Nutrition Foundation in particular has been active in the promotion of healthful school canteen initiatives (Valentini, Walker & Riddell, 1997). 26 STARCAP Accreditation In Western Australia, the Western Australian School Canteen Association (WASCA) assists schools to adopt and maintain healthful canteens and healthy profits by targeting three groups: canteen managers and operators, health and education professionals, and the food industry (School canteens How can I be a catalyst for change? n.d) One of WASCAs strategies is the Star Accreditation Program (STARCAP), which was launched in mid-1996 in partnership with the Heart Foundation of Australia (WA Division) and the Nutrition Program of the Health Department of Western Australia. The STARCAP program awards schools that operate healthy canteens using
a star rating similar to that used in the hospitality and tourism industry. At July 2001, 98 schools in Western Australia were registered on the program (K. Dobson, personal communication, July 31, 2001). The STARCAP program is "committed to increasing the availability, promotion and sales of healthier food choices, consistent with the Australian Dietary Guidelines for Children and Adolescents in schools in Western Australia" (WASCA Inc, 2000, p. 2) In order to become accredited, school canteens must meet a number of criteria which include: a commitment to providing healthy foods for sale; the promotion of school and community involvement; and the practice of safe food handling. The STARCAP program asserts that it is different from other health-directed canteen initiatives because school canteens 27 must produce sales records as evidence of the percentage of takings from sales of recommended and registered food and beverage items. The STARCAP program consists ofthree
levels of accreditation: three-star, fourstar and five-star. Canteens that achieve accreditation are rewarded with food service equipment vouchers to the value of $150, $250 and $450 respectively. In addition, the STARCAP program includes incentives such as public recognition for the canteen manager and school, as well as a framed certificate. Most importantly, the program provides assurance to parents and students that their school canteen "is a model of best practice in all areas of food service" (WASCA Inc, 2000, p. 6) Summary There are a number ofkey issues that arose from the review of the literature. It is now well established that the occurrence of diseases of affluence are linked with poor eating habits established during childhood and adolescence. These diseases can be prevented, in some cases, and one prevention strategy is to adopt healthy eating habits from a young age. However, many studies that have investigated childhood and adolescent nutrient profiles have
reported that generally they are not meeting current intake recommendations. Adolescence has been identified as a umque stage in the life cycle when incr~ased nutrients are required for rapid growth and development. However, 28 it is also a time when a number of factors may adversely influence dietary behaviour such as: increasing independence, the media and preoccupation with body image and pressure to conform to slim body ideals. Foods consumed during school-time provide a significant proportion of nutrients and energy to daily dietary intake and because school canteens are located within educational institutions, many believe they have a healthpromoting role and should support health education messages taught in schools. In response to the recognised nutritional implications of school-time food intake, there have been a number of initiatives aimed at promoting more healthful canteens in Australian schools. In Western Australia, the Star Accreditation Program (STARCAP) was
launched in 1996 with the aim to "increase the availability, promotion and sales of healthier food choices . in schools in Western Australia" (Western Australian School Canteen Association, 2000, p. 2) To date, it seems that no nutrient intake analysis has been conducted to assess whether the STARCAP program is better meeting the nutritional needs of students compared to REGULAR canteens. Further, there are no identified local studies which address the research questions of this study. 29 Research Questions Are there any nutritional differences between the school-time eating profiles of Year 8 students who consume foods from STARCAP registered canteens and REGULAR canteens? 1. What food items are offered for sale at the two STARCAP canteens and the two REGULAR canteens? 2. What is the proportion of Year 8 students who consume canteen-derived food items compared to the proportion of Year 8 students who consume home-brought foods? 3. What are the comparative
nutrient profiles of students school-time food and beverage intakes from the two STARCAP canteens and the two REGULAR canteens? 4. What are the comparative nutrient profiles of the Year 8 students schooltime food and beverage intakes from the two STARCAP canteens and the two REGULAR canteens in relation to the National Health and Medical Research Councils (1991) Recommended Dietary Intakes and the Goals and Targets for Australias Health in the Year 2000 and Beyond (1993)? 30 CHAPTER3 Materials and Methods This chapter begins with an explanation about the canteen selection process and the sample groups who participated in this study. The research design is explained and the development of the food recall instrument that was used to collect data is presented and explained. The data collection procedure is discussed, as well as how the data were analysed. Limitations have been considered and are provided at the end of this chapter. Research Design The design for this study
was base~ on four stages that are common in any dietary assessment procedure as outlined by Gibson (1993, p. 1) Accordingly, dietary assessment for this study included: measuring food consumption, assessing nutrient contributions of foods consumed, assessing absorbed intakes and evaluating nutrient intakes in relation to the National Health and Medical Councils (1991) Recommended Dietary Intakes (RDis) and the Goals and Targets for Australias Health in the Year 2000 and Beyond (1993). The 24-hour recall method was selected for collection of data but this method was slightly modified in that participants were only required to recall foods 31 consumed on the school site for one day until the end of lunchtime, which was a 5-hour period of time. However, this time period varied slightly from school to school due to differing timetables but according to Young ( 1993 ), concentrating on a shorter time than 24-hours should produce more accurate responses from participants (p. 6) The
24-hour recall method was considered the most appropriate for this study for a number of reasons. It is less intrusive than other methods and according to Livingstone & Robson, is "more likely to be acceptable to adolescents" (2000, p. 289) This method was also suitable due to its "high compliance, low cost, ease and speed of use . [and its] element of surprise so that the respondent is less likely to modify his or her eating habits" (Gibson, 1993, p. 5). Finally, the food recall method was ideal for this study because "food recall data can be used to characterise the mean food intake of groups" (Gibson, 1993, p. 5) The focus of this study was on two groups of Year 8 students: one group with STARCAP registered canteens and one group with REGULAR canteens. Once consent was obtained from school Principals and students, data were collected in class groups at the commencement of lessons immediately after lunch (where practicable). The researcher
modelled how to complete the recall instrument using food models as visual aids and by thinking aloud the cognitive processes involved in this exercise. Students were then asked to recall and list their own school-time food intake on an instrument that was developed for this study. 32 Once data were collected, mean nutrient intakes of canteen-derived food and beverage consumption were obtained for both STARCAP and REGULAR groups of participants using the computer-based nutrient analysis software package SERVE Nutrition Management System version 3.99 for Microsoft™ Windows®. These intakes were then compared to the National Health and Medical Councils (1991) Recommended Dietary Intakes and the Goals and Targets for Australias Health in the Year 2000 and Beyond (1993). Sample Selection The selection of high schools for this study was criterion-based, depending on whether they had canteens that were registered on the STARCAP program or not. Four co-educational government high
schools in the Perth metropolitan area were selected to participate in this study: two schools had canteens that were registered in the STARCAP program (S 1 and S2), and two high schools had REGULAR canteens (S 3 and S4). The participants are what Huck and Cormer (1996) refer to as convenience samples because they were selected to participate on the basis of availability (p. 109) Year 8 students were chosen to participate in this study because according to Piagets theory of cognitive development cited in Woolfolk (1998), at this age most students are operating in the formal-operational stage which is characterised by the capability to perform "mental tasks involving abstract thin~ing and coordination of a number of variables" (p. 37) The ability to 33 retrieve information from memory as accurately as possible and to estimate accurate amounts of f-oods consumed in terms of quantities were essential to the validity of the food recall method which was used for this
study. Students in attendance during two Year 8 Horne Economics classes from each of the four schools were invited to participate after obtaining written permission from each schools Principal (see Appendix A for copy of permission letter to Principals). Accordingly, this study was undertaken with n=64 students from the two schools with STARCAP canteens and n=65 students from the two schools with REGULAR canteens (total students n=129). Fiftynine percent of the students were female and 41% of the students were male The sample population by canteen type, gender and mean age is shown in Table 1. Table 1. Sample population by canteen, gender and mean age Females STARCAP: REGULAR: Males n x age n x age Total N 51 20 13.6 14 13.4 34 52 17 13.7 13 13.5 30 18 13.2 11 13.2 29 21 13.3 15 13.4 36 Total 129 Home Economics/Health & Physical Education are curriculum contributors to nutrition education within Western Australian high schools and are compulsory
34 subjects for Year 8 students. Beyond this level, student subject selections would cause distinct -inter-student differences, hence Year 8 students were selected for this study. Access for data collection was preferred through Home Economics classes as these provide smaller groups which facilitated rigorous and precise food record collection. During the canteen selection process, other variables that affect food choice were taken into account. For example, socio-economic status was considered to ensure, as far as practicable, that students had the same access to financial resources to spend at the canteen. The Australian Bureau of Statistics Census of Population and Housing (1996) data were used to determine the socioeconomic status of each school location according to statistical local area and are expressed in terms of weekly median household income in Table 2. Table 2. Weekly median household income ($AUS) of participating schools REGULAR: STARCAP: 51 Total 53 54
Total $499 $1166 $513 $686 $1199 Instruments and Equipment A food recall instrument was developed to collect food intake data for this study (see Appendix B for copy of data collection instrument). Prior to data coll~ction, the instrument was assessed by a high school nutrition educator who 35 has over 20 years experience teaching Year 8 level students. On the basis of feedback from this assessment, the instrument was modified slightly to ensure its design was age-sensitive and compatible with the cognitive ability of Year 8 students. The instrument required students to provide their gender and date of birth, as well as listing all food and beverage items consumed on the school site until the end of lunchtime on the day of data collection. The field where students listed their food intake was divided into three sectional rows (Before School Started, Morning Recess and Lunch) to account for the characteristic dietary patterns of adolescents which include "frequent
snacking . grazing and meal skipping" (Livingstone & Robson, 2000, p. 289) This field was also divided into three columns (Name of Food or Drink, Amount of Food or Drink and Where Did the Food or Drink Come From: C=Canteen/H=Home) so that along with listing all items consumed, students were also required to provide information regarding quantities and sources of food and beverage items consumed. The computer-based nutrient analysis program SERVE Nutrition Management System version 3.99 for Microsoft™ Windows® was used to analyse the nutrient levels of food items. This program makes use of two food composition databases: AUSNUT and NUTTAB95. The AUSNUT database has been developed by the Australia New Zealand Food Authority and contains nutrient composition information for approximately 5,000 foods. The 36 NUTTAB95 database contains nutrition composition for approximately 1,800 foods and nutrients. Data Collection Procedure Data were collected by the researcher
with some guided assistance from classroom teachers. Students perceived the exercise as an important class activity and gave their full co-operation. While collecting data for this study, quality control procedures were used to ensure that both random and systematic influences were minimised. For example, a standard discourse was used for collecting data (see Appendix C for copy of data collection procedure) and students were not informed about the study prior to data collection. According to Chambers, Godwin & Vecchio, this would have minimised the risk of students altering their normal food patterns (2000, p. 308) After students were invited to participate in this study and were told they would be required to complete a food recall sheet each, consent forms were duly signed (see Appendix D for copy of student consent form). A written example school-time food intake was displayed on the blackboard by the researcher, accompanied by a range of food models which served as
visual aids to assist with minimising errors associated with portion sizes. Because this study was concerned primarily with canteen-derived food and beverage 37 consumption, the models used were food items that were actually available for sale from the school canteens. This is in accordance with Chambers, Goodwin & Vecchios inquiry into preferred aids for food recalls in which they stated that participants prefer aids that are similar in size and shape to actual portions consumed (2000, p. 891) Blank food recall sheets were distributed to each participant and the process of completing a food recall sheet was modelled to demonstrate how to list food items and record related information about each item. During the modelling demonstration, the researcher thought aloud the cognitive processes involved in recalling information and referred to the food models as a guide to estimate portion sizes. For example, "I ate half of my friends banana at recess time which was this size
[holding up model banana for class to view]. I think this is a medium-sized banana and my friend brought it from home". Once the demonstration was completed, students were invited to ask questions, which were answered by the researcher. Students were then instructed to think carefully about what food and beverage items they consumed on the school site for that day before completing their recall sheets. While students completed this exercise, the researcher and classroom teacher monitored and assisted students. As food recall sheets were completed, clarification by the researcher with each student regarding portion size, quantity and source of listed food items was 38 determined using the multiple pass method which Brady, Lindquist, Herd & Goran (2000, p. 363) describe as follows: Pass 1: Participants recorded and listed everything they consumed on the school site up until the end of lunch on the day of data collection. Pass 2: A more detailed description of listed
items was elicited by the researcher and/or classroom teacher, such as confirmation of brand names and portion sizes. Pass 3: All food and beverage items were further clarified by the researcher with the aid of the example lunch to assist memory recall and confirm quantities and measures of listed items. The multiple pass process took approximately 40 minutes to complete for each of the four sub-groups who participated in this study. This process was deemed necessary to ensure that the accuracy of each students recalled dietary consumption was maximised. For six of the eight classes who participated in this study, data collection took place at the commencement of lessons immediately after lunch which would have helped to promote valid responses from participants. Domel-Baxter, Thompson, Davis and Johnson (1997) investigated the accuracy of selfreporting of school lunch intake by 10-year-old children and found that same day reporting yielded 84% accuracy. For the other two
classes, data collection 39 was carried out at the commencement of lessons the following morning. This was the best practicable time for those two sites. Data Analysis To answer each research question, data were processed in different ways. For Research Question 1 - to determine what food and beverage items were offered for sale at the two STARCAP canteens and the two REGULAR canteens - menus from each canteen were obtained and food and beverage items offered for sale are presented according to food categories in the Results chapter. For Research Question 2 - to determine the proportions of students who purchased foods from the two STARCAP canteens, the two REGULAR canteens and brought foods from home - recall sheets that listed food and/or beverage items purchased from the canteen were coded C for Canteen and food recall sheets that listed no canteen purchases coded H for Home. A table illustrating the percentages of students consuming food and beverage items from each
canteen, from home or who recalled consuming no food during school-time is included in the Results chapter. In order to answer Research Questions 3 and 4 - to determine the comparative nutrient profiles of students school-time food and beverage intake from each canteen and to compare mean nutrient intakes to the National Health and Medicql Research Councils (1991) Recommended Dietary Intakes and the 40 Goals and Targets for Australias Health in the Year 2000 and Beyond- recall sheets were coded aceording to canteen type and gender. It should be noted that four students intakes were not included for analysis because their canteen purchases were considered insignificant. The items recalled by each student were: 1 x potato wedge, 1 x gulp of coke, 1 x 5g hard candy, and 1 x 3g hard candy. There were four sub-groups for the purpose of data analysis as described in Table 3. Table 3. Sample for data analysis by canteen type, gender and mean age Females n STARCAP: REGULAR: -
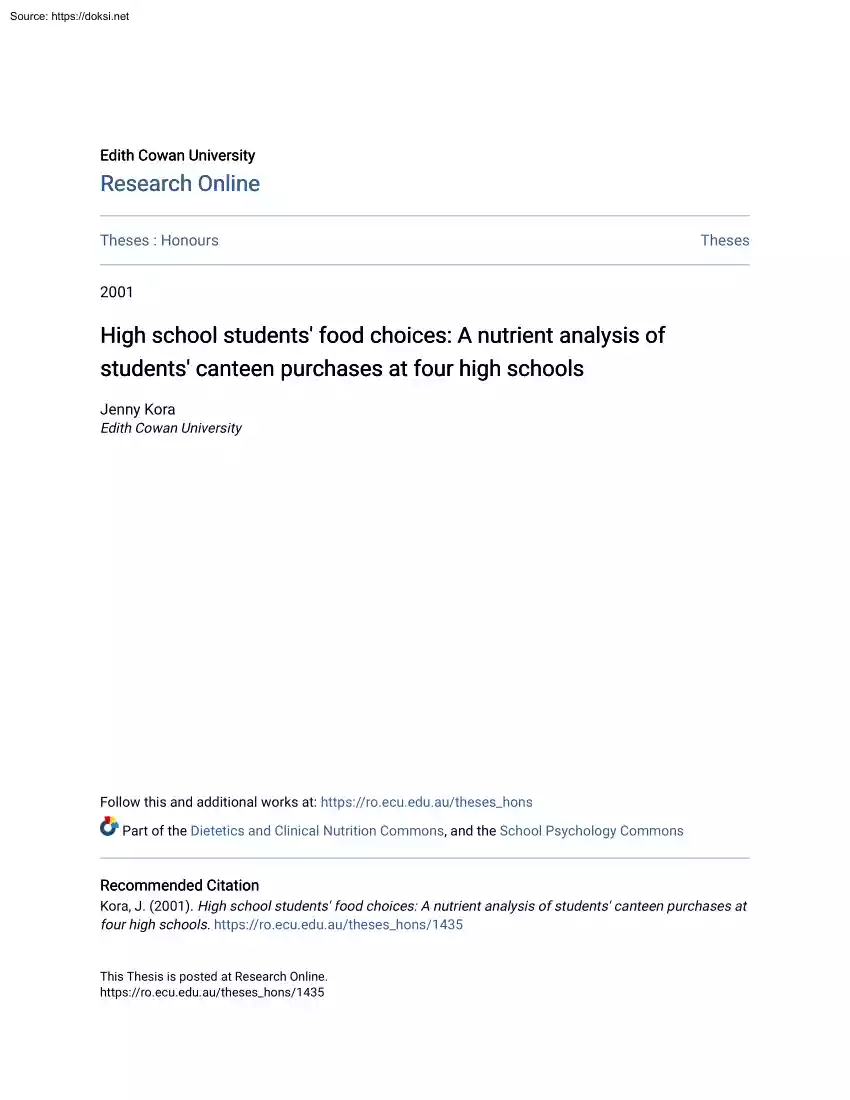
Males x age n - x age Total n 51 10 13.4 10 13.5 20 52 8 13.8 6 13.8 14 11 13.4 6 13.1 17 12 13.4 9 13.5 21 Total 72 Of the 72 students who recalled consuming foods from the canteen, it should be noted that for 49 of these students (69%), canteen-derived food did not total 100% oftheir school-time food intake. In addition to recalling canteen-derived foods, these students also recalled consuming foods brought from home. 41 It is generally expected that the foods consumed at school should supply one- third of daily nutrient·requirements. For the majority of students in this study however, food sourced from the canteen did not account for 100% of schooltime food intake and was instead comprised of a combination of both canteen and home-brought foods. Therefore, it would be unreasonable to expect canteen food alone to contribute one-third to daily nutrient intake. Because one main aim of this study was to compare canteen-derived food consumption
with the RDis and Targets, it was necessary to ascertain the proportion of canteen and home-brought foods to total school-time intake to determine a benchmark percentage for how much canteen food could be expected to contribute to daily nutrient requirements. Accordingly, the total gram weight of both canteen and home-brought foods was calculated. As Figure 1 illustrates, canteen-derived foods accounted for 75% of total schooltime food intake for the students in this study and could therefore be proportionately expected to supply approximately 23% of daily nutrient requirements. • Home Food 75% Figure 1. Total gram weight and percentage contribution of canteen-derived and homebrought foods to total school-time food intake 42 Although all food and beverage items consumed on the school-site until the end of lunch were re.called, only canteen-derived foods were coded for data entry. A number of studies have analysed home-brought school-time food consumption (Tilston, Neale,
Gregson & Douglas, 1992; Douglas, 1999; Hughes & Clifford, 2000). These studies involved teams of recorders who collected and recorded precise information regarding portion sizes, types and quantities of home-brought foods prior to consumption. For this study, a nutrient analysis for home-brought foods was not completed as the aims of this study focused on canteen foods. The computer-based nutrient analysis program SERVE Nutrition Management System version 3.99 for Microsoft™ Windows® was used to perform the analysis. Each students canteen-derived food consumption was entered into SERVE to determine individual nutrient profiles. SERVE includes a function whereby intakes can be combined and once individual analysis was completed, the combining of intakes was determined depending on each students canteen type and gender to arrive at a nutrie<nt intake for each of the four-sub groups. The combined intakes were then divided by the number of students in each sub-group to
determine a mean nutrient intake for each canteen and gender. When creating intakes, SERVE requires information regarding age, height, weight and activity level because these are factors that influence an individuals nutrient requirements. Information regarding each participants height and weight were not collected so mean height by age and mean weight 43 by age data from the National Nutrition Survey (1995) Selected Highlights were used for this purpose. As mentioned earlier, SERVE makes use of two food composition databases: AUSNUT and NUTTAB95 which contain nutrition composition information for approximately 5,000 and 1,800 foods and nutrients respectively. However, there were a number of food items recalled by participants which are not specified identically in either of these databases. For example, food items that were prepared by canteen staff needed to be entered manually. In this instance, SERVE has the facility for new food items to be created and added to its
database. To create new food items, weights and measures for each ingredient contained in each food item had to be entered after consulting with canteen staff regarding ingredient and preparation methods. In addition, there were food items that are produced by manufacturers specifically for industries such as school canteens and which are not available for retail sale. Again, these items were not contained in either SERVE database and needed to be entered manually. An example is OK Yo ice confection and the manufacturer was consulted to ascertain ingredient and nutrient information for this product. Once sub-group mean intakes for selected nutrients were ascertained, independent samples t-tests compared STARCAP and REGULAR canteen female and male intakes. Mean nutrient intakes were then compared with the National Hea~thand Medical Research Councils (1991) Recommended Dietary Intakes 44 for boys and girls aged 12-15 years and the Goals and Targets for Australias Health in the
Year 2000 and Beyond (1993). Limitations While every care was taken to ensure that the participants selected for this study were representative of the corresponding population, it should be noted that convenience sampling may contain bias. The food-recall method is short-term in its focus. It is recognised that a single days school-time food intake may not be representative of usual nutrient intake or eating patterns. Sodium was not included for analysis in this study because the AUSNUT database does not provide information regarding the sodium content of foods. The National Health and Medical Research Councils (1991) Recommended Dietary Iritakes are expressed as mean recommendations and are intended as a guideline when assessing nutrient intake over a reasonable period of time. They have been calculated to allow for factors such as variation in absorption and metabolism and are based on estimates of nutrient requirements depending on factors such as age and sex, with a generous
safety factor added. It should be noted that the RDis "exceed the actual nutrient requirements of practically 45 all healthy persons and are not synonymous with individual nutrient requirements" (NHMRC, 1991, p. v) 46 CHAPTER4 Results Introduction In order to address each research question, this chapter is divided into four sections, beginning with an explanation of what was offered for sale at each canteen. This is followed by an evaluation of who purchased items from each canteen. A comparison of each group of students mean intakes for selected nutrients is then presented and compared to the National Health and Medical Research Councils (1991) Recommended Dietary Intakes (RDis) and the Goals and Targets for Australias Health in the Year 2000 and Beyond (1993). School Canteen Menus- What Do They Offer? Food and beverage items which were offered for sale at each canteen that participated in this study are presented according to food categories in Table 4. 47
Table 4. Food items offered for sale at the two STARCAP canteens and the two REGULAR canteens STARCAP: Sandwiches/Rolls: Chicken, Ham, Beef, Cheese, Egg, Salad, Vegem Peanut Butter Extras: Salad, Beetroot, Pineapple, Mustard, Pickles, Mayonnaise, Chilli Sauce Buttered/Plain Rolls Toasted Sandwiches Sausage Rolls Hot Chicken Rolls Vegetable Burgers Hot Chicken & Corn* Hot Snagger Buns* Hot Pizza Singles* Hot Snack Size Pies* Sandwiches/Rolls Sandwiches/Rolls/Pitta Bread HYrrbre, White or Wholemeal: Ham, Chicken, Cheese, Beef, Egg, Tuna, Salad- plus salad optional Toasted Sandwiches Hot Savouries Chiko Roll Cheesies Pizza Singles/Pizza Cheesies Hot Hawaiian Roll Hot Meals Lasagne Spaghetti Bolognaise Hot Soup of the Day Spaghetti Bolognaise Salads/Fresh Fruit Salad Box Fresh Fruit Fresh Fruit Salad Tubs Fresh Fruit Cakes/Pastries Muffins Ice Confection/Dairy Yoga Yoghurt Ice Creams* Frozen Yo hurt* Limited range of confectionery Paris Buns* Cinnamon Buns* Assorted
Cakes (Fridays only) Yoga Ice Creams* Confectionery Beverages Daily Specials Limited range of confectionery Flavoured Mineral Water Plain Milk (300m!) Flavoured Milk (300m! and 600ml) Choc/BananafCheny/Coffee Fruit Juice (250m! and 500ml) Spring Water (600ml) Flavoured Milk (300m! and 600ml) Fruit Juices (Small and Large) Water 100% Apple Juice 100% Orange Juice Monday: Tuesday: Wednesday: Thursday: Monday: Friday: Open Sandwich Toasted Steak Sandwich Quiche & Salad Leg Ham, Lettuce, Avocado & Sundried Tomatoes Bacon, Lettuce, Tomato & Avocado Roll Tuesday: Wednesday: Thursday: Friday: Pies/Potato Pies PastiesNegetable Pies Chicken Burger Beef & Gravy Roll Hamburger Deep Sea Burger REGULAR: Sandwiches - Multigrain - no butter Rolls - White/Wholemeal- no butter Pittas - White with Sour Cream Ham, Chicken, Cheese, Egg, Tuna, Pineapple, Salad, Vegemite, Peanut Butter, Cottage Cheese, Mustard, Mayonnaise, Pickles, Chutney, Cream Cheese, Pumpkin Seeds,
Walnuts, Sprouts, Celery Toasted Sandwiches Pizza Chicken Drummies Cheezies Pies Sausage Rolls Vegetarian Pies Vegetarian Sausage Rolls Hamburgers HotDogs Bacon & Egg Burgers BLT Burgers Vege Burgers Chicken Burgers Corn Cobettes Spring Rolls (mini) Spicy Chicken Wings/Sweet Chilli Chicken Tender Croissants- Ham, Cheese, Tomato & Chicken Smokeys Bruschetta Chicken Kebab Hot Garlic or Herb Bread Chicken and Mayo Hot Rolls Quiche Stuffed Potatoes Baked Potatoes with Sour Cream Hot Soup (winter only) Hot Pasta & PotatoNegetable dishes. Fruit Trays Fresh Fruit Salad Fresh Salad (eg, pasta, potato, rice etc) Garden Salad Fresh Fruit Assorted Cakes, Muffins, Iced Buns & Biscuits Yoghurts Ice Creams•• Ice Blocks•• Sandwiches/Rolls Cheese, Ham, Egg, Tuna, Chicken, Salad, Vegemite, Peanut Paste Buttered Rolls Toasted Sandwiches Chico Roll Cornjack Chicken & Corn Roll Sausage Rolls Cheese & Bacon Sausage Rolls Hash Browns Onion Rings Cheesies Cheese
Croissants/Ham Wedges Pies Fish Burger Chicken Burger Hamburger Steak Sandwich HotDog Hot Dog with Cheese Sausage & Onion Roll Roast Beef Roll Roundas Pizzas Bruschetta Chicken Nuggets Noodles Nachos Spaghetti Lasagne Fettuccine Carbonara Bangers & Mash Beef Stroganoff BeefTeriyaki Chicken Risotto Fresh Fruit Fresh Fruit Salad Garden Salad Assorted Cakes Danishes Assorted Ice Creams and Ice Confections Assorted confectionery- includes chocolate novelty bars etc Assorted confectionery- includes chocolate novelty bars etc Milk Flavoured Milk Daily 100% Juice Berri Fruit Boxes Berri Flavoured Mineral Water Orange C (250m! and 500ml) Tea Coffee Milo Assorted specials -changes regularly Assorted beverages- changes regularly, including soft drinks, fruit juices, flavoured/plain milk, water Assorted specials- changes regularly * Available Recess Only * Avail able Lunch Only The similarities and differences between canteen menus are summarised as follows: Sandwiches/Rolls
For the Sandwiches/Rolls category, all four canteens offered similar choices of breads and fillings. STARCAP There were two main differences worth noting: one canteen (S 1) offered Hyfibre white bread as an option for sandwiches and one REGULAR canteen (S 3) offered multi-grain bread as an option for sandwiches. This REGULAR canteen also used no spread (butter or margarine) in the preparation of their sandwiches or rolls. Hot Savouries In the Hot Savouries category, REGULAR canteens offered approximately four times more items for sale (n=45) thah STARCAP canteens (n=ll). The foods in this category are generally high in fat, especially saturated fat, and foods consumed from this category contributed 5.5g or 63% of total saturated fat intake for REGULAR students. STARCAP students consumed slightly more saturated fat from foods in this category at 5. 7g, however saturated fat resulting from the consumption of hot savoury items contributed less to their total intake of saturated
fat at 51%. 49 Hot Meals For the Hot Meals category, REGULAR canteens again offered for sale a great many more items (n=14) than STARCAP canteens (n=4). These foods were not major purchases with the students in this study; only two students from REGULAR canteens recalled consuming items from this category (spaghetti bolognaise and a baked potato), while STARCAP students consumed no Hot Meal items. Salads/Fresh Fruit Each canteen offered a range of items for sale in the Salads/Fresh Fruit category, with REGULAR canteens offering twice as many items (n=8) as STARCAP canteens (n=4). No students in this study recalled consuming any items from this category. This is of concern because these items are generally low in fat (if not accompanied with high-fat dressings) and are excellent sources of vitamins, minerals and dietary fibre which are essential for growth, maintaining health and to protect against disease (Jones, 1997c, p. 215) Cakes/Pastries In the Cakes/Pastries
category, REGULAR canteens offered for sale a wide range of commercially prepared items, while STARCAP canteens offered only a 50 few choices. One STARCAP canteen (S 2 ) did include an assortment of cakes on their menu, but limited the sale of these items to Fridays. This canteen also offered Paris buns and cinnamon buns for sale every day, but these items were only available at recess. Despite the STARCAP canteens restrictions on the sale of cake and pastry items, more STARCAP students (17%) recorded consuming items from this category than REGULAR students (12%). Ice Confection/Dairy All canteens included on their menus a range of ice cream and frozen confection products in the Ice Confection/Dairy category. The sale of ice confection products was restricted to lunchtime in all but one REGULAR canteen (S 4). These items proved very popular with STARCAP students, who consumed 34.43mg or 14% of their total calcium intake from the consumption of these products compared to
REGULAR students who consumed only 5.67mg or 4% of their total calcium intake from ice confection products purchased from the canteen. In addition, one STARCAP canteen (S 1) and one REGULAR canteen (S 3) also offered yoghurts for sale and both STARCAP canteens included a dairy food product (Yo Go) on their menus. No student in this study recalled consuming a yoghurt or dairy food item from the canteen. 51 Confectionery In the Confectionery category, REGULAR canteens offered a wide selection of items including chocolate novelty bars, boiled lollies and jelly-type sweets while one STARCAP canteen (S 2 ) offered three confectionery items for sale and the other STARCAP canteen (S 1) did not include any confectionery items on its menu. Consequently, REGULAR students consumed a great deal more sugar than STARCAP students from the Confectionery category, obtaining 10.32g or 16.4% of total sugar intake from the consumption of canteen-derived confectionery items compared to STARCAP
students, who consumed 3.54g or 0.04% oftotal sugar from this category Beverages All canteens offered a range of beverages for sale including flavoured milks, water, fruit drinks and fruit juice.· In addition, one REGULAR canteen (S 3) included hot drinks on their menu while the other REGULAR canteen (S 4) included a range of carbonated soft drink beverages in various serve sizes and flavours. Consequently, the consumption of soft drinks purchased from the canteen accounted for 20. 78g or 47% of total sugar intake for REGULAR students. 52 Daily Specials All canteens featured Daily Specials on their menus. STARCAP canteens offered a range of specials for each weekday and REGULAR canteens offered promotional specials usually comprising of meal deals, eg, Mrs Macs Giant Sausage Roll and 600ml Coke. No students in this study recalled consuming any items from this category. Who Purchased Items from the Canteen? More REGULAR students (64%) purchased food items from the canteen
than STARCAP students (53%). The gender, number and percentage of students who purchased items from the canteen are compared to students who made no canteen purchases or recalled consuming no food items during school-time in Table 5. Table 5. Gender, number and percentage of students who purchased items from each canteen or consumed no food or beverage items. STARCAP: REGULAR: n female n male Total n % n female n male Total n % Canteen Purchases 18 16 34 53 26 16 42 64 No Canteen Purchases 18 10 28 44 11 9 20 31 2 3 2 1 3 5 No Food Intake 53 Canteen Food as a Source of Nutrients - How Does Each Canteen Compare? For both canteen types, independent samples t tests compared Female and Male mean nutrient intakes. Table 6 shows that for Females, there was a significant difference for canteen-derived calcium intake. Table 6. Mean nutrient intakes for female students 5TARCAP n =18 REGULAR n =23 x ±50 x ±so t p Protein (g) 14.2 ± 10.9
9.4 ± 10.6 1.421 NS Carbohydrate (g) 58.0 ± 36.3 65.3 ± 44.9 2.337 NS Monounsaturated Fat (g) 6.8 ± 7.2 4.4 ± 4.8 1.252 NS Polyunsaturated Fat (g) 1.6 ± 2.1 1.8 ± 2.0 -.356 NS Saturated Fat (g) 10.9 ± 9.8 6.4 ± 8.2 1.621 NS Total Fat (g) 29.0 ± 18.8 13.6 ± 14.3 1.410 NS 1736.1 ±12098 .575 NS Energy (kJ) Fibre (g) Folate (ug) Calcium (mg) Iron (mg) * 1966.4 ±13477 1.7 ± 25.6 ± 2.1 1.8 ± 1.9 -.151 NS 16.3 19.5 ± 20.2 1.040 NS 118.6 ± 1532 2.192 p<.05 1.2 .245 274.7 ± 2701 1.1 ± 1.2 1.0 ± NS Equal variances were not assumed in this t-test For male students, Table 7 shows that there were no statistically significant differences between mean intakes at the two types of canteens for any of the nutrients analysed in this study. 54 Table 7. Mean nutrient intakes for male students 5TARCAP n =16 REGULAR n =15 x ± SD x±SD t p Protein (g) 15.5 ± 19.4 19.4 ± 14.7 -.626 NS Carbohydrate
(g) 61.4 ± 52.1 90.6 ± 66.8 -1.361 NS Monounsaturated Fat (g) 7.5 ± 9.8 8.9 ± 7.7 -.461 NS Polyunsaturated Fat (g) 1.8 ± 2.7 4.1 ± 5.6 -1.451 NS Saturated Fat (g) 11.5 ± 14.7 11.1 ± 10.8 .099 NS Total Fat (g) 22.9 ± 28.2 25.9 ± 21.1 -.327 NS 2790.1 ±18955 -.913 NS Energy (kJ) Fibre (g) Folate (ug) Calcium (mg) Iron (mg) * 2121.1 ±21654 2.1 ± 2.1 4.4 ± 5.1 -1.666 NS 28.0 ± 25.7 44.7 ± 53.3 -1.128 NS 136.9 ± 1540 1.244 NS 1.4 -1.742 NS 257.5 ± 3535 1.1 ± 1.2 2.0 ± Equal variances were not assumed in this t-test The variability of intakes illustrated in Tables 6 and 7 is due to a number of reasons. Firstly, there were differences between the food items each canteen offered for sale from which students could select. Secondly, this study had a small sample size which would have increased variability, and thirdly, what students consumed was, typically, highly variable between individuals. To demonstrate the
extent of this variability, the following two recalls are presented in Table 8. 55 Table 8. Example food recalls from REGULAR canteen Student: ID/1 0 Name of food or drink: Before School Started: Croissant (medium) Student: ID/31 Amount of food or drink: Canteen/ Home Name of food or drink: Amount of food or drink: Canteen/ Home Before School Started: 1 c Morning Recess: Morning Recess: Piece of Pizza (medium) 1 Chicken and Corn Roll 1 Sun Fruit Lollies 55g Lunch: Giant Sausage Roll 1 1 Sauce Portion 1 Sprite Lemonade 600ml 1 c c c c c c Lunch: Bucket Potato Wedges 1 Pineapple Juice Box 1 c c The nutrient analysis of canteen food intakes revealed that all sub-groups in this study obtained over one-third of the recommendation that carbohydrates contribute at least 55% to total energy intake. For the remainder of the nutrients analysed in this study however, all sub-groups fell short of meeting one-third of the dietary recommendations, with the exception
of REGULAR Male students who obtained 38% of the RDI for protein from canteen food consumption. Table 9 illustrates the percentage of RDis and National Targets obtained from canteen food consumption for each sub-group. 56 Table 9. Percentages of RDis and National Targets obtained from canteen food consumption for each sub-group STARCAP REGULAR Females Males Females Males Protein 29 30 19 38 Carbohydrates 49 48 62 53 Total Fat 37 37 27 33 Energy (kJ) 21 18 18 24 Fibre 6 7 6 15 Folate 13 10 14 24 Calcium 27 21 12 11 Iron 9 10 9 17 Overall, REGULAR Males obtained the highest percentage contributions to dietary recommendations from canteen-derived foods for each nutrient except calcium. This indicates that the canteen-derived foods consumed by this subgroup best assisted their nutritional needs It must be remembered that for the students in this study, canteen food consumption accounted for 75% of total school-time food intake, with 25%
being derived from foods brought from home. Therefore, the benchmark percentage that canteen foods could be expected to contribute to the RDis and Targets for the nutrients analysed in this study is approximately 23%. 57 Nutrient Intakes- How Do They Measure Up to the RDis and National Targets? Mean nutrient intakes resulting from canteen-derived food consumption are presented in this section, along with the main food items that contributed to each nutrient. Macronutrients Protein All students, except REGULAR Female canteen users, approached one-third of the RDI for this age group for protein (44-55g F and 42-60g M) as shown in Figure 2. REGULAR Males exceeded one-third of the RDI at 198g (38%) 60 r-------------~----------------------. 100% 80% 40 60% 40% 20 20% 0 0% Starcap Regular Regular Starcap Females Males llllllg 14.2 9.4 15.5 19.4 -+-% ofRDI 29% 19% 30% 38% Figure 2. Mean canteen-derived protein intake and % of RDI 58 The foods that made a
substantial contribution to protein were generally high in fat, such as beef pies ·and sausage rolls. For example, for STARCAP Females and Males, pies and sausage rolls together contributed 5.2g (367%) and 41g (27.3%) respectively to protein intake, while for REGULAR Males, these two foods contributed 8.01g (404%) to this nutrient Other good sources of protein, such as cereals, pulses, nuts and vegetables were consumed in small amounts by few students in this study, eg bread for sandwiches and rolls or salad in a hamburger. Carbohydrates Figure 3 shows that all students came close to meeting the Target recommendation that 55% of total energy be derived from carbohydrates (Wahlqvist & Kouris-Blazos, 1997, p. 510) REGULAR Females exceeded this recommendation, obtaining 62% of total energy from canteen-derived carbohydrate consumption. 400.0 - - - - - - - - - - - - - - - - - - - - - - - 100% 300.0 80% 60% 200.0 40% 100.0 0.0 20% Starcap Regular Starcap 0% Males
Females --+--- % of Target Regular 58.0 65.3 61.4 90.6 49% 62% 48% 53% Figure 3. Mean canteen-derived carbohydrate intake and% of Target set for carbohydrate as a proportion of total energy 59 For STARCAP Female and Male students, ice confection products and flavoured milk beverages combined contributed 24.1g (420%) and 232g (377%) respectively to carbohydrate intake, while for REGULAR Female and Male students, soft drinks accounted for 20.4g (317%) and 212g (240%) respectively to the intake of this nutrient. Total Fat Figure 4 shows that all sub-groups exceeded the upper limit of 30% set for the contribution of fat to total energy (Wahlqvist & Kouris-Blazos, 1997, p. 510), except REGULAR Female students, who obtained 27% of total energy from canteen-derived fat consumption. 100.--------------------------------------100% 80 80% 60 60% 40 40% 20 20% 0 0% Females Males lllllllg 20.9 13.6 22.9 25.9 -+- % of Target 37% 27% 37% 33% Figure 4. Mean
canteen-derived total fat intake and% of Target set for total fat as a proportion of total energy 60 For STARCAP Female and Male students, sausage rolls were the single food item that contributed most to total fat intake at 8.9g (414%) and 108g (473%) respectively. Similarly, for REGULAR Male students, sausage rolls accounted for 7.9g (295%) of total fat intake while for REGULAR Female students, commercially prepared cakes were the single food item that contributed most to this nutrient at 2.8g (209%) It is recommended that not more than 10% of total energy be derived from saturated fat (Wahlqvist & Kouris-Blazos, 1997), however for STARCAP Female and Male students, the percentage of saturated fat to total energy intake was twice that recommended at 21.2% and 208% respectively REGULAR students proportion of total energy derived from saturated fat was lower at 13.7% for Females and 140% for Males As expected, sausage rolls were the single food item that contributed most to
saturated fat for all sub-groups except REGULAR Female canteens, for whom the main contributor was commercially prepared cakes. For all sub-groups, the proportion of total energy from polyunsaturated and monounsaturated fats were below the lower limits recommended. The current recommendation is that polyunsaturated fat should contribute " . about 7% of energy (but not exceed 10%) [while] . monounsaturated fat should be increased to 15% to 20% of energy" (Wahlqvist & Kouris-Blazos, 1997, p. 51 0). Figure 5 illustrates the percentages of monounsaturated, polyunsaturated and saturated fats to total energy for each sub-group. 61 Starcap Females 13.3% Regular Females 9.4% 21.2% 13.7% Iii Polyunsaturated Fat Starcap Males 13.3% Regular Males ·. 121% 20.8% 0 Saturated Fat 14.9% Figure 5. Percentage of canteen-derived monounsaturated, polyunsaturated and saturated fat to total energy intake Dietary Fibre STARCAP Female and Male students fibre intakes were
extremely low as illustrated in Figure 6, with sausage rolls contributing almost half of fibre intake at 0.83g (469%) and lOlg (486%) respectively REGULAR students fibre intakes were also low and potato wedges were the single food item that contributed most to fibre intake, accounting for 0.47g (257%) of fibre intake for Females and 2.14g (452%) for Males The low fibre intakes were due to minimal consumption of grain products, fruits, vegetables and pulses, which are all good food sources of dietary fibre. 62 35.------~--~---~-------~~-~---~"~~-~------~--~100% 30 25 20 15 10 5 0 80% 60% 40% 20% 0% Females 1.7 --+--% ofRDI 6% Males 1.8 6% 2.1 4.4 7% 15% Figure 6. Mean canteen-derived fibre intake and % of recommended intake Uncertainty surrounds recommendations for the intake of dietary fibre, with some disparity between international health authorities. In Australia, broad guidelines are aimed "at increasing the consumption of starchy foods and wholegrain
cereal products" (Jones, 1997c, p. 220) For the purpose of this study, if the recommendation for adolescent fibre intake were set at 20g, individual nutrient analyses revealed that only three students obtained one-third of this amount ·from canteen-derived foods. The three students were all REGULAR Males and their intakes, respectively, were: two buckets of potato wedges and one and-a-half vegemite sandwiches; one bucket of potato wedges and one pineapple juice; one croissant, one piece of pizza, one chicken and com roll, 55g jelly-based sweets, one sausage roll and one 600mllemonade. Apart from supplying over one-third of 20g of dietary fibre, these three intakes were similar in that their mean weight (743g ± 330g) was higher than the combined sample mean weight (488g ± 346g), reflecting that thesy three students did consume more than most students. The fat and sugar 63 components of these three males canteen food selections, however, can be seen to be somewhat less
than ideal. Vitamins Figure 7 shows that all sub-groups fell short of meeting one-third of the 200ug RDI for folate from canteen food consumption and again, REGULAR Males came the closest to meeting one-third of this nutrient at 48.2ug (240%) For STARCAP Female and Male students, ice confection products and flavoured milk beverages combined contributed 10.79ug (431 %) and 943ug (337%) respectively to folate intake. Potato wedges were the single food item that contributed most to folate intake for REGULAR Female and Male students at 2.07ug (106%) and 942ug (195%) respectively 200.-·-------------------------------------100% 100 00% 100 60% 40% oo m 0 0% Females IBBug ~%ofRDI 25.6 13% Males 19.5 10% 27.9 14% 48.2 24% Figure .7 Mean canteen-derived folate intake and %of RDI 64 Minerals Calcium There was a statistically significant difference between STARCAP and REGULAR Female students mean calcium intakes and Figure 8 shows that STARCAP students came closer
to obtaining one-third of the RDI for calcium, (1 OOOmg F and 1200mg M), while REGULAR students obtained approximately 10% of the RDI for this nutrient from canteen-derived foods. For STARCAP Females and Males, flavoured milk beverages and ice confection products were the main contributors to this nutrient, giving 195.75mg (765%) and 19874mg (772%) respectively to total calcium intake. Similarly, for REGULAR Females and Males, these foods were also main contributors to calcium intake, accounting for 41.02mg (335%) and 460mg (328%) respectively of calcium intake .-------------------------------------- 100% 80% 60% 40% 20% Regular Regular Starcap 0% Males Females lill!llilllllmg 274.7 118.6 257.5 136.9 ---+--- % of RDI 27% 12% 21% 11% Figure 8. Mean canteen-derived calcium intake and % of RDI 65 Mean intakes for iron were similar for all sub-groups in that they were extremely low. REGULAR Male students intake was double that of all other sub-groups as illustrated
in Figure 9, but despite this, no sub-group approached one-third of the 10-13mg RDI for iron from canteen food consumption. ~--------------------------------------~100% 80% 60% 40% Regular Starcap Females Regular 20% 0% Males lllllllilmg 1.1 1.0 -+-% ofRDI 9% 9% 1.1 10% 2.0 17% Figure 9. Mean canteen-derived iron intake and % of RDI Pies and sausage rolls combined were a main source of iron for all sub-groups except REGULAR Female students. These foods contributed 053mg (469%) and 0.46mg (407%) to total iron intake for Female and Male STARCAP students respectively and 0.71mg (343%) for REGULAR Male students For REGULAR Female students, Egg and Bacon Muffins were the single food item that contributed most to the intake of this nutrient, accounting for 0.15mg (15.3%) oftotal iron intake 66 Absorption rates of iron differ, depending, in part, on whether the iron is haem or non-haem, with estimations that approximately 25.5% of haem and 140% of non-haem iron is
absorbed (Cobiac & Baghurst, 1993, p. S4) Of the canteenderived iron consumed by the students in this study, approximately half was haem iron. Individual nutrient analyses revealed that only seven students in this study obtained one-third of the RDI for iron from canteen-derived foods. The seven students comprised three STARCAP students (two Females and one Male) and four REGULAR students (one Female and three Males). These intakes included food items such as: one egg and bacon burger and one hamburger; one pie and one sausage roll; one chicken and mayonnaise roll and one sausage roll. The seven intakes shared two similarities. Firstly, they were similar in that their mean weight (827g ± 313g) was relatively higher than the combined sample mean weight (488g ± 346g), reflecting a larger volume of foods consumed. Secondly, while these intakes provided one-third of the RDI for iron, they were also high in saturated fat which consequently contributed approximately 17.9% to total
energy intake (almost twice that recommended) 67 Summary There were marked differences between what was offered for sale at STARCAP and REGULAR canteens, the main difference being that REGULAR canteens offered more items for sale than STARCAP canteens. STARCAP canteens restricted the sale of ice confection products to lunchtimes, restricted the sale of a small range of cakes to recess and did not include soft drinks on their menus. One REGULAR canteen (S 3) also restricted the sale of ice confection products to lunchtime only. The other REGULAR canteen (S 4) placed no restriction on the sale of these items and soft drinks were offered for sale at this canteen. Proportionately more REGULAR students (65%) recalled consuming foods from the canteen than STARCAP students (53%). As expected, there was a great deal of variability within each sub-groups mean intake for the nutrients analysed in this study. The variability was due to differences between what each canteen offered for
sale and subsequently the foods students had to select from and, typically, individual differences between what each student chose to consume from the canteen. For the nutrients analysed in this study, all sub-groups met the recommendation that 55% of total energy be derived from carbohydrates. However, the recommendation that complex carbohydrate supply 45% of total energy and refined carbohydrate supply the remaining 10% of total energy was not met. (Wahlqvist & Kouris-Blazos, 1997, p. 510) For the remainder of nutrients, all 68 sub-groups fell short of meeting one-third of current dietary recommendations, with the exception of REGULAR Male students, who exceeded one-third of the RDI for protein. All sub-groups, except REGULAR Females, exceeded the 30% contribution of fat to total energy. More specifically, intakes of saturated fat greatly surpassed current recommendations, particularly for STARCAP students. Overall, the results revealed that REGULAR Males came the
closest to obtaining one-third of nutrient intake from canteen-derived foods. 69 CHAPTERS Discussion Introduction In order to discuss each research question, this chapter is divided into four sections, beginning with the canteen food consumption patterns exhibited by the students in this study, followed by an evaluation of canteen usage. Each sub-groups mean nutrient intake is discussed with regard to the National Health and Medical Research Councils (1991) Recommended Dietary Intakes (RDis) and the Goals and Targets for Australias Health in the Year 2000 and Beyond (1993). Canteen Food Consumption Patterns Discussion regarding the differences between consumption patterns is provided under each food categorys sub-heading, as well as possible short and longterm nutritional implications resulting from the food choices made by the students in this study. In addition, strategies employed by each canteen to provide a foodservice in accordance with current dietary recommendations
are discussed. 70 Although there were distinct differences between what each canteen offered for sale, Figure 10 shows that consumption patterns were not that dissimilar, except for the Ice Confection/Dairy category and the Confectionery category. Sandwiches/Rolls Hot Snacks Hot Meals Salads/Fresh Fruit •starcap Iii Regular Cakes/Pastries Ice Confection/Dairy Confectionery Beverages Daily Specials 0% 10% 20% 30% 40% 50% 60% 70% 80% Percentage of Items Purchased Figure 10. Percentage of canteen purchases from each food category Sandwiches/Rolls One STARCAP canteen offered Hyfibre white bread as an option in the preparation of sandwiches which is one way to try to increase fibre in the students diets. This is encouraging with regard to the possible protective effects of dietary fibre against diseases of affluence (Jones, 1997c, p. 215) One REGULAR canteen used no spread (margarine or butter) in the preparation of sandwiches or rolls. In tenns of reducing the
consumption of visible fat and 71 consequently the contribution of fat as a proportion of total energy, again this is encouragmg. Although these canteens employed strategies to provide a foodservice in accordance with current dietary recommendations m the Sandwiches/Rolls category, no STARCAP students recalled consuming a sandwich and for the REGULAR canteen that used no spread, only one student recalled consuming a sandwich. It is difficult to determine why sandwiches and rolls were not popular choices with the students in the study due to the numerous factors that influence food choice behaviour. It could be that on the day of data collection, the weather was cooler and so students preferences were directed toward hot foods. Sandwiches and rolls should be promoted by school canteens, particularly those with salad-based fillings, in order to increase both fibre and vegetable intake, which were alarmingly low for the students in this study. If the CSIRO 12345+ Food &
Nutrition Plan (Baghurst, Hertzler, Record & Spurr, 1992) recommendation that 3 serves of fruits and 4 serves of vegetables be consumed daily is to be achieved by the students in this study, school canteens need to offer and promote fresh fruits and vegetables and thus make a more positive impact on the short and long-term health of students. 72 Hot Savouries Despite the marked difference between the number of items offered for sale in the Hot Savouries category between STARCAP (n=ll) and REGULAR (n=45) canteens, this category was popular with all sub-groups with 47% of STARCAP students and 61% of REGULAR students recalling consumption of one or more hot savoury item. Although there was a range of items offered for sale in this category, students limited their choice to relatively few items with pies, sausage rolls, potato wedges and pizza being main choices. While foods consumed from this category accounted for approximately half of total fibre and iron intake, they also
contributed over half of saturated fat intake for all sub-groups except REGULAR Females. The popularity of this category is of concern because over-consumption of high-fat foods could have detrimental effects on both the short and long-term health of the students in this study; namely overweight, obesity and increased risk of cardiovascular disease (Tilston, Neale, Gregson & Douglas, 1992; National Health Priority Areas, 1996; Church, 1997; Douglas, 1999; Booth et al; 2001). For example, sausage rolls were a frequently occurring food choice for all sub-groups and Figure 11 shows the contribution sausage rolls made to total saturated fat intake. 73 10 ~·---------------·---~-------------~100% 8 80% 6 60% 4 40% 2 20% 0 0% Males Females --+- % of total saturated fat 4.5 0.70 5.5 4.0 40% 11% 48% 36% intake Figure 11. Contribution of consumption of sausage rolls to saturated fat intake Many studies have demonstrated that adolescents prefer high-fat foods
like pies, sausage rolls and pizza (Seaman, Bower & Fleming, 1997; Douglas, 1998; Brady, Lindquist, Herd & Goran, 2000). However, current recommendations suggest that these items should form a small portion of a nutritionally balanced diet and be consumed only occasionally. In accordance with this recommendation and because of the role that many believe school canteens should play in reinforcing nutrition lessons taught in classrooms (McBride, 1992; Magarey & Boulton, 1995; Church, 1997; Douglas, 1998; Cholin, 1999; Huon, Wardle & Szabo, 1999; Marshall et al; 2000), one way to reduce the intake of saturated fat for the students in this study could be to limit the sale of foods like pies, sausage rolls and pizza to special occasions such as the last day of term or to special events on the school calendar. The concern presently is that regular inclusion of high fat foods on canteen menus may be sending a message that frequent consumption of these foods is acceptable or
even normal. 74 As previously stated, the food items included in the Hot Savouries category were generally high in fat, so that while there was a wide choice available, particularly for REGULAR students, the choice was between one high-fat item and another. In terms of reducing fat intake, apart from restricting the sale of high fat savoury items to special occasions, canteens could replace less healthy for healthier choices such as bread-based products (toasted focaccia rolls and sandwiches), burritos or enchiladas with bean fillings, com on the cob or pizza made with reduced-fat cheese and increased vegetable toppings (Health in Schools, 1997, p. 17) Hot Meals All canteens included a range of items in the Hot Meals category, with REGULAR canteens again offering more choice (n=14) than STARCAP canteens (n=4). A number of items in this category were more nutritious with regard to increasing complex carbohydrate, fibre, vitamin and mineral intake compared to those in the Hot
Savouries category and examples include hot soups, pastabased dishes, baked and stuffed potatoes. However, only two REGULAR students recalled consuming foods from this category (one 250g serve of spaghetti bolognaise and one-half plain baked potato), while no STARCAP students recalled consuming any items from this category. To explain why this category was not popular is difficult within the constraints ofthis study. It could be that Hot Meal items are not as convenient to 75 consume as those in the Hot Savouries category. Meals like baked potatoes and pasta usually require utensils (knife and fork or spoon) and are difficult to consume without being seated. The amount of table seating available in most Perth metropolitan high schools is minimal or non-existent and during recess and lunchtimes many students walk, participate in sporting activities (such as kicking a football) and generally stand in groups with peers while eating. The lack of amenities at school sites for
students to sit and eat, coupled with the mobile nature of playground activities, could be factors that make consuming meals unappealing compared to the convenience of eating a pie, sausage roll or other savoury snack on the run. In fact, in studies that have focused on factors that influence the food choices of adolescents, convenience was a strong determinant of food choice (Huon, Wardle & Szabo, 1999; Neumark-Sztainer, Story, Perry & Casey, 1999). Salads/Fresh Fruits Despite comparable Salads/Fresh Fruit items being offered for sale at each canteen, no students in this study recalled consuming any foods from this category. The low fruit and vegetable consumption recalled by the students in this study mirrors analyses of larger Australian studies with similar-aged adolescents (National Dietary Survey of Schoolchildren aged 10-15 Years, 1985; The Adelaide Nutrition Study; 1995) where consumption of fruits and vegetables was markedly lower than recommended. 76 The low
fruit and vegetable consumption demonstrated by the students in this study is of major concern because "fruit and vegetable consumption during childhood is strongly predictive of consumption in adulthood" (Huon & Wardle, 1999, p. 157) The importance of including fresh fruits and vegetables in the diet cannot be over-emphasised in light of current investigations about the possible protective features of phytochemical components. When questioned about why it is difficult for adolescents to increase consumption of fruit and vegetables, Neumark-Sztainer, Story, Perry and Caseys (1999) focus-group investigation with 12-14 year-old students listed the following reasons to explain why they are not popular food choices for this age group: taste (junk food tastes better), promotion (fruit and vegetables are not as visible as other foods such as meal deals), convenience (fruits need to be peeled) and visual appearance (fruit looks bruised). In order to promote the consumption of
fruit, the canteens in this study could adopt the suggestion offered by participants in the focus-group investigation who stated that adolescents could be encouraged to ponsume more fruit at school by making it more accessible and convenient. For example, fruit could be peeled, cut and prepacked for serving. Whilst this preparation may reduce the dietary fibre content (and, possibly, the vitamin content), it is a better alternative to no school-time fruit intake. 77 Cakes/Pastries There were distinct differences between canteens as to what was offered for sale in the Cakes/Pastries category. REGULAR canteens again offered an extensive range of commercially prepared cake and pastry items which varied from day to day, while STARCAP canteens offered a limited range. STARCAP canteens placed restrictions on the sale of cake and pastry items to recess, while no restrictions were in place for REGULAR canteens. Despite restricted selling times and less cake and pastry choices offered
by STARCAP canteens, more STARCAP students (17%) recalled consuming items from this category than REGULAR students (12%). The popularity of cakes and pastries, particularly with STARCAP students, could be due to preferences for sweet-tasting foods, which Nestle et al. state are both "innate and universal" (1998, p. S53) Douglass (1998) investigation into 12 year-old childrens food preferences supports this partiality toward sweet-flavoured cakes, with 66% of students indicating a preference for doughnuts compared to apples (p. 16) The cake and pastry items consumed by students in this study contributed approximately 10% to the intake of most nutrients, except for REGULAR females who derived 22.8% of saturated fat from this category The reason for this was because of the nutritional difference between the types of cakes and pastries offered for sale: STARCAP canteens offered lower-fat items such as muffins and iCed buns, whereas REGULAR canteens offered higher-fat items,
such as caramel slice, croissants and Danish pastries. 78 Ice ·Confections/Dairy The Ice Confections/Dairy category was the category where the most difference was exhibited between the food choices patterns of STARCAP and REGULAR students. Upon consultation with REGULAR canteen managers, it was determined that the two REGULAR canteens offered a varied range of items that changed frequently, whereas STARCAP canteens offered a limited choice of items for sale. The two STARCAP canteens and one REGULAR canteen placed a restriction on the sale of ice confection products to lunchtimes, while the other REGULAR canteen sold these items at all times. Like the Cakes/Pastries category, despite restricted selling times and less choice offered by STARCAP canteens, more STARCAP students (65%) recalled consuming items from this category than REGULAR students (16%). While the innate preference for sweet-flavourec,l foods offers an explanation as to why the students in this study chose to
consume foods like ice confection products, it does not explain why four times as many STARCAP students consumed items from this category compared to REGULAR students. Another explanation could be that REGULAR students had a more extensive range of alternative sweetflavoured foods to select from, such as confectionery items, which displaced the consumption of ice confection products. 79 For STARCAP Females, the consumption of ice confection items contributed approximately 20% of carbohydrate, folate and calcium intake. However, due to the high fat content of ice cream products, these items also contributed approximately 20% to saturated fat intake for this sub-group. The Ice Confections/Dairy category contains food items which are important sources of calcium, such as yoghurts and (to a lesser degree) ice cream. Y oghurts are a lower-fat source of calcium than ice cream products, however no students in this study recalled purchasing yoghurt from the canteen. Frozen yoghurt was
also offered for sale at one STARCAP canteen and again, no students in this study recalled consuming this item. Given the popularity of ice confection products and the nutritional benefits of yoghurt, it could be advantageous for canteens to make frozen yoghurt the only ice confection item available for sale. According to Neumark-Sztainer, Story, Perry & Caseys focus-group investigation, adolescents stated that "the way to get them to eat better is to make he.althful foods the only option because they will pick the high-fat or high-sugar option if they are given an option" (1999, p. 932). Confectionery Again REGULAR canteens offered a far more extensive range of items in the Confectionery category than STARCAP canteens. This category was very 80 popular with REGULAR students: 42% recalled consuming confectionery items from this category compared to 6% of STARCAP students. As a result, REGULAR students sugar intake was markedly higher than STARCAP
students. Like the Cakes/Pastries category, there were differences between the types of confectionery items offered for sale. REGULAR canteens included chocolate novelty bars on their menus which, apart from contributing to sugar and energy intake, also contributed to fat intake. One STARCAP canteen offered no confectionery items for sale and the other STARCAP canteen included three confectionery items on its menu. These three items were sugarbased jelly sweets which, although high in refined sugar, contain no fat The concern with confectionery is two-fold: it can displace more nutrient-dense foods in the diet and there is a direct link between foods with high-sugar content and the incidence of dental caries (Jones, 1997a, p. 203) The consumption of confectionery items from the canteen contributed minimal amounts of nutrients for the students in this study, except REGULAR Females, for which items in this category contributed approximately 10% of carbohydrate and calcium intake.
This is of concern because there are many more nutrient-dense food sources that can supply carbohydrate and calcium, which were not consumed by this sub-group so that items like confectionery supplied these nutrients, virtually by default. Q•1 01. Beverages There were two main differences between what was offered for sale in the Beverages category - one REGULAR canteen included hot drinks on its menu and the other REGULAR canteen offered soft drinks for sale. Apart from these differences, beverage items offered for sale were similar for all canteens. Beverages were frequent consumption choices for all students in this study: 74% of STARCAP students and 68% of REGULAR students recalled consuming one or more items from this category. While sugar is not a nutrient that has been included for analysis in this study, it is interesting to note that for those REGULAR students who had access to soft drinks, the consumption of these items accounted for 47% of total sugar intake. Like
confectionery, the concern is two-fold: the displacement of other more nutrient-dense foods and the increased incidence of dental caries. For STARCAP Female and Male students, items consumed in the Beverages category contributed 59.6% and 691% to calcium intake whereas for REGULAR students, consumption of beverage items contributed only 28.9% to the intake of this nutrient for Females and 38.1% for Males The difference in calcium intakes can be attributed to the difference in amounts of flavoured milk beverages consumed by STARCAP students (n=ll) compared to REGULAR students (n=3). 82 While the contribution that flavoured milk beverages made to STARCAP Female and Male calcium intake is encouraging, these sub-groups also obtained 20.3% and 33.0% respectively of saturated fat from flavoured milk beverages compared to REGULAR Female and Male students, who obtained only 4.6% and 8.8% respectively from the consumption of these items Given the difference in the number of flavoured milk
beverages consumed between STARCAP and REGULAR students, the increased amount of saturated fat derived from these items is to be expected. Seventy-three percent of flavoured milk beverages consumed by STARCAP students were whole milk varieties (Supershakes) and only 27% were reducedfat (Masters or Brownes Choc Milk or Ice Coffee). An effective way to reduce the amount of saturated fat consumed by students, while maintaining calcium intake, would be to offer only reduced-fat flavoured milk beverages for sale which would be an acceptable strategy for this adolescent age group. Daily Specials All canteens included Daily Specials on their menus. One STARCAP canteen (S 1) offered a range of sandwiches, rolls and salads for each weekday. The remainder of canteens, however, promoted mostly high-fat foods in this category, such as pies, pasties and sausage rolls. Daily Specials are often marketed as nieal deals which frequently include a beverage. 83 The promotion of high fat foods
at reduced retail pnces is of paramount concern for a number. of reasons First and foremost, as the visibility of these food items is increased at the canteen, the visibility of more healthful foods is subsequently decreased. Consequently, when faced with a plethora of less healthy items at the canteen service counter, the task of choosing healthy foods is made more difficult for students. Reducing the price of high fat foods and including a beverage (often a soft drink in the case of one REGULAR canteen) also adds to the difficulty for students to make better food choices at the canteen, due to the seemingly increased expense of eating healthier foods compared to meal deals. Instead of promoting less-healthful foods, canteens should promote food items that encourage healthy food choices and preferences. Marketing strategies that reinforce what is taught in classrooms would be beneficial for both dietary intervention and education. For example, canteens could implement weekly
promotions based on each of the nutrients that are typically borderline for adolescents, such as fibre, folate, qalcium and iron. Alternatively, canteens could focus marketing strategies around health-related messages such as eat less fat and eat more fruit and vegetables. By changing the environment so that appropriate foods are available, canteens could play an effective role in improving "dietary habits in order to produce a healthful diet and to prevent diet-related disease" (Brady, Lindquist, Herd, & Goran, 2000, p. 366) 84 Canteen Usage The school canteen was a very popular food source for the students in this study and accounted for 75% of all food consumed during school-time; 53% of STARCAP students and 64% of REGULAR students recalled consuming one or more food items from the school canteen. This trend is similar to other analyses (Tilston, Neale, Gregson & Douglas, 1992; Ruxton, Kirk, Belton & Holmes, 1993) where over 50% of participating
students also utilised the canteen during school-time. Of concern are the 3% of STARCAP students and 5% of REGULAR students who recalled consuming no food at all during schooltime, particularly with regard to possible detrimental effects on physical and cognitive development. Given the frequency with which the students in this study used the canteen, school canteens have the potential to provide students with a substantial proportion of daily nutrients. In addition, canteens enjoy unique placement as the sole foodservice provider within education sites. They therefore have an obligation to be a source of both dietary intervention and education (McBride, 1992; Magarey & Boulton, 1995; Church, 1997; Douglas, 1998; Cholin, 1999; Huon, Wardle & Szabo, 1999; Marshall et al; 2000). This is particularly pertinent with regard to mounting evidence regarding the importance of developing sound lifelong eating behaviours during adolescence and therefore the prevention of diet related
diseases (Douglas, 1998; Cholin, 1999; Huon, Wardle & Szabo, 1999; Neumark-Sztainer, Story, Perry & Casey 1999; Brady, 2000; Livingstone & Robson, 2000). 85 Nutrient Intakes- How Do They Measure Up to the RDis and National Targets? Mean nutrient intakes derived from canteen food consumption are discussed in this section. A summary is provided for each nutrients function in relation to adolescent growth and development. The main food items that contributed to each nutrient are identified and suggestions are offered as to how canteens can offer a foodservice which is consistent with current dietary recommendations. Macronutrients Protein Food sources of protein differ in their concentration and can be categorised into two groups: animal-derived and plant-derived. Animal-derived protein is considered high quality because its indispensable amino acid content closely matches human requirements and is more readily digested than plant-derived protein, which is
considered low quality. Adolescents have slightly higher protein requirements than adults because the turnover of this nutrient is increased during this stage in the lifecycle to accommodate rapid growth spurts and the synthesis of new tissues (Read, 1997, p. 190) It is important to note that while the RDI for protein is intended to cover the needs of 97.5% of the Australian population, if the dietary protein source is 86 predominately of low quality, further allowance may have to be made (NHMRC, 1991). All sub-groups in this study approached one-third of the RDI for protein. REGULAR Males exceeded one-third of the RDI, obtaining 38% of their protein requirement from canteen-derived foods. Female students protein intakes were lower than the Males, which is consistent with Brady, Lindquist, Herd & Gorans observation that females generally have lower protein intakes than males (2000, p. 361) The canteen foods that contributed to protein were mostly from animal-derived
foods. The main contributors were sausage rolls, pies, flavoured milk beverages and pizza and while SERVE does not distinguish between animal and plant sources of protein, in terms of assessing amino acid quality it would be reasonable to say that the students in this study obtained proportionately more high quality protein than low quality protein. While protein intakes approached one-third of the RDI, the main foods that contributed to the intake of this nutrient were also high in fat. Consequently, to reduce fat intake and maintain protein intake, canteens could offer and promote food items that supply protein in the diet and are low in fat. Sources of high quality protein include lean beef, lean chicken, fish, eggs, milk and cheese. Food item suggestions for canteens include: lean steak burgers and sandwiches served on a variety of breads such as Turkish, French, mixed grain, focaccia or bagels; smoothies and icy poles made with fresh fmits and yoghurt; reduced-fat 87 milk
beverages; and pizza with pita or Lebanese bread bases and low-fat toppings. Sources of plant protein include cereal products, pulses, rice, nuts and vegetables. Food items that would be suitable for canteen menus include: salad-based sandwiches and rolls served on assorted breads; burritos, tacos and nachos with legume and vegetable-based fillings; and trail mix packages of dried fruits and nuts. Carbohydrates Carbohydrate is the main source of dietary energy for the body and food sources are wide and varied. For the purpose of this study, food sources of carbohydrate are referred to as unrefined (complex), refined (sugar) and, associated with carbohydrate, dietary fibre. This section focuses on carbohydrates that supply energy, while dietary fibre is discussed separately. The Target 2000 recommendation is that 55% of total energy be derived from carbohydrate, with unrefined carbohydrates contributing 45% and refined carbohydrates contributing less than 10% of total energy intake
(Wahlqvist & Kouris-Blazos, 1997, p. 510) All sub-groups in this study came close to obtaining 55% of their total energy from the carbohydrate content of canteen-derived foods, with REGULAR Females exceeding this recommendation at 62%. These proportions may appear to be encouraging, however, carbohydrate intake was mostly in the 88 form of refined sugars with few students in this study consuming any complex carbohydrate food sources. The main food items that contributed to carbohydrate intake for STARCAP students were ice confection products and flavoured milk beverages, while for REGULAR students, soft drinks were the single food item that contributed most to carbohydrate intake. This is of some concern because not only are these foods relatively nutrient-deficient, but they can also be the vehicle for the consumption of extra fat in the diet. Furthermore, refined carbohydrate foods can displace more nutrient-dense foods and because they "consist of simple, easily
digestible sugars [they are] great precipitators of dental caries" (Tilston, Neale, Gregson & Douglas, 1992, p. 104) Of central importance is the promotion of complex carbohydrate food sources for the students in this study. Not only are complex carbohydrate foods usually low in fat, but they may also help in the prevention of a number of healthrelated diseases such as those associated with overweight and obesity. This is due, in part, to the high satiety (feeling of fullness) value associated with the consumption of complex carbohydrate, as well as the regulatory processes involved in the ingestion, digestion, absorption and transport of complex carbohydrates (Read & Kouris-Blazos, 1997). Good food sources of complex carbohydrates include cereal products, root vegetables and pulses. In order to increase the consumption of these types of foods, canteens could encourage the sale of foods that already feature on their 89 menus, but which were not popular food choices
with the students in this study, such as pasta-based dishes, baked potatoes, sandwiches and rolls. In addition, further suggestions include: fruit loaves, muffins and cakes made from wholemeal flour or with added bran; oat-based or wheatmeal-based cookies; and hot soups containing pumpkin, sweet-potato and potato. Total Fat While fat is an essential nutrient, the functions of which include the supply of energy, essential fatty acids and as a vehicle for fat soluble vitamins (Jones, 1997b, p. 213), there are numerous health-related concerns surrounding excess consumption of dietary fat. Many studies have suggested "a positive association between high fat consumption and frequency of obesity" (Anderson, 1996, p. 14), with overweight children and adolescents at increased risk of becoming overweight as adults and "experiencing the chronic health problems associated with adult obesity" (Booth, Wake, Armstrong, Chey, Hesketh & Mathur, 2001, p. 162) In addition,
it has been estimated that approximately one-third of cancers that occur in Western countries can be attributed to diet (Archer, 1996; Law, 2000). The consumption of dietary fat has been tentatively associated as a contributing factor to higher incidences of some cancers, including colorectal and breast cancer (Archei, 1996; NHPA, 1997; Law, 2000). 90 All sub-groups in this study exceeded the 30% upper limit set for the contribution of fat to total energy, with sausage rolls as the main contributor to this nutrient, except for REGULAR Female students, for whom commercial cakes contributed the most to this nutrient. The high fat intake which resulted from canteen-derived food consumption is similar to other studies (Tilston et al, 1992; Magarey & Bolton, 1995; Church, 1997; Riley & Dean, 1997) in that the proportion of dietary fat to total energy exceeded current recommendations. As well, the saturated fat contributed more than 10% to total fat, a proportion which is
considered as the supper limit for saturated fat as a contributor to total energy. For STARCAP students, the contribution of saturated fat to total energy was over 20%; twice that of the <1 0% recommended. Similarly, for REGULAR students the contribution saturated fat made to total energy was also too high at approximately 15%. For saturated fat specifically, one main concern is the effect it has of increasing low-density lipoprotein (LDL) cholesterol and therefore the possible risk of cardiovascular diseases (Ball, 1997b, p. 389) Current recommendations also advise that monounsaturated fat should contribute 15 to 20% of total energy and polyunsaturated fat should contribute 7 to 10% of total energy (Wahlqvist & Kouris-Blazos, 1997, p. 510) For all sub-groups in this study, the proportionate intake of both polyunsaturated and monounsaturated fats were below the lower limits recommended. This is of concern due to the association between polyunsaturated fat and the lowering
effect it has on LDLs and consequently, the possible prevention of 91 cardiovascular diseases (Ball, 1997a, p. 375) Likewise, the positive health effects of monounsaturated fats in the diet are well established (Saxelby, 1999). As stated earlier, one way to reduce the amount of fat that canteen-derived food supplied would be to remove items that are high in fat, such as pies and sausage rolls from canteen menus or to offer them for sale only on special occasions. By changing what is available for sale to more healthful food choices, several studies have demonstrated a significant decrease in the amount of fat consumed (Huon, Wardle & Szabo, 1999; Johnson, 2000). Dietary Fibre All sub-groups mean dietary fibre intakes were extremely low in this study- a result that mirrors other studies where fibre intakes of children and adolescents have been compared to dietary recommendations (Tilston, Neale, Gregson & Douglas; 1992, Magarey & Boultol)., 1995; Huon & Wardle,
1999; Johnson, 2000). Students low fibre intakes can be attributed to the low canteen-derived consumption of foods like fruits, vegetables, grains and legumes, which are all good sources of fibre. It has been proposed that diseases of affluence are related to dietary fibre deficiencies and research evidence is accumulating that supports the notion that "fibre is one of several interacting features of diets that may be protective against disease" (Jones, 1997c, p. 216) More specifically, high dietary fibre 92 intake has been associated with "lower incidence of certain chronic disorders, such as cardiovascular diseases and large bowel cancer" (Gallaher & Schneeman, 1996, p. 87) In light of this, the low mean fibre intake of students in this study is likely to lead to increases in the incidence of these diseases in Australia. Of even more concern are the types of foods which contributed to fibre intake, with sausage rolls and potato wedges being main
contributors. Processed foods such as sausage rolls are very high in fat, contain too little fibre and displace other more nutrient-dense foods in the diet. It is a direct reflection on the nutrient quality of canteen foods perse that high fat and processed food items became the major contributors to students school-time dietary fibre intakes. Encouragingly, one STARCAP canteen attempted to promote dietary fibre intake by offering Hyfibre white bread in the preparation of sandwiches. While no STARCAP students in this study recalled consuming a sandwich from the canteen, this type of initiative is to. be commended Offering Hyfibre white bread as the only option and increasing the promotion of food items containing this product would be one way to increase students school-time fibre intake. 93 Vitamins The functions of folate are numerous and include assisting in the synthesis of DNA and cell membranes and in the metabolism of protein and fat. Folate also plays a role in
protecting against neural tube birth defects, heart disease and nerve damage (Wahlqvist, 1997, p. 237) During adolescence- a time in the life cycle characterised by rapid growth spurts and development - folate is essential for cell division and protein synthesis; processes that are "critical to growing tissues and the replacement of red blood cells" (Ball, 1997b, p. 435) All sub-groups mean folate intakes were low in this study, except for REGULAR Males who obtained 48.3ug (24%) of the 200ug RDI for folate from canteen food consumption. The resulting low folate intakes by the students in this study were due to the kinds of foods consumed. Good sources of folate include" . leafy vegetables, citrus fruits and nuts" (Wahlqvist, 1997, p 236); foods that very few students in this study consumed and only in small amounts. Apart from the good food sources already mentioned, folate occurs widely in a variety of foods and one way to increase the school-time intake of this
nutrient would be to promote diets which feature a variety of fresh foods. Encouraging adolescents to consume a variety of foods is particularly pertinent in light of the relatively narrow food choice patterns exhibited by the students in this study. In fact, food variety has been cited as "crucial for optimal health 94 and a nutritionally adequate diet, [the benefits of which include] some protection against macro vascular disease and possibly even cancer" (Walhqvist & Kouris-Blazos, 1997, p. 521) Promoting a variety of foods and limiting the sale of low-nutrient foods at school canteens may be a way to increase students intake of folate. For example, a 165g Mrs Mac Sausage Roll and 300ml Masters Reduced-Fat Chocolate Milk provides 27ug of folate, whereas a chicken and salad sandwich, a 200ml tub of low fat yoghurt and 300ml orange drink provides 69ug, or approximately one-third of the RDI for folate. Minerals Calcium Calcium plays an integral role in
metabolism and cellular processes and is essential for skeletal development. During adolescence, approximately 40% of peak bone mass is accumulated and according to Weaver: Bone mineral density is a predictor of bone strength [and] building . peak bone is an important strategy to reducing risk of osteoporosis later in life. Therefore, the opportunity to greatly influence bone-mass acquisition must occur before late adolescence (2000, p. 515) There was a statistically significant difference between Female STARCAP and REGULAR students mean canteen-derived calcium intakes. This was due to 95 STARCAP Females consuming more calcium-dense foods such as flavoured milk beverages and ice confection items than REGULAR Females. The results of this study agree with Johnsons assertion that "only children with a source of milk in their diets come close to meeting calcium recommendations" (2000, p. 298). It appears that for REGULAR students, particularly Females, soft drinks
displaced more nutrient-dense beverages such as milk-based drinks. The trend for carbonated beverages to displace important nutrients in adolescent diets has been observed in other studies (Douglas, 1998; Johnson, 2000; Weaver, 2000; Wildey, 2000) and is of concern because "the roles of micronutrients provided by milk [that] are required for growth and bone formation at this stage in life" (Douglas, 1998, p. 17) are being minimised Figure 12 illustrates the variation between the types ofbeverages purchased by the sub-groups in this study. Of particular note is the high soft drink consumption by REGULAR Female canteen users. 12 "0 Q) (f) 10 ro .c: ~ ::I 0. 8 IIl Flavoured Milk (f) Q) 0> ~ Q) Ill Soft Drinks 6 D Fruit Drinks D Bottled Water > Q) CD 0 4 (f) Q) 0. .::- 2 0 Starcap Females Regular Females Starcap Males Regular Males Figure 12. Canteen-derived types and number of beverages purchased by students 96 Because "milk
and dairy products provide the most important source of calcium in childrens diets" (Johnson, 2000, p. 298), an obvious way to increase calcium intake for REGULAR students in this study would be to remove soft drinks from canteen menus. This strategy could affect nutrient intakes two-fold - decrease the displacement of milk and other more nutrient-dense foods and reduce refined sugar intakes. For STARCAP Females and Males, while flavoured milk beverages and ice confection products contributed 76.5% and 772% respectively to total calcium intake, the high contribution these items made to saturated fat intake for STARCAP students has already been discussed, with the recommendation that reduced-fat milk beverages be offered on canteen menus and frozen yoghurt confections be promoted in place of ice confections. "Iron is an essential mineral, vital for carrying oxygen to all body tissues as well as removal of carbon dioxide from the tissues for excretion from the body via the
lungs" (Cobiac & Baghurst, 1993, p. S3) During adolescence, iron requirements are increased due to growth spurts which "create peaks of iron requirements . as a consequence of rapid expansion of the blood volume as well as gain in body mass" (NHMRC, 1991, p. 21) 97 Mean iron intakes were similar for all students in this study in that they were extremely low. This result mirrors similar studies where it has been found that adolescents "aged between 12-15 years had lowest average iron intakes [with females in particular] at very high risk of developing iron deficiency" (Cobiac & Baghurst, 1993, p. SlO) If the low canteen-derived iron intakes are indicative of usual iron intake for the students in this study, then concern surrounds the possibility of developing iron deficiency which can adversely affect "behaviour, cognitive function and motor development" (Cobiac & Baghurst, 1993, p. S5) for this age group Only seven students in this
study obtained one-third of the RDI for iron from canteen-derived foods. These intakes were similar in that they were characterised by higher weights of foods consumed than the mean sample weight and also comprised of at least two substantial food items. Concern surrounds individual students consuming a combination of food items like one pie and one sausage roll, or one h.amburger and one egg and bacon muffin during one school-time day. Depending on what else is consumed outside of school time, these combinations of foods may be supplying too much fat (especially saturated fat) to total energy for the students concerned. Good food sources of haem iron include red meat and chicken and good sources of non-haem iron include eggs, wholemeal bread and fortified cereals (Read & Kouris-Blazos, 1997, p. 302) Accordingly, canteens could offer and promote foods that are good sources of iron, without also being high in fat. 98 Examples include: steak and chicken sandwiches, rolls and
burgers served on a variety of breads with salad-based fillings; pasta dishes with meat sauce such as cannelloni, bolognaise, ravioli and lasagne; beef and chicken kebabs; souvlakia skewers; and meat-based dishes such as satay beef or tandoori chicken served in pita pockets. Summary Despite differences between what each canteen offered for sale, consumption patterns were remarkably similar for all sub-groups with sausage rolls, potato wedges, ice confections and flavoured milk beverages being popular choices. In addition, REGULAR students who had access to soft drinks and confectionery items frequently consumed these foods; 48% of REGULAR students recalled consuming one or more confectionery item and 70% recalled consuming one or more soft drink beverage. The consumption of these types of foods may be expected and even acceptable, if canteen foods were to form a minute proportion of total daily food intake. However, this is not the case with the canteens in this study being
responsible for providing 75% of students total school-time nutrient intake. The only positive impact the STARCAP program had was for STARCAP Female students in this study, for which there was a statistically significant difference for the intake of calcium between STARCAP and REGULAR Females. It appears that for 99 REGULAR Females, the consumption of soft drinks probably displaced the nutrients contained in.flavoured milk beverages and fruit drinks Of concern are the high proportions that saturated fat made to total energy for STARCAP students, which were approximately twice that of REGULAR students. Despite STARCAP canteens offering a range of healthful items for sale on their menus, they also included a limited number of commercially prepared hot savoury items, such as sausage rolls and beef pies. Sausage rolls were very popular choices for STARCAP students, for which this item alone contributed nearly half of saturated fat intake. The companson with current dietary
recommendations revealed that the canteen foods consumed by students in this study fell well short of meeting guidelines. These results are similar to other studies where dietary analyses have concluded that the eating patterns of children and adolescents are characterised by high fat and sugar intake, and low fibre, low complex carbohydrate and low selected mip.eral intake (Magarey & Boulton, 1995; Church, 1997; Douglas, 1998; Huon & Wardle, 1999; Huon, Wardle & Szabo, 1999; Brady, Lindquist, Herd, & Goran, 2000; Johnson, 2000). This is disturbing because "continued consumption of foods high in fat and sugar will have a detrimental effect on the health of. children" (Douglas, 1999, p 185) both in the short and long term. The results indicate that for the students who participated in this study, the STARCAP programs aim to "increase the availability . and sales of healthier 100 food choices" (WASCA Inc, 2000, p. 2) was effective when
companng STARCAP and REGULAR Female students one-day mean intake of calcium. The STARCAP canteens in this study provided a foodservice in accordance with current dietary recommendations more so than REGULAR canteens by way of offering fewer food items high in refined sugar and fat (such as soft drinks, cakes and pastries, confectionery and savoury items). However, the STARCAP students displayed a partiality to select from the limited range of high fat, commercially prepared food items over the more healthful options that were offered for sale. It appears, therefore, that in order to support students to make nutritious food choices at the canteen, healthful food options should be the only food options available for sale. 101 CHAPTER6 Summary and Recommendations This study was concerned with assessmg whether the Star Canteen Accreditation Program (STARCAP) better met the National Health and Medical Research Councils (1991) Recommended Dietary Intakes and the Goals and Targets
for Australias Health in the Year 2000 and Beyond (1993) compared to REGULAR canteens. Results conclude that the food choices made by students from REGULAR canteens contributed more to protein, (for which REGULAR Male students exceeded one-third of the RDI) and fat, (for which REGULAR Female students approached the upper limit of the Target that this nutrient not provide more than 30% of total energy). For the remainder of the nutrients analysed in this study, however, no sub-groups obtained one-third of the RDis or Targets from either STARCAP or REGULAR canteen food consumption. The examination of food items offered for sale at each canteen revealed that REGULAR canteens featured considerably more food items on their menus and that STARCAP canteens employed the practice of restricting the sale of certain food items, such as ice confections, cakes and pastries more so than REGULAR canteens. While STARCAP canteens offered a number of healthier food choices on their menus, all
students in this study exhibited similar food consumption 102 patterns, with sausage rolls, potato wedges, ice confections and flavoured milk beverages being popular choices. The recommendations in this section are presented to address nutrient concerns that are relevant to the students in this study. Reduce Fat Intake to Less Than 30% of Total Energy Intake There are a number of changes that school canteens could implement to meet this recommendation, the simplest being the replacement of high fat foods that are presently offered for sale with organoleptically attractive lower fat foods. However, care needs to be taken so that organoleptic acceptance is not compromised as taste has been identified as an important determining factor in food choice behaviour (Huon, Wardle & Szabo, 1999; Neumark-Sztainer, Story, Perry & Casey, 1999). There have been attempts by school canteens to replace popular, high fat food items with lower fat varieties, most notably Munja meat pies.
According to canteen management opinion, students did not like the taste of this food item and consequently it was removed from the canteen menu. Despite entrenched taste preferences for less than healthy items, the sale of high fat foods (including chocolate-based confectionery, high fat cake and pastry items and meal deals) could be restricted to special occasions on the school calendar to reinforce dietary recommendations that these foods as suitable for occasional consumption only. By providing a more 103 positive food environment, students may be encouraged towards healthier selections (Nestle et al., 1998) Reduce Saturated Fat Intake to Less Than 10% of Total Energy Intake One main contributor to the intake of this nutrient, particularly for STARCAP students, was the consumption of whole-milk flavoured beverages (Supershakes ). The removal of this item from canteen menus would be one simple way to reduce saturated fat intake. Milk is, however, an important
contributor to a number of nutrients. Therefore, it is recommended that wholemilk beverages be replaced with reduced or low-fat milk beverages Although reduced and low-fat milks would not be appropriate for young children, for adolescents who consume milk as a recreational item, reduced and low-fat varieties would be beneficial in maintaining the intake of nutrients provided by this food. Increase Folate Intake to One-Third ofthe 200ug RDI Folate occurs in a wide variety of foods, particularly green leafy vegetables, fortified breakfast cereals, citrus fruits and nuts. Canteen menus which include a variety of folate-rich foods would be an effective way to help students to obtain a higher intake of this nutrient, particularly in light of the limited canteen food consumption patterns exhibited by the students in this study. 104 Canteens could encourage students to eat a wider variety of folate-rich foods by including them in the preparation of food items. For example, carbohydrate
rich products can incorporate fortified cereals and nuts; salad rolls, sandwiches and burgers can be served with dark green lettuce varieties such as rocket and watercress. Increase Fibre Intake A number of items offered by school canteens, such as sandwiches and rolls pasta-based dishes, soups and salads are good sources of dietary fibre. Whilst they were not popular choices with the students in this study, there may be factors that make these choices unappealing in terms of perceived convenience. Therefore, for meals that require seating, canteens could play a role to ensure these amenities are provided to students. Canteens could also present these foods as practically as possible for students to consume on the run. For example, some fruits and vegetables could be peeled, cut and prepacked for sale. Although cutting and peeling reduces the dietary fibre (and vitamin) content to some extent, food preparation techniques such as soaking in minimal water and preparing these items
close to serving time can aid in nutrient retention. Ultimately, to increase the fibre intake of students, the inclusion of fibre-rich foods such as cereals, legumes, vegetables, fruits, nuts, seeds, breads and baked goods produced with wholemeal, mixed grain, wheatmeal and bran could help students to obtain the health-related benefits that.fiqre offers 105 Increase Calcium Intake For REGULAR students who had access to soft drinks in this study, it appears that these items displaced flavoured milk beverages and were accountable for lower calcium intakes compared to STARCAP students. Because soft drinks are nutrient-poor, it may be better if they were not offered for sale by school canteens. Similarly, while ice confection items contributed to students calcium intake, these items also contributed to fat and refined sugar intake. A more nutritious option would be frozen yoghurt because of its lower fat and higher calcium content compared to ice cream. Cheese is also an
excellent source of calcium and therefore it is recommended that food items which include fresh, reduced or low-fat cheese be considered for inclusion on canteen menus. Examples are numerous and include pasta and vegetable-based dishes such as ricotta macaroni, tomato and cottage cheese cannelloni, feta and zucchini moussaka and baked stuffed potatoes. Similarly, a variety of breadbased dishes which feature low-fat cheese as an ingredient include suggestions such as ham and pineapple pizzettas, focaccia melts, and open and club sandwiches. Increase Iron Intake To address the low iron intakes demonstrated by the students in this study, the promotion of good food sources of iron such as lean meat and lean chicken, fish~ eggs, fortified breakfast cereal, legumes and dried fruit is of paramotmt 106 priority. Accordingly, canteens could offer a range of food items that may assist students to obtain adequate amounts of this nutrient such as steak sandwiches and burgers with
salad-based fillings served on a variety of breads, packaged dried fruits and nuts, frittatas, chicken drumsticks, sweet n sour pork spare ribs, shaved beef open sandwiches, kebabs, chicken Hawaiian pita rolls, lean beef and lean chicken stir-fry and noodles, and meat-based dishes such as satay, tandoori, moussaka, cannelloni, bolognaise, ravioli and lasagne. Summary Australias 7000 school canteens "feed over one million students [and] . collectively, this comprises Australias largest take-away food outlet" (Nutrition Australia, 2000). Due to societal changes, school canteens are increasingly being relied upon as a main supplier of food for school-aged children; for the students in this study, 75% of foods consumed at school were sourced from the school canteen. Given this, it is fundamentally important that school canteens implement dietary intervention strategies that provide students with nutritious food which, in tum, will enhance general well- being and assist in the
prevention of diet-related diseases. Due to their location within educational sites, school canteens have an obligation to reinforce health-related education programs taught in schools and the wider community if they are to play a positive role in influencing the health status of students. 107 References Antine, S.A (1997) American Health Foundation releases study suggesting teenagers and young adults arent getting enough fiber. [on-line] Available WWW: http://www.kidsourcecom/kidsource/content2/news/ Fiber/html. [03/04/00] Archer, M.C (1996) Cancer and Diet In EE Ziegler, & LJ Filer (Ed), Present Knowledge in Nutrition. (Chapter 48) Washington DC: International Life Sciences Institute. Australia New Zealand Food Authority. (2000) AUSNUT - A new nutritional CD database launched today. [on-line] Available WWW: http://www.anzfagovau/documents/mr02 OOasp [14/08/00] Australian Bureau of Statistics. (1995) National nutrition survey: Foods eaten. Canberra: Australian Government
Publishing Service Australian Bureau of Statistics. (1996) Census of population and housing Canberra: Australian Government Publishing Service. Australian Bureau of Statistics. (1997) National nutrition survey selected highlights Australia 1995. Canberra: Australian Government Publishing Service. Australian Institute of Health and Welfare & Commonwealth Department of Health and Family Services. (1996) First report on national health priority areas 1996. Canberra: Goanna Print Australian Nutrition Foundation In~. (1985) The complete school canteen book. Frenchs Forest, NSW: Reed Books PtyLtd Ball, M. (1997a) Atherosclerotic vascular disease and hypertension In ML Wahlqvist (Ed.), Food and Nutrition: Australasia, Asia and the Pacific (Chapter 37). Australia: Allen and Unwin Pty Ltd Ball, M. (1997b) Diabetes In ML Wahlqvist (Ed), Food and Nutrition: Australasia, Asia and the Pacific. (Chapter 38) Australia: Allen and Unwin Pty Ltd. Baghurst, K.I, Hertzler, AA, Record, SJ, & Spurr,
C (1992) The development of a simple dietary assessment and education tool for use by individuals and nutrition educators. Journal ofNutrition Education, 24, 165-172. 108 Baranowski, T., Darnel, S, Gould, R, Baranowski, J, Leonard, S, Treiber, F, & Mullis, R. (1993) Increasing fmit and vegetable consumption among 41h and 51h grade students: results from focus groups using reciprocal determinism. Journal of Nutrition Education, 25 (3), 115120 Birch, L.L (1993) Children, parents and food British Food Journal, 95 (9), 11-15. Booth, M.L, Wake, M, Armstrong, T, Chey, T, Hesketh, K, & Mathur, S (2001 ). The epidemiology of overweight and obesity among Australian children and adolescents, 1995-97. Australian Journal of Public Health, 25 (2), 162-169. Borja, M.E, Bordi, PL, & Lambert, CU (1996) New lower-fat dessert recipes for the school lunch program are well accepted by children. Journal ofthe American Dietetic Association, 96 (9), 908-910. Brady, L.M, Lindquist, CH, Herd,
SL, & Goran, MI (2000) Comparison of childrens dietary intake patterns with US dietary guidelines. British Journal ofNutrition, 84 (3), 361-367. Carter, P., & Kellett, E (1996) School canteens [on-line] Available WWW: http://WWW.monasheduau/ANF/newsletter/Mar-96/6htm Chambers, E., Godwin, SL, & Vecchio, FA (2000) Cognitive strategies for reporting portion sizes using dietary recall procedures. Journal of the American Dietetic Association, 100 (8), 891-897. Chapman, N., Gordon, AR, & Burgharat, JA (1995) Factors affecting the fat content of National School Lunch program lunches. American Journal of Clinical Nutrition, 95 (61), 199S-204S. Cholin, B. (1999) Encouraging healthy diets in adolescent girls Nutrition and Health (13), 103-108. Church, S. (1997) School food- turning the tide Nutrition & Food Science, 97 (1), 20-22. Cobiac, L., & Baghurst, KI (1993) Iron status and dietary iron intakes of Australians. Food Australia, 45 (4), S1-S23 Commonwealth Department
of Health, Housing & Community Services. (1993). Goals and Targets for Australias Health in the Year 2000 and Beyond. Canberra: Australian Government Publishing Service 109 Domel-Baxter, S., Thompson, WO, Davis, HC, & Johnson, MH (1997) Impact of gender, ethnicity, meal component and time interval between eating and reporting on accuracy of fourth-graders self-reports of school lunch. Journal of the American Dietetic Association, 97 (11), 1293-1298. Douglas, L. (1998) Childrens food choice Nutrition & Food Science, 98 (1), 14-18. Douglas, L. (1999) Contribution of "packed lunches" to the dietary intake of 11-12-year-old children. Nutrition and Food Science, 4 (4), 181-186 Education Department of South Australia/Health Department Foundation South Australia. (1988) The school canteen: an opportunity to improve childrens heath. Noarlunga Centre: The Heath Department Foundation. Gallaher, D.D, & Schneeman, BO (1996) Dietary Fiber In EE Ziegler, & L.J
Filer (Ed), Present Knowledge in Nutrition (Chapter 9). Washington DC: International Life Sciences Institute. Gibbons, K.L, Wertheim, EH, Paxton, SJ, Petrovich, T, & Szmukler, GI (1995). Nutrient intake of adolescents and its relationship to desire for thinness, weight loss behaviours and bulimic tendencies. Australian Journal of Nutrition and Dietetics, 52 (2), 69-7 4.s Gibson, R.S (1993) Nutritional assessment: a laboratory manual New York: Oxford University Press. Guthrie, J. (1996) USDA acts to improve school meals and childrens nutrition. Foodreview, 19 (2), 55-56 Harris, K.J, Paine-Andrews, A, Richter, KP, Lewis, RK, Johnston, JA, James, V., Henke, L, & Fawcett, SB (1997) Reducing elementary school childrens risks for chronic diseases through school lunch modifications, nutrition education and physical activity interventions. Journal ofNutrition Education, 29 (4), 196-202. Health Development Foundation. (1995) South Australian school buying guide. Nutrition Section of the
Health Development Foundation: North Adelaide, South Australia. Heart Foundation of Australia. (1999) Heart, stroke and vascular diseases, Australian facts. Canberra: Australian Institute of Health and Welfare Huck, S., & Cormer, W (1996) Reading statistics and research New York: Harper Collins. 110 Hughes, R., & Clifford, H (2000) Food group composition of Year 1 school students lunchboxes and implications for school-based nutrition interventions. Journal of the HEIA, 7 (4), 27-30 Huon, G.F, Wardle, J, & Szabo, M (1999) Improving childrens eating patterns: intervention programs and underlying principles. Australian Journal ofNutrition and Dietetics, 56 (3), 156-165. Johnson, R.K (2000) Changing eating and physical activity patterns of US children. Proceedings of the Nutrition Society, 59 (2), 295-301 Jones, G.P (1997a) Carbohydrates In ML Wahlqvist (Ed), Food and Nutrition: Australasia, Asia and the Pacific. (Chapter 21) Australia: Allen and Unwin Pty Ltd. Jones, G.P
(1997b) Fats In ML Wahlqvist (Ed), Food and Nutrition: Australasia, Asia and the Pacific. (Chapter 22) Australia: Allen and Unwin Pty Ltd. Jones, G.P (1997c) Dietary fibre and resistant starch In ML Wahlqvist (Ed.), Food and Nutrition: Australasia, Asia and the Pacific (Chapter 23). Australia: Allen and Unwin Pty Ltd Jones, G.P (1997d) Minerals In ML Wahlqvist (Ed), Food and Nutrition: Australasia, Asia and the Pacific. (Chapter 25) Australia: Allen and Unwin Pty Ltd. Kennedy, L. (1996) Whats a health promoting school? [on-line] Published in ANF National, Vol. 1, No 26 October 1996 Available WWW: http://WWW.monasheduau/ANF/newsletter/Oct-96/ho-schoohtm Law, M. (2000) Dietary fat and adult diseases and the implications for childhood nutrition: an epidemiologic approach. The American Journal of Clinical Nutrition, 52 (5s), 1291s-1296s. Livingstone, M.BE, & Robson, PJ (2000) Measurement of dietary intake in children. Proceedings of the Nutrition Society, 59 (2), 279-293 McBride, S.
(1992) The effect of canteen menu on nutritional knowledge, attitudes and behaviour of Year 5 students. Unpublished masters dissertation, Edith Cowan University, Perth, Western Australia. McBride, S., & Browne, J (1993) The school canteen: advocate or adversary in school health promotion? Health Promotion Journal of Australia, 3 (3), 15-19. Magarey, A., & Boulton, J (1995) The Adelaide nutrition study 4 Meal habits and distribution of energy and nutrients throughout the day at . ages 11, 13 and 15 years Australian Journal ofNutrition and Dietetics, . 52 (3), 132-138 111 Magarey, A., Daniels, LA, & Smith A (2001) Fruit and vegetable intakes of Australians aged 2-18 years: and evaluation of the 1995 National Nutrition Survey data. Australian and New Zealand Journal of Public Heath, 25 (2), 155-161. Marshall, B.J, Sheehan, MM, Northfield, JR, Maher, S, Carlisle, R, & St Leger, L.H (2000) School-based health promotion across Australia Journal of School Health, 70 (6),
251-252. Melnik, T.A, Rhoades, SJ, Wales, KR, Cowel, C, &Wolfe, W (1998) Food consumption patterns of elementary schoolchildren in New York City. Journal of the American Dietetic Association, 98 (2), 159-164 Meyer, M.K (2000) Top predictors of middle/junior high school students satisfaction with school foodservice and nutrition programs. Journal of the American Dietetic Association, 100 (1 ), 100-103. Meyer, M.K, & Conklin, MT (1998) Variables affecting high school students perceptions of school foodservice. Journal of the American Dietetic Association, 98 (12), 1424-1428. Miller, M. (1993) Nutrition of school children and its implications for health promotion in schools. Health in Schools (7), 12 National Health and Medical Research Council. (1991) Recommended dietary intakes for use in Australia. Canberra: Australian Government Publishing Service. National Health and Medical Research Council. (1995) Dietary guidelines for children and adolescents. Canberra: Australian
Government Publishing Service. National Heart Foundation (WA Division). (1993) School canteen handbook Subiaco, WA: National Heart Foundation. Nestle, M., Wing, R, Birch, L, DiSogra, L, Drewnowski, A, Arbor, A, Middleton, S., Sigman-Grant, M, Sohal, J, Winston, M, Economos, C (1998). Behavioural and social influences on food choice Nutrition Reviews, 56 (5), 550-560. Neumark-Sztainer, D., Story, M, Perry, C, & Casey, MA (1999) Factors influencing food choices of adolescents: findings from focus-group discussions with adolescents. Journal of the American Dietetic Association, 99 (8), 929-934, 937. Nowak, M. (1998) The weight-conscious adolescent: body image, food intake and weight-related behaviour. Journal of Adolescent Health, 23 (6), 389-398. 112 Nowak, M., & Crawford, D (1998) Getting the message across; adolescents health concerns and views about the importance of food. Australian Journal ofNutrition and Dietetics, 55 (1), 3-8. Available WWW: Nutrition Australia: News
in Nutrition [on line]. http://www.nutritionaustraliaorg [2001, October 25] ODea, J. (1995) Body image and nutritional status among adolescents and adults - a review of the literature. Australian Journal of Nutrition and Dietetics, 52 (2), 56-67. ODea, J., Abraham, S, & Heard, R (1996) Food habits, body image and weight control practices of young male and female adolescents. Australian Journal ofNutrition and Dietetics, 53 (1), 32-38. Owen, S., Schickler, P, & Davies, J (1997) Food choice: how to assess attitudes of pre-adolescent children. Nutrition and Food Science, 97 (1), 5-11. Perth Dental Hospital and Community Dental Services. (May, 1999). [Leaflet]. (Available from Dental Health Education Unit, 43 Mt Hemy Road, Como, 6152, Western Australia). Pirouznia, M. (2001) The association between nutrition knowledge and eating behaviour in male and female adolescents in the US. International Journal ofFood Sciences and Nutrition, 52 (2), 127-132. Read, R.SD (1997) Food energy and
energy expenditure In ML Wahlqvist (Ed.), Food and Nutrition: Australasia, Asia and the Pacific (Chapter 18). Australia: Allen and Unwin Pty Ltd Read, S.D, & Kouris-Blazos, A (1997) Foods, physical activity and sport In M.L Wahlqvist (Ed), Food and Nutrition: Australasia, Asia and the Pacific. (Chapter 30) Australia: Allen and Unwin Pty Ltd Riley, M., & Dean, K (1997) Dietary intake of Australian schoolchildren aged 10 to 15 years in 1985- regional variation by state and territory. Australian Journal ofNutrition and Dietetics, 54 (3), 127-135. Rowling, L., & Rissel, C (2000) Impact of the National Health Promoting School initiative. Journal of School Health, 70 (6), 260 Ruxton, C.HS, Kirk, TR, Belton, NR, & Holmes, MAM (1993) School meals. British Food Journal, 95 (8), 9-12 Saxelby, C. (1999) Nutrition for life: everything you need to lmow about food and nutrition. South Yarra: Hardie Grant Books 113 School canteens- how can I be a catalyst for change? (no date).
[Handout] (Available from Western Australian School Canteen Association (Inc.), PO Box 25, Hillarys, 6923, Western Australia). Seaman, C.EA, Bower, J, & Fleming, M (1997) Nutrition knowledge and lunchtime eating habits of secondary school children in Lothian. Journal of Consumer Studies and Home Economics, 21 (3), 259-269. Sherwood, N.E, & Neumark-Sztainer, D (2001) Internalisation of the sociocultural ideal: Weight related attitudes and dieting behaviours among young adolescent girls. American Journal of Health Promotion, 12 (4), 228-231. St. Leger, L, & Nutbeam, D (2000) Research into health promoting schools Journal of School Health, 70 (6), 257-260). Starcap- participating schools. (2000) [Handout] (Available from Western Australian School Canteen Project, PO Box 25, Hillarys, 6923, Western Australia). Steinbeck, K. (1995) Adolescent eating habits: how they affect nutritional status. Iron Deficiency in Teenagers Seminar [on-line] Available at WWW:
http://WWW.mlacomau/edu/schools/habitscfm Story, M., Hayes, M, & Kalina, B (1996) Availability of foods in high schools: is there cause for concern? Journal of the American Dietetic Association, 96 (2), 123-128. Story, M., Neumark-Sztainer, D, Sherwood, N, Stang, J, & Murray, D (1998). Dieting status and its relationship to eating and physical activity behaviors in a representative sample of US adolescents. Journal ofthe American Dietetic Association, 98 (10), 1127-1132. Strategy grab bag. Health in Schools, 4 (1), 17 Tilston, C.H, Neale, RJ, Gregson, K, & Douglas, CJ (1992) A study of the nutritional composition of primary school childrens packed lunches and school meals. Journal of Consumer Studies and Home Economics, 16 (2), 97-107. Valentini, H., Walker, J, & Riddell, R (1997) The Australian Nutrition Foundation: improving the health of school canteens. Journal of the Home Economics Institute, 4 (1), 8-10. Victorian Dairy Industry Authority. (1978) Canteen managers
handbook Victoria: VDIA. Wahlqvist, M.L (1997) Vitamins and vitamin-like compounds In ML . Wahlqvist (Ed), Food and Nutrition: Australasia, Asia and the Pacific · (Chapter 24). Australia: Allen and Unwin Pty Ltd 114 Wahlqvist, M.L, & Kouris-Blazos, A (1997) Dietary advice and food guidance systems. In ML Wahlqvist (Ed), Food and Nutrition: Australasia, Asia and the Pacific. (Chapter 52) Australia: Allen and Unwin Pty Ltd. Weaver, C.M (2000) Calcium and magnesium requirements of children and adolescents and peak bone mass. The International Journal of Applied and Basic Nutritional Sciences, 16 (7/8), 514:516. Western Australian School Canteen Association (Inc). (WASCA) (2000) Star Canteen Accreditation Program - a guide to reaching the stars. [Brochure]. Perth, Western Australia: Health Department of Western Australia. Williams, H.M, Woodward, DR, Ball, PJ, Cumming, FJ, Hornsby, H, & Boon, J.A (1993) Food perceptions and food consumption among Tasmanian high school
students. Australian Journal of Nutrition and Dietetics, 50 (4), 156-163. Woolfolk, A.E (1998) Educational psychology, Allyn and Bacon. ih Ed. Needham Heights: Worsfold, D., & Griffith, C (1992) The quality of schoolchildrens packed lunches. British Food Journal, 94 (4), 12-16 Young, I. (1993) Healthy eating policies in schools Journal, 52 (1), 3-9. Health Education 115 APPENDIX A Date:------------------- The Principal Address: ---------------- Dear Principal I am writing to formally introduce myself and to seek your approval to undertake research at your school about what foods students consume while at school. My name is Jenny Kora and I am an Honours student at Edith Cowan University. I am currently emolled in the Bachelor of Education course and my major area of study is home economics. The aim of the research project is to determine the nutrient profile of students canteen food purchases and to compare this to the National Health and Medical Research Councils
Recommended Dietary Intakes (1992). I am therefore requesting access to two Year 8 home economics classes for approximately 15 minutes each. During this time I aim to elicit food recall information from the students by requesting them to list all food items consumed while at school for that day on a simple form. If possible, I would like to do this exercise with each class immediately after lunch wherever timetables permit, to promote food recall accuracy. I would be grateful if you would agree to participate in this study and I can assure you that the students anonymity will be protected as no school will be mentioned in a way that can be identified. You are most welcome to contact me to discuss the research project as follows: Telephone: E-mail: (08) 9371 7583 mcmilesv@bigpond.com Alternatively, you can speak to my supervisor, Dr Delia Quinn, whose contact details are as follows: Telephone: E-mail: (08) 9370 6345 d.quinn@cowaneduau . /2 116 Page2 For your information I have
enclosed a copy of the food recall instrument that the students will be requested to complete. Also enclosed is a copy of the consent form that I would issue to each student, as well as two copies of this letter. If you are willing to participate in the study, please keep one copy of this letter for your records and sign and return the other copy in the stamped and addressed envelope provided. Once the proposed study is complete, I will forward to you a report on the findings and I look forward to Lakelands Senior High Schools involvement in this study. Yours sincerely Jenny Kora (Miss) Att: Data Collection Form Student Consent Form Stamped and addressed envelope I have read the information above and any questions I have asked have been answered to my satisfaction. I agree to [Schools] participation in this study and understand that the research data gathered for this study may be published provided [School] is not identifiable. Participant Date Researcher Date 117 L j .•
•--ema•e LJ > ; " d ;<· uate or tslrtn l .j; (l, ,, Lunch: Morning Recess: Before School Started: . Name of food or drink: ! r I p I i • • -: ,7 ·=A,. A Amount of food or drink: Where the food or drink came from: C =Canteen H Home :" ,: jJ. " .?(;;;t d ·~··n· · k t . d·] ·y· - ? ~,il::t®. ~-!Lt ~lA··, dj ····r! ···t· ; ·a · .• Wh--~-eytw•·. d········--·I~:d/@· ~:-~·, Y·~- /·()J1l: . • .! ·· •• • • IVIale = ~ ~, z ~ APPENDIXC Procedure for Data Collection Prior to Data Collection Procedure: 1. Write name and date on blackboard. 2. Write a blank food recall sheet on blackboard to be used as a sample for demonstration. 3. Set up food models, including sample one-day school-time food and beverage items. During Data Collection Procedure: 1. Self-introduction. 2. Explain that everyone is going to play a part in a study to determine the types of foods and
drinks Year 8 students typically consume while at school. 3. Hand out student consent forms. Read consent forms aloud to students Ask students to sign consent forms if they agree to participate. Collect signed consent forms. 4. Hand out food recall sheets to students - ask them NOT to write on sheets at this stage. 5. Show students the food models on display. Explain that the models might help students to prompt their memory about the food and drink items they consumed for that day. 6. Show students the sample one-day school-time food intake items, which will consist primarily of the food and beverage items sourced from the school canteen on the day: • Before School Started: 1 x fruit item brought fi·om home • Morning Recess: 1 x main meal item available fi·om school canteen Y, offiiend s banana brought fi·om home • Lunch: 1 x drink item available fiom school canteen 1 x main meal item available fiwn school canteen 1 x snack available fi·om school canteen 7.
Demonstrate how to complete the food recall sheet by entering the sample one-day school-time food intake items on the blackboard. 8. Stress that the source of food and drinks items must be noted in the right-hand column (C=Canteen, H=Home) as well as any food sharing intake (expressed in terms of bites) and beverage intake (expressed in terms of"gulps"). 9. Ask if there are any questions and answer questions that arise. 10. Instruct students to complete their food recall sheets. Supervise students while they complete their food recall sheets and assist where .·necessary 11. · Check each food recall sheet before collection and thank students for their time and cooperation. 119 APPENDIXD CONSENT FORM • You are being invited to take part in a study about what students eat and drink while they are at school. • You will be asked to remember all the food and drink you have consumed today up until the end of lunchtime and to write each item on a simple form. •
The information you provide is confidential and anonymous and there are no right or wrong answers, so the information you provide will not affect your school marks or grades. • The most important thing is to try to remember everything you ate and drank today, and to be honest about the information you are providing. Thank you. I agree to participate in the study, providing I can withdraw at any time. I agree that results can be published provided that neither myself nor the school can be identified. Signed: . Date: . 120
are entitled to take legal action against persons who infringe their copyright. A reproduction of material that is protected by copyright may be a copyright infringement. A court may impose penalties and award damages in relation to offences and infringements relating to copyright material. Higher penalties may apply, and higher damages may be awarded, for offences and infringements involving the conversion of material into digital or electronic form. EDITH COWAN UNIVERSITY High School Students Food Choices: A Nutrient Analysis of Students Canteen Purchases at Four High Schools By JennyKora A Thesis Submitted in Partial Fulfilment of the Requirements for the Award of Bachelor of Education with Honours at the Faculty of Community Services, Education and Social Services Edith Cowan University Supervisor: Dr Delia Quinn Date of Submission: 6th November 2001 USE OF THESIS The Use of Thesis statement is not included in this version of the thesis. EDITH COWAN
UNIVERSITY Declaration I certify that this thesis does not, to the best of my knowledge and belief: (i) incorporate without acknowledgment any material previously submitted for a degree or diploma in any institution of higher education; (ii) contain any material previously published or written by another person except where due reference has been made in the text; or (iii) Signed; contain any defamatory material. Date: Itt 06 I /o / I 3 EDITH COWAN UNIVERSITY Acknowledgements I wish to express my appreciation to the people who provided assistance during this project. Sincere thanks to Dr Delia Quinn for your advice, guidance and dislike of superfluous words - you helped me to get to the point. Thank you for your unending support at all stages of this project. Grateful appreciation for the assistance of Principals, teachers and students who participated in this project. A special thank you to canteen staff for your cheerful assistance with additional telephone
queries. Thank you to Robin Bromley at the WASCA for your time in supplying valuable information regarding the STARCAP program. Finally to Vern, who put up with me and fed me during some of the treacherous stages of this project. Your winning ways with frozen potato gems are a marvel. 4 Abstract Links exist between poor eating habits established during childhood and adolescence and the development of dental decay, obesity and anaemia early in life (Ruxton, Kirk, Belton & Holmes, 1993; Douglas, 1999), as well as a number of diseases of affluence, including cardiovascular disease, diabetes and some cancers later in life (Baranowski et al., 1993; Birch, 1993; National Health and Medical Research Council, 1995; Antine, 1997; Harris et al., 1997; Douglas, 1998; Melnik, Rhoades, Wales, Cowel & Wolfe, 1998; Cholin, 1999; Huon, Wardle & Szabo, 1999). Adolescence has been identified as a umque stage in the life cycle when increased amounts of nutrients are required due to
rapid growth. It has been suggested that the food and beverage items consumed by students while at school should contribute approximately one-third of their daily nutrient intake (Perth Dental Hospital and Community Dental Services, 1999). Since the mid-1980s, greater awareness of school-time eating habits has resulted in a number of initiatives aimed at promoting more healthful canteens in Australian schools. In Western Australia, the Western Australian School Canteen Association (WASCA) assists schools to adopt and maintain healthy canteens. One of WASCAs strategies is the Star Accreditation Program (STARCAP), which awards schools that operate healthy canteens using a star rating system. similar to that used in the hospitality and tourism industry 5 The Starcap programs aim is to "increase the availability, promotion and sales of healthier food choices . in schools in Western Australia" (Western Australian School Canteen Association, 2000, p. 2) The purpose of this
study was to compare the nutrient intakes of students school-time food and beverage consumption of two STARCAP canteens and two REGULAR canteens and the National Health and Medical Research Councils (1991) Recommended Dietary Intakes. Four Perth metropolitan co-educational government high schools were selected to participate in this study; two schools with canteens that were participating in the STARCAP program and two schools with REGULAR canteens. Using a modified version of the 24-hour food recall method, students in two Year 8 classes at each school were asked to recall one days food and beverage items consumed whilst at school. Analysis of data included evaluating what was offered for sale at each canteen, as well as comparing the proportion·of students who consumed the majority of their school-time food intake from the school canteen to those who consumed foods mostly brought from home. The students mean nutrient intakes of food and beverage items consumed from each canteen
were ascertained using a nutrient analysis software package (SERVE), and comparisons were made with the National Health and Medical Councils (1991) Recommended Dietary Intakes. 6 The findings from this study could be used to indicate how the STARCAP programs aim to increase the availability of healthier food choices in school canteens affects the nutrient and energy intakes of students. Furthermore, findings could have implications for future health promotion initiatives with regard to school canteens and education programs directed at adolescents. 7 Table of Contents TITLE PAGE . 1 USE OF THESIS . 2 DECLARATION . 3 ACI<NOWLEDGEMENTS . 4 ABSTRACT . 5 TABLE OF CONTENTS . 8 LIST OF TABLES . 12 LIST OF FIGURES . 13 LIST OF APPENDICES . 14 CHAPTER 1: INTRODUCTION . 15 Background to the Study . 15 Significance of the Study . 16 Purpose of the Study . 16 CHAPTER 2: LITERATURE REVIEW . 17 Introduction . ~ 17 Eating Habits and Diseases of Affluence . 17 Nutritional Concerns
During Adolescence . 19 Characteristics of Adolescence . 21 Nutritional Importance of School-time Food Intake . 23 School Canteens in Australia . 25 STARCAP Accreditation . 27 Summary . 28 Research Questions . 30 8 CHAPTER 3: MATERIALS AND METHODS . 31 Research Design . 31 Sample Selection . 33 Instruments and Equipment . 35 Data Collection Procedure . 37 Data Analysis . 40 Limitations . 45 CHAPTER 4: RESULTS . 47 Introduction . 4 7 School Canteen Menus - What Do They Offer? . 4 7 Sandwiches/Rolls . 49 Hot Savouries . 49 Hot Meals . 50 Salads/Fresh Fruit . 50 Cakes/Pastries . 50 Ice Confection/Dairy . 51 Confectionery . ~ 52 Beverages . 52 Daily Specials . 53 Who Purchased Items from the Canteen? . 53 Canteen Food as a Source of Nutrients- How Does Each Canteen Compare? . 54 Nutrient Intakes -How Do They Measure Up to the RDis and National Targets? . 58 Macronutrients . 58 Protein . 58 9 Carbohydrates . 59 Total Fat . 60 Dietary Fibre . 62 Vitamins . , 64 Folate . 64
Minerals . 65 Calcium . 65 Iron . 66 Summary . 68 CHAPTER 5: DISCUSSION . 70 Introduction . 70 Canteen Food Consumption Patterns . 70 Sandwiches/R.olls 71 Hot Savouries . 73 Hot Meals . 75 Salads/Fresh Fruit . 76 Cakes/Pastries . 78 Ice Confection/Dairy . 79 Confectionery . 80 Beverages . 82 Daily Specials . 83 Canteen Usage . 85 Nutrient Intakes - How Do They Measure Up to the RDis and National Targets? . 86 Macronutrients . 86 Protein . 86 10 Carbohydrates . 88 Total Fat. 90 Fibre . 92 Vitamins . 94 Folate . 94 Minerals . 9 5 Calcium . 95 Iron . 97 Summary . 99 CHAPTER 6: SUMMARY AND RECOMMENDATIONS . 102 REFERENCES . 108 APPENDIX A . 116 APPENDIX B . 118 APPENDIX C . 119 APPENDIX D . 120 11 List of Tables Table: Page: 1. Sample population by canteen, gender and mean age . 34 2. Weekly median household income ($AUS) of participating schools . 35 3. Sample for data analysis by canteen type, gender and mean age . 41 4. Food items offered for sale at the two Starcap
canteens and the two Regular canteens . 48 5. Gender, number and percentage of students who purchased items from each canteen or consumed no food or beverage items . 53 6. Mean nutrient intakes for female students . 54 7. Mean nutrient intakes for male students . 55 8. Example food recalls from REGULAR canteen . 56 9. Percentages ofRDis and National Targets obtained from canteen food consumption for each sub-group . 57 12 List of Figures Figure: Page: 1. Total gram weight and percentage contribution of canteenderived and home-brought foods to total school-time food intake . 42 2. Mean canteen-derived protein intake and% ofRDI . 58 3. Mean canteen-derived carbohydrate intake and % of Target set for carbohydrate as a proportion of total energy . 59 4. Mean canteen-derived total fat intake and % of Target set for fat as a proportion of total energy . 60 5. Percentage of canteen-derived monounsaturated, polyunsaturated and saturated fat to total energy intake .
62 6. Mean canteen-derived fibre intake and% of recommended intake . 63 7. Mean canteen-derived folate intake and% ofRDI . 64 8. Mean canteen-derived calcium intake and% ofRDI. 65 9. Mean canteen-derived iron intake and% ofRDI . 66 10. Percentage of canteen purchases from each food category . 71 11. Contribution of consumption of sausage rolls to saturated fat intake . 74 12. Canteen-derived types and number ofbeverages purchased by students . 96 13 List of Appendices Appendix: Page: A. Copy of permission letter to Principals . 116 B. Copy of data collection instrument. 118 C. Copy of data collection procedure . 119 D. Copy of student consent form . 120 14 CHAPTER! Introduction Background to the Study School canteens in Australia have been charged with the responsibility for providing over a third of students daily nutrient requirements (Perth Dental Hospital and Community Dental Services, 1999) and it is estimated that one quarter of students
purchase food and beverage items from school canteens daily (Western Australian School Cante,en Association, 2000, p. 2) School canteens are increasingly being encouraged to provide nutritious food and beverage items consistent with current dietary recommendations. This is due, in part, to mounting evidence fo~ diet-related links between eating patterns established during childhood and adolescence and the occurrence of diseases of affluence in adulthood (Baranowski et al., 1993; Birch, 1993; NHMRC, 1995; Antine, 1997; Harris et al., 1997; Douglas, 1998; Melnik, Rhoades, Wales, Cowel & Wolfe, 1998; Cholin, 1999; Huon, Wardle & Szabo, 1999; Law, 2000; Livingstone & Robson, 2000). In Western Australia, the Star Canteen Accreditation Program (STARCAP) was launched in July 1996. This program is an initiative of The Western Australian School Canteen Association (WASCA), in partnership with the Heart 15 Foundation of Australia (WA Division) and the Nutrition Program of the
Health Department of Western Australia. The STARCAP program aims to "increase the availability, promotion and sales of healthier food choices . in in Western Australia" schools (Western Australian School Canteen Association, 2000, p. 2) Significance of the Study Up to now, a nutritional analysis of food and beverage items consumed from STARCAP canteens does not appear to have been carried out to determine whether the programs aim to increase sales of healthier food choices in Western Australian school canteens actually provides students with improved nutrient intake. Purpose of the Study The aim of this study was to determine whether the mean nutrient intake of foods consumed from STARCAP registered canteens better meet the National Health and Medical Research Councils (1991) Recommended Dietary Intakes and the Goals and Targets for Australias Health in the Year 2000 and Beyond (1993) than the mean nutrient intake from REGULAR canteens. This study has both local
and national relevance with implications for future practice and poli~yin this area ofhealth. 16 CHAPTER2 Literature Review Introduction This literature review begins with a discussion concerning the links between eating habits that are established during childhood and adolescence and the development of various diseases of affluence later in life. Nutritional concerns specific to adolescence are examined, followed by a discussion of factors that can influence food choice during this unique stage in the life cycle. The nutritional importance of school-time food intake is assessed, as well as the role of school canteens. Health-directed school canteen initiatives since the mid-1980s are discussed and this review concludes with an analysis of the Western Australian School Canteen Associations STARCAP accreditation program. Eating Habits and Diseases of Affluence It is now well recognised that links exist between poor eating habits during both childhood and adolescence and the
development of dental decay, obesity and anaemia early in life (Ruxton, Kirk, Belton & Holmes, 1993; Douglas, 1999; johnson, 2000; Booth, Wake, Armstrong, Chey, Hesketh & Mathur, 17 2001) as well as a number of diseases of affluence including cardiovascular disease, diabetes and .some forms of cancer, later in life (Baranowski et al, 1993; Birch, 1993; NHMRC, 1995; Antine, 1997; Harris et al., 1997; Douglas, 1998; Melnik, Rhoades, Wales, Cowel & Wolfe, 1998; Cholin, 1999; Huon, Wardle & Szabo, 1999; Law, 2000; Livingstone & Robson, 2000). For example, cardiovascular disease is responsible for 41% of all deaths in Australia (Heart Foundation of Australia, 1999, p. 6) and poor diet has been recognised as a contributing factor (Ball, 1997a, p. 373) Diet has also been linked to the prevalence of Type II diabetes. According to Ball, approximately 3% of the Australian population is affected by diabetes, which then rises to between 10 to 15% of the population for
those over the age of 60 (1997b, p. 384). Similarly, a significant body ofliterature has focused on the relationship between diet and the prevalence of some forms of cancers. Huon, Wardle and Szabo maintain that "in developed countries 30% to 40% of cancers in men and up to 60% of cancers in women are attributable to diet" (1999, p. 156) To promote health, growth and development and to prevent the incidence of diseases of affluence, childhood and adolescence are life cycle stages that have been identified as important for dietary intervention (Baranowski et al, 1993; Douglas, 1998; Huon, Cholin, 1999; Wardle & Szabo, 1999). Many studies have investigated the nutrient intake of children and adolescents and findings have revealed they are often not meeting dietary recommendations. Instead, diets are generally characterised by higher than recommended intakes of fats (particularly saturated fat), sugar and sodium, and low vitamin, mineral and 18 fibre·intakes (Ruxton,
Kirk, Belton & Holmes, 1993; Gibbons, Wertheim, Paxton, Petrovich & S.zmukler, 1995; Church, 1997) Nutritional Concerns During Adolescence Adolescence has been defined as a period of "rapid physical growth, [with] large increases in hormone levels and the appearance of secondary sexual characteristics" (ODea, Abraham & Heard, 1996, p. 32) ODea (1995), NHMRC (1995), Seaman, Bower and Fleming (1997), and Neumark-Sztainer, Story, Perry and Casey (1999) have stated that it is a time when nutrient needs are higher than any other time in the life cycle except during pregnancy and lactation. Studies that have investigated the nutritional status of adolescent diets have indicated that in particular iron (Cobiac & Baghurst, 1993), calcium (Huon, Wardle & Szabo, 1999; Johnson, 2000) and fibre (Antine, 1997; Huon, Wardle & Szabo, 1999; Johnson, 2000) intakes are below the recommendations set out in the National Health and Medical Research Councils (1991)
Recommended Dietary Intakes. Therefore, each of these nutrients and their role in the adolescent diet is discussed. Dietary intake of iron is essential "to ensure the supply of oxygen to cells and tissues and for the production of energy" (Cobiac & Baghurst, 1993, p. S3) According to Jones (1997d, p. 252) common symptoms of iron deficiency 19 include anaemia and lethargy. Cobiac and Baghurst (1993) and ODea (1995) have agreed that a number of factors place a greater requirement for iron in the adolescent diet such as: rapid growth spurts, involvement in sport, dieting, vegetarianism and the commencement of menstruation. During adolescence, calcium is important for building maximal bone density and to reduce the risk of osteoporosis later in life. "Total peak bone ± 1.3 years [and therefore] mass . reaches 90 per cent of its peak by age 169 the opportunity to greatly influence bone mass acquisition must occur before late adolescence" (Weaver, 2000,
p. 515) Of concern is Huon, Wardle and Szabos (1999) findings from the 1995 National Nutrition Survey which revealed calcium intakes were less than the NHMRCs (1991) Recommended Dietary Intake for this nutrient for adolescent boys aged 12 to 15 years and females in most age groups. There is evidence concerning the protective effects of dietary fibre against diverticular disease and colon cancer (Jones, 1997c, p. 219) However, Antine (1997) has reported that fibre consumption reduces incrementally with age throughout adolescence due to the reduction in the consumption of fruits, vegetables and cereals. In support of Antines claim, Huon, Wardle and Szabo (1999) recorded a reduction in fruit consumption in a survey of the dietary intakes of 5,224 Australian schoolchildren aged between 10 and 15 years carried out in 1985. The findings revealed that only 561% of 12-year-old boys and 65.5% of i 1-year-old girls consumed any fruits on the day of the survey Mag;arey, Daniels and Smith (2001)
compared the 1985 data with the 1995 20 National Nutrition Survey for the same age group and concluded that 10 years on, fruit consumption for this age group had declined even more. Characteristics of Adolescence Adolescence is a unique stage in the life cycle when socio-cultural factors such as increasing independence, the media, sporting commitments, part-time employment and academic studies can affect food intake (Magarey & Boulton, 1995; NHMRC, 1995; Kennedy, 1996; Meyer & Conklin, 1998; Pirouznia, 2001). In addition, many adolescents experience pressure to conform to the slim body ideal and various studies have shown that adolescents, particularly girls, have a poor body image (ODea, 1995; Nowak, 1998; Nowak & Crawford, 1998; Story, Neumark-Sztainer, Sherwood, Stang & Murray; 1998; Sherwood & Neumark-Sztainer, 2001). Increasing independence was a contentious factor that emerged in the literature as influencing the food choices of adolescents (Owen,
Schickler & Davies, 1997; Douglas, 1998; Meyer, 2000). While Cholin argued that younger adolescents do not have much control over what and how food is presented to them, (1999, p. 104), Douglas claimed that as adolescents become increasingly independent with age, they have increased freedom to select whatever food they want during school-time and for snacks (1998, p. 14) 21 Peer pressure has been identified as another contentious factor that can affect adolescent food choice. While Magarey & Boulton asserted peer pressure to be "a strong determinant of food choice at this age" (1995, p. 132), Williams, et al. surveyed 2,082 Tasmanian high school students about their food perceptions and stated that peer influence did not play a particularly powerful role in food choice. They maintained that "techniques that enhance resistance to peer pressure do not need much emphasis in nutrition education for this age group" (1993, p. 161) ODea, Abraham & Heard
(1996) acknowledged that while weight gain is a normal part of adolescent development, many aspire to the slim ideal. Nowak and Crawfords (1998) inquiry into Queensland secondary school students concerns and views about food related issues revealed that weight control was the most important issue for girls, while for boys fitness was the most important concern. They attributed the gender difference to "the societal expectation of thinness in women and a muscular look in men" (1998, p. 6) Birch (1993), ODea (1995), Story, et al. (1998) and Sherwood & NeumarkSztainer (2001) identified potential hazards associated with adolescent dieting to include: lower nutrient and energy intakes due to food restriction practices~ higher levels of fatigue, use of laxatives, cigarette smoking and eating disorders. The proportion of the adolescent population engaged in weight control strategies, particularly restrictive food practices, has been the focus of many 22 studies with
much variance between reported results. Story et al (1998), stated that in the United States "approximately two-thirds of adolescent girls and about one-quarter of adolescent boys are actively attempting to control their weight" (1998, p. 1127) In Australia, Steinbeck (1995) estimated that approximately eighty percent of adolescents practice restrictive food behaviours while ODea, Abraham & Heard (1996) reported that dieting and other weight control practices have been undertaken by between 20 and 45 percent of the Australian adolescent population. Nutritional Importance of School-Time Food Intake Foods consumed during school-time provide a significant proportion of energy and nutrients to daily dietary intake. During the early 1990s, the nutrient profile of both school canteen and home-brought adolescent school-time food intakes were investigated in the United States and United Kingdom (Tilston, Neale, Gregson & Douglas, 1992; Worsfold & Griffith, 1992;
Ruxton et al., 1993). These inquiries revealed that the food items available from school canteens were mostly nutritionally imbalanced, with higher than recommended amounts of fats (especially saturated fat), protein, sodium and sugar and less than recommended amounts of iron, calcium and some vitamins. When comparing the nutritional quality of school meals served in the USA and UK with home-brought lunches, research findings are numerous but yield 23 inconsistent results (Tilson et al., 1992; Worsfold & Griffith, 1992; Bmja, Bordi & Lambert, 1996; Douglas, 1999). Tilson et al. compared the nutritional profile of canteen meals to home-brought lunches for one week at a school in the United Kingdom. They concluded that the average school meal contained 36 percent more energy than the average packed lunch and stated that students who consumed home-brought lunches may be receiving a diet deficient in energy. Similarly, when Borja, Bordi and Lambert summarised findings from
the US Department of Agricultures School Nutrition Dietary Assessment Study, they reported that students who ate school meals consumed significantly more energy from fat compared to students who brought their lunch from home (1996, p. 908) In some contrast to these investigations, Millers (1993) report regarding the nutrient profile of home-brought lunches concluded that while canteens are often cited as selling food and beverage items of poor nutritional quality, "surveys reveal that packed lunches .frequently contain foods and drinks of low nutritional value" (p. 12) However, when McBride investigated the effect of canteen menu on nutritional knowledge, attitudes and behaviour of Year 5 students in Western Australia, she argued that students who brought food from home appeared to eat more nutritious food and suggested that the promotion of nutritious home-prepared foods in schools may be beneficial (1992, p. 88) To improve the nutritional status of food available in
schools, the United Kingdoms Department of Health advised that school meals should contribute 24 one-third of students energy intake (Church, 1997). Presently, the one million free school meals served daily in the United Kingdom are obliged to comply with nutritional guidelines set out by the Caroline Walker Trust. In the United States, the Healthy Meals for Healthy Americans Act 1994 stated that the 25.7 million National School Lunch Program lunches served daily must provide one-third of the Recommended Dietary Allowance (RDA) for all nutrients (Chapman, Gordon & Bargharat, 1995; Bmja, Bordi & Lambert, 1996; Guthrie, 1996). In Australia, the National Health and Medical Research Council sets out Recommended Dietary Intakes (RDis) for total food intake, but there are not recommendations for school meals as national lunch programs are not a feature of the Australian school system. School Canteens in Australia The Federation of Canteens in Schools (FOCIS) which was
established in 1994 incorporates the national network of school canteen associations throughout Australia (Carter & Kellett, 1996). Carter and Kellett (1996) and Valentini, Walker and Riddell (1997) stated that school canteens collectively represent Australias largest take-away food outlet, with approximately 7,000 canteens catering to over one million students. Because school canteens are located within educational institutions, many believe they have a health-promoting role and should support health education mes~ages taught in schools (McBride & Browne, 1993; Kennedy, 1996; Story, 25 1996; Valentini, Walker & Riddell1997; Cholin, 1999; St. Leger & Nutbeam, 2000; Row ling & Rissel, 2000). Students are not usually permitted to leave the school grounds during school-time and, therefore, canteens are unique in that their customers usually have little or no choice about whether or not to utilise their service. This, coupled with Douglas (1998) and Valentini,
Walker and Riddells (1997) assertions that societal changes, such as the return of mothers to the workforce and reduced time available for meal preparation, has meant that adolescents tum increasingly to the school canteen as a source of food. In 1992, the Queensland Department of Education investigated issues related to adolescents and food and revealed that approximately seventy-five percent of parents and teachers believed school canteens should sell healthy food products (Kennedy, 1996). In support of this, McBrides inquiry into the effect of the school canteen on nutritional knowledge, attitudes and behaviour of Year 5 students revealed that nearly all of the students believed their canteen should sell healthy food (1992, p. 84) In response to the recognised nutritional implications of school-time food intake, there have been a number of initiatives aimed at promoting more healthful canteens in Australian schools (Victorian Dairy Industry Authority, 1978; The Australian
Nutrition Foundation Inc, 1985; National Heart Foundation (Western Australia Division), Foundation, 1995). 1993; Health Development Since the early 1990s, the Australian Nutrition Foundation in particular has been active in the promotion of healthful school canteen initiatives (Valentini, Walker & Riddell, 1997). 26 STARCAP Accreditation In Western Australia, the Western Australian School Canteen Association (WASCA) assists schools to adopt and maintain healthful canteens and healthy profits by targeting three groups: canteen managers and operators, health and education professionals, and the food industry (School canteens How can I be a catalyst for change? n.d) One of WASCAs strategies is the Star Accreditation Program (STARCAP), which was launched in mid-1996 in partnership with the Heart Foundation of Australia (WA Division) and the Nutrition Program of the Health Department of Western Australia. The STARCAP program awards schools that operate healthy canteens using
a star rating similar to that used in the hospitality and tourism industry. At July 2001, 98 schools in Western Australia were registered on the program (K. Dobson, personal communication, July 31, 2001). The STARCAP program is "committed to increasing the availability, promotion and sales of healthier food choices, consistent with the Australian Dietary Guidelines for Children and Adolescents in schools in Western Australia" (WASCA Inc, 2000, p. 2) In order to become accredited, school canteens must meet a number of criteria which include: a commitment to providing healthy foods for sale; the promotion of school and community involvement; and the practice of safe food handling. The STARCAP program asserts that it is different from other health-directed canteen initiatives because school canteens 27 must produce sales records as evidence of the percentage of takings from sales of recommended and registered food and beverage items. The STARCAP program consists ofthree
levels of accreditation: three-star, fourstar and five-star. Canteens that achieve accreditation are rewarded with food service equipment vouchers to the value of $150, $250 and $450 respectively. In addition, the STARCAP program includes incentives such as public recognition for the canteen manager and school, as well as a framed certificate. Most importantly, the program provides assurance to parents and students that their school canteen "is a model of best practice in all areas of food service" (WASCA Inc, 2000, p. 6) Summary There are a number ofkey issues that arose from the review of the literature. It is now well established that the occurrence of diseases of affluence are linked with poor eating habits established during childhood and adolescence. These diseases can be prevented, in some cases, and one prevention strategy is to adopt healthy eating habits from a young age. However, many studies that have investigated childhood and adolescent nutrient profiles have
reported that generally they are not meeting current intake recommendations. Adolescence has been identified as a umque stage in the life cycle when incr~ased nutrients are required for rapid growth and development. However, 28 it is also a time when a number of factors may adversely influence dietary behaviour such as: increasing independence, the media and preoccupation with body image and pressure to conform to slim body ideals. Foods consumed during school-time provide a significant proportion of nutrients and energy to daily dietary intake and because school canteens are located within educational institutions, many believe they have a healthpromoting role and should support health education messages taught in schools. In response to the recognised nutritional implications of school-time food intake, there have been a number of initiatives aimed at promoting more healthful canteens in Australian schools. In Western Australia, the Star Accreditation Program (STARCAP) was
launched in 1996 with the aim to "increase the availability, promotion and sales of healthier food choices . in schools in Western Australia" (Western Australian School Canteen Association, 2000, p. 2) To date, it seems that no nutrient intake analysis has been conducted to assess whether the STARCAP program is better meeting the nutritional needs of students compared to REGULAR canteens. Further, there are no identified local studies which address the research questions of this study. 29 Research Questions Are there any nutritional differences between the school-time eating profiles of Year 8 students who consume foods from STARCAP registered canteens and REGULAR canteens? 1. What food items are offered for sale at the two STARCAP canteens and the two REGULAR canteens? 2. What is the proportion of Year 8 students who consume canteen-derived food items compared to the proportion of Year 8 students who consume home-brought foods? 3. What are the comparative
nutrient profiles of students school-time food and beverage intakes from the two STARCAP canteens and the two REGULAR canteens? 4. What are the comparative nutrient profiles of the Year 8 students schooltime food and beverage intakes from the two STARCAP canteens and the two REGULAR canteens in relation to the National Health and Medical Research Councils (1991) Recommended Dietary Intakes and the Goals and Targets for Australias Health in the Year 2000 and Beyond (1993)? 30 CHAPTER3 Materials and Methods This chapter begins with an explanation about the canteen selection process and the sample groups who participated in this study. The research design is explained and the development of the food recall instrument that was used to collect data is presented and explained. The data collection procedure is discussed, as well as how the data were analysed. Limitations have been considered and are provided at the end of this chapter. Research Design The design for this study
was base~ on four stages that are common in any dietary assessment procedure as outlined by Gibson (1993, p. 1) Accordingly, dietary assessment for this study included: measuring food consumption, assessing nutrient contributions of foods consumed, assessing absorbed intakes and evaluating nutrient intakes in relation to the National Health and Medical Councils (1991) Recommended Dietary Intakes (RDis) and the Goals and Targets for Australias Health in the Year 2000 and Beyond (1993). The 24-hour recall method was selected for collection of data but this method was slightly modified in that participants were only required to recall foods 31 consumed on the school site for one day until the end of lunchtime, which was a 5-hour period of time. However, this time period varied slightly from school to school due to differing timetables but according to Young ( 1993 ), concentrating on a shorter time than 24-hours should produce more accurate responses from participants (p. 6) The
24-hour recall method was considered the most appropriate for this study for a number of reasons. It is less intrusive than other methods and according to Livingstone & Robson, is "more likely to be acceptable to adolescents" (2000, p. 289) This method was also suitable due to its "high compliance, low cost, ease and speed of use . [and its] element of surprise so that the respondent is less likely to modify his or her eating habits" (Gibson, 1993, p. 5). Finally, the food recall method was ideal for this study because "food recall data can be used to characterise the mean food intake of groups" (Gibson, 1993, p. 5) The focus of this study was on two groups of Year 8 students: one group with STARCAP registered canteens and one group with REGULAR canteens. Once consent was obtained from school Principals and students, data were collected in class groups at the commencement of lessons immediately after lunch (where practicable). The researcher
modelled how to complete the recall instrument using food models as visual aids and by thinking aloud the cognitive processes involved in this exercise. Students were then asked to recall and list their own school-time food intake on an instrument that was developed for this study. 32 Once data were collected, mean nutrient intakes of canteen-derived food and beverage consumption were obtained for both STARCAP and REGULAR groups of participants using the computer-based nutrient analysis software package SERVE Nutrition Management System version 3.99 for Microsoft™ Windows®. These intakes were then compared to the National Health and Medical Councils (1991) Recommended Dietary Intakes and the Goals and Targets for Australias Health in the Year 2000 and Beyond (1993). Sample Selection The selection of high schools for this study was criterion-based, depending on whether they had canteens that were registered on the STARCAP program or not. Four co-educational government high
schools in the Perth metropolitan area were selected to participate in this study: two schools had canteens that were registered in the STARCAP program (S 1 and S2), and two high schools had REGULAR canteens (S 3 and S4). The participants are what Huck and Cormer (1996) refer to as convenience samples because they were selected to participate on the basis of availability (p. 109) Year 8 students were chosen to participate in this study because according to Piagets theory of cognitive development cited in Woolfolk (1998), at this age most students are operating in the formal-operational stage which is characterised by the capability to perform "mental tasks involving abstract thin~ing and coordination of a number of variables" (p. 37) The ability to 33 retrieve information from memory as accurately as possible and to estimate accurate amounts of f-oods consumed in terms of quantities were essential to the validity of the food recall method which was used for this
study. Students in attendance during two Year 8 Horne Economics classes from each of the four schools were invited to participate after obtaining written permission from each schools Principal (see Appendix A for copy of permission letter to Principals). Accordingly, this study was undertaken with n=64 students from the two schools with STARCAP canteens and n=65 students from the two schools with REGULAR canteens (total students n=129). Fiftynine percent of the students were female and 41% of the students were male The sample population by canteen type, gender and mean age is shown in Table 1. Table 1. Sample population by canteen, gender and mean age Females STARCAP: REGULAR: Males n x age n x age Total N 51 20 13.6 14 13.4 34 52 17 13.7 13 13.5 30 18 13.2 11 13.2 29 21 13.3 15 13.4 36 Total 129 Home Economics/Health & Physical Education are curriculum contributors to nutrition education within Western Australian high schools and are compulsory
34 subjects for Year 8 students. Beyond this level, student subject selections would cause distinct -inter-student differences, hence Year 8 students were selected for this study. Access for data collection was preferred through Home Economics classes as these provide smaller groups which facilitated rigorous and precise food record collection. During the canteen selection process, other variables that affect food choice were taken into account. For example, socio-economic status was considered to ensure, as far as practicable, that students had the same access to financial resources to spend at the canteen. The Australian Bureau of Statistics Census of Population and Housing (1996) data were used to determine the socioeconomic status of each school location according to statistical local area and are expressed in terms of weekly median household income in Table 2. Table 2. Weekly median household income ($AUS) of participating schools REGULAR: STARCAP: 51 Total 53 54
Total $499 $1166 $513 $686 $1199 Instruments and Equipment A food recall instrument was developed to collect food intake data for this study (see Appendix B for copy of data collection instrument). Prior to data coll~ction, the instrument was assessed by a high school nutrition educator who 35 has over 20 years experience teaching Year 8 level students. On the basis of feedback from this assessment, the instrument was modified slightly to ensure its design was age-sensitive and compatible with the cognitive ability of Year 8 students. The instrument required students to provide their gender and date of birth, as well as listing all food and beverage items consumed on the school site until the end of lunchtime on the day of data collection. The field where students listed their food intake was divided into three sectional rows (Before School Started, Morning Recess and Lunch) to account for the characteristic dietary patterns of adolescents which include "frequent
snacking . grazing and meal skipping" (Livingstone & Robson, 2000, p. 289) This field was also divided into three columns (Name of Food or Drink, Amount of Food or Drink and Where Did the Food or Drink Come From: C=Canteen/H=Home) so that along with listing all items consumed, students were also required to provide information regarding quantities and sources of food and beverage items consumed. The computer-based nutrient analysis program SERVE Nutrition Management System version 3.99 for Microsoft™ Windows® was used to analyse the nutrient levels of food items. This program makes use of two food composition databases: AUSNUT and NUTTAB95. The AUSNUT database has been developed by the Australia New Zealand Food Authority and contains nutrient composition information for approximately 5,000 foods. The 36 NUTTAB95 database contains nutrition composition for approximately 1,800 foods and nutrients. Data Collection Procedure Data were collected by the researcher
with some guided assistance from classroom teachers. Students perceived the exercise as an important class activity and gave their full co-operation. While collecting data for this study, quality control procedures were used to ensure that both random and systematic influences were minimised. For example, a standard discourse was used for collecting data (see Appendix C for copy of data collection procedure) and students were not informed about the study prior to data collection. According to Chambers, Godwin & Vecchio, this would have minimised the risk of students altering their normal food patterns (2000, p. 308) After students were invited to participate in this study and were told they would be required to complete a food recall sheet each, consent forms were duly signed (see Appendix D for copy of student consent form). A written example school-time food intake was displayed on the blackboard by the researcher, accompanied by a range of food models which served as
visual aids to assist with minimising errors associated with portion sizes. Because this study was concerned primarily with canteen-derived food and beverage 37 consumption, the models used were food items that were actually available for sale from the school canteens. This is in accordance with Chambers, Goodwin & Vecchios inquiry into preferred aids for food recalls in which they stated that participants prefer aids that are similar in size and shape to actual portions consumed (2000, p. 891) Blank food recall sheets were distributed to each participant and the process of completing a food recall sheet was modelled to demonstrate how to list food items and record related information about each item. During the modelling demonstration, the researcher thought aloud the cognitive processes involved in recalling information and referred to the food models as a guide to estimate portion sizes. For example, "I ate half of my friends banana at recess time which was this size
[holding up model banana for class to view]. I think this is a medium-sized banana and my friend brought it from home". Once the demonstration was completed, students were invited to ask questions, which were answered by the researcher. Students were then instructed to think carefully about what food and beverage items they consumed on the school site for that day before completing their recall sheets. While students completed this exercise, the researcher and classroom teacher monitored and assisted students. As food recall sheets were completed, clarification by the researcher with each student regarding portion size, quantity and source of listed food items was 38 determined using the multiple pass method which Brady, Lindquist, Herd & Goran (2000, p. 363) describe as follows: Pass 1: Participants recorded and listed everything they consumed on the school site up until the end of lunch on the day of data collection. Pass 2: A more detailed description of listed
items was elicited by the researcher and/or classroom teacher, such as confirmation of brand names and portion sizes. Pass 3: All food and beverage items were further clarified by the researcher with the aid of the example lunch to assist memory recall and confirm quantities and measures of listed items. The multiple pass process took approximately 40 minutes to complete for each of the four sub-groups who participated in this study. This process was deemed necessary to ensure that the accuracy of each students recalled dietary consumption was maximised. For six of the eight classes who participated in this study, data collection took place at the commencement of lessons immediately after lunch which would have helped to promote valid responses from participants. Domel-Baxter, Thompson, Davis and Johnson (1997) investigated the accuracy of selfreporting of school lunch intake by 10-year-old children and found that same day reporting yielded 84% accuracy. For the other two
classes, data collection 39 was carried out at the commencement of lessons the following morning. This was the best practicable time for those two sites. Data Analysis To answer each research question, data were processed in different ways. For Research Question 1 - to determine what food and beverage items were offered for sale at the two STARCAP canteens and the two REGULAR canteens - menus from each canteen were obtained and food and beverage items offered for sale are presented according to food categories in the Results chapter. For Research Question 2 - to determine the proportions of students who purchased foods from the two STARCAP canteens, the two REGULAR canteens and brought foods from home - recall sheets that listed food and/or beverage items purchased from the canteen were coded C for Canteen and food recall sheets that listed no canteen purchases coded H for Home. A table illustrating the percentages of students consuming food and beverage items from each
canteen, from home or who recalled consuming no food during school-time is included in the Results chapter. In order to answer Research Questions 3 and 4 - to determine the comparative nutrient profiles of students school-time food and beverage intake from each canteen and to compare mean nutrient intakes to the National Health and Medicql Research Councils (1991) Recommended Dietary Intakes and the 40 Goals and Targets for Australias Health in the Year 2000 and Beyond- recall sheets were coded aceording to canteen type and gender. It should be noted that four students intakes were not included for analysis because their canteen purchases were considered insignificant. The items recalled by each student were: 1 x potato wedge, 1 x gulp of coke, 1 x 5g hard candy, and 1 x 3g hard candy. There were four sub-groups for the purpose of data analysis as described in Table 3. Table 3. Sample for data analysis by canteen type, gender and mean age Females n STARCAP: REGULAR: -
Males x age n - x age Total n 51 10 13.4 10 13.5 20 52 8 13.8 6 13.8 14 11 13.4 6 13.1 17 12 13.4 9 13.5 21 Total 72 Of the 72 students who recalled consuming foods from the canteen, it should be noted that for 49 of these students (69%), canteen-derived food did not total 100% oftheir school-time food intake. In addition to recalling canteen-derived foods, these students also recalled consuming foods brought from home. 41 It is generally expected that the foods consumed at school should supply one- third of daily nutrient·requirements. For the majority of students in this study however, food sourced from the canteen did not account for 100% of schooltime food intake and was instead comprised of a combination of both canteen and home-brought foods. Therefore, it would be unreasonable to expect canteen food alone to contribute one-third to daily nutrient intake. Because one main aim of this study was to compare canteen-derived food consumption
with the RDis and Targets, it was necessary to ascertain the proportion of canteen and home-brought foods to total school-time intake to determine a benchmark percentage for how much canteen food could be expected to contribute to daily nutrient requirements. Accordingly, the total gram weight of both canteen and home-brought foods was calculated. As Figure 1 illustrates, canteen-derived foods accounted for 75% of total schooltime food intake for the students in this study and could therefore be proportionately expected to supply approximately 23% of daily nutrient requirements. • Home Food 75% Figure 1. Total gram weight and percentage contribution of canteen-derived and homebrought foods to total school-time food intake 42 Although all food and beverage items consumed on the school-site until the end of lunch were re.called, only canteen-derived foods were coded for data entry. A number of studies have analysed home-brought school-time food consumption (Tilston, Neale,
Gregson & Douglas, 1992; Douglas, 1999; Hughes & Clifford, 2000). These studies involved teams of recorders who collected and recorded precise information regarding portion sizes, types and quantities of home-brought foods prior to consumption. For this study, a nutrient analysis for home-brought foods was not completed as the aims of this study focused on canteen foods. The computer-based nutrient analysis program SERVE Nutrition Management System version 3.99 for Microsoft™ Windows® was used to perform the analysis. Each students canteen-derived food consumption was entered into SERVE to determine individual nutrient profiles. SERVE includes a function whereby intakes can be combined and once individual analysis was completed, the combining of intakes was determined depending on each students canteen type and gender to arrive at a nutrie<nt intake for each of the four-sub groups. The combined intakes were then divided by the number of students in each sub-group to
determine a mean nutrient intake for each canteen and gender. When creating intakes, SERVE requires information regarding age, height, weight and activity level because these are factors that influence an individuals nutrient requirements. Information regarding each participants height and weight were not collected so mean height by age and mean weight 43 by age data from the National Nutrition Survey (1995) Selected Highlights were used for this purpose. As mentioned earlier, SERVE makes use of two food composition databases: AUSNUT and NUTTAB95 which contain nutrition composition information for approximately 5,000 and 1,800 foods and nutrients respectively. However, there were a number of food items recalled by participants which are not specified identically in either of these databases. For example, food items that were prepared by canteen staff needed to be entered manually. In this instance, SERVE has the facility for new food items to be created and added to its
database. To create new food items, weights and measures for each ingredient contained in each food item had to be entered after consulting with canteen staff regarding ingredient and preparation methods. In addition, there were food items that are produced by manufacturers specifically for industries such as school canteens and which are not available for retail sale. Again, these items were not contained in either SERVE database and needed to be entered manually. An example is OK Yo ice confection and the manufacturer was consulted to ascertain ingredient and nutrient information for this product. Once sub-group mean intakes for selected nutrients were ascertained, independent samples t-tests compared STARCAP and REGULAR canteen female and male intakes. Mean nutrient intakes were then compared with the National Hea~thand Medical Research Councils (1991) Recommended Dietary Intakes 44 for boys and girls aged 12-15 years and the Goals and Targets for Australias Health in the
Year 2000 and Beyond (1993). Limitations While every care was taken to ensure that the participants selected for this study were representative of the corresponding population, it should be noted that convenience sampling may contain bias. The food-recall method is short-term in its focus. It is recognised that a single days school-time food intake may not be representative of usual nutrient intake or eating patterns. Sodium was not included for analysis in this study because the AUSNUT database does not provide information regarding the sodium content of foods. The National Health and Medical Research Councils (1991) Recommended Dietary Iritakes are expressed as mean recommendations and are intended as a guideline when assessing nutrient intake over a reasonable period of time. They have been calculated to allow for factors such as variation in absorption and metabolism and are based on estimates of nutrient requirements depending on factors such as age and sex, with a generous
safety factor added. It should be noted that the RDis "exceed the actual nutrient requirements of practically 45 all healthy persons and are not synonymous with individual nutrient requirements" (NHMRC, 1991, p. v) 46 CHAPTER4 Results Introduction In order to address each research question, this chapter is divided into four sections, beginning with an explanation of what was offered for sale at each canteen. This is followed by an evaluation of who purchased items from each canteen. A comparison of each group of students mean intakes for selected nutrients is then presented and compared to the National Health and Medical Research Councils (1991) Recommended Dietary Intakes (RDis) and the Goals and Targets for Australias Health in the Year 2000 and Beyond (1993). School Canteen Menus- What Do They Offer? Food and beverage items which were offered for sale at each canteen that participated in this study are presented according to food categories in Table 4. 47
Table 4. Food items offered for sale at the two STARCAP canteens and the two REGULAR canteens STARCAP: Sandwiches/Rolls: Chicken, Ham, Beef, Cheese, Egg, Salad, Vegem Peanut Butter Extras: Salad, Beetroot, Pineapple, Mustard, Pickles, Mayonnaise, Chilli Sauce Buttered/Plain Rolls Toasted Sandwiches Sausage Rolls Hot Chicken Rolls Vegetable Burgers Hot Chicken & Corn* Hot Snagger Buns* Hot Pizza Singles* Hot Snack Size Pies* Sandwiches/Rolls Sandwiches/Rolls/Pitta Bread HYrrbre, White or Wholemeal: Ham, Chicken, Cheese, Beef, Egg, Tuna, Salad- plus salad optional Toasted Sandwiches Hot Savouries Chiko Roll Cheesies Pizza Singles/Pizza Cheesies Hot Hawaiian Roll Hot Meals Lasagne Spaghetti Bolognaise Hot Soup of the Day Spaghetti Bolognaise Salads/Fresh Fruit Salad Box Fresh Fruit Fresh Fruit Salad Tubs Fresh Fruit Cakes/Pastries Muffins Ice Confection/Dairy Yoga Yoghurt Ice Creams* Frozen Yo hurt* Limited range of confectionery Paris Buns* Cinnamon Buns* Assorted
Cakes (Fridays only) Yoga Ice Creams* Confectionery Beverages Daily Specials Limited range of confectionery Flavoured Mineral Water Plain Milk (300m!) Flavoured Milk (300m! and 600ml) Choc/BananafCheny/Coffee Fruit Juice (250m! and 500ml) Spring Water (600ml) Flavoured Milk (300m! and 600ml) Fruit Juices (Small and Large) Water 100% Apple Juice 100% Orange Juice Monday: Tuesday: Wednesday: Thursday: Monday: Friday: Open Sandwich Toasted Steak Sandwich Quiche & Salad Leg Ham, Lettuce, Avocado & Sundried Tomatoes Bacon, Lettuce, Tomato & Avocado Roll Tuesday: Wednesday: Thursday: Friday: Pies/Potato Pies PastiesNegetable Pies Chicken Burger Beef & Gravy Roll Hamburger Deep Sea Burger REGULAR: Sandwiches - Multigrain - no butter Rolls - White/Wholemeal- no butter Pittas - White with Sour Cream Ham, Chicken, Cheese, Egg, Tuna, Pineapple, Salad, Vegemite, Peanut Butter, Cottage Cheese, Mustard, Mayonnaise, Pickles, Chutney, Cream Cheese, Pumpkin Seeds,
Walnuts, Sprouts, Celery Toasted Sandwiches Pizza Chicken Drummies Cheezies Pies Sausage Rolls Vegetarian Pies Vegetarian Sausage Rolls Hamburgers HotDogs Bacon & Egg Burgers BLT Burgers Vege Burgers Chicken Burgers Corn Cobettes Spring Rolls (mini) Spicy Chicken Wings/Sweet Chilli Chicken Tender Croissants- Ham, Cheese, Tomato & Chicken Smokeys Bruschetta Chicken Kebab Hot Garlic or Herb Bread Chicken and Mayo Hot Rolls Quiche Stuffed Potatoes Baked Potatoes with Sour Cream Hot Soup (winter only) Hot Pasta & PotatoNegetable dishes. Fruit Trays Fresh Fruit Salad Fresh Salad (eg, pasta, potato, rice etc) Garden Salad Fresh Fruit Assorted Cakes, Muffins, Iced Buns & Biscuits Yoghurts Ice Creams•• Ice Blocks•• Sandwiches/Rolls Cheese, Ham, Egg, Tuna, Chicken, Salad, Vegemite, Peanut Paste Buttered Rolls Toasted Sandwiches Chico Roll Cornjack Chicken & Corn Roll Sausage Rolls Cheese & Bacon Sausage Rolls Hash Browns Onion Rings Cheesies Cheese
Croissants/Ham Wedges Pies Fish Burger Chicken Burger Hamburger Steak Sandwich HotDog Hot Dog with Cheese Sausage & Onion Roll Roast Beef Roll Roundas Pizzas Bruschetta Chicken Nuggets Noodles Nachos Spaghetti Lasagne Fettuccine Carbonara Bangers & Mash Beef Stroganoff BeefTeriyaki Chicken Risotto Fresh Fruit Fresh Fruit Salad Garden Salad Assorted Cakes Danishes Assorted Ice Creams and Ice Confections Assorted confectionery- includes chocolate novelty bars etc Assorted confectionery- includes chocolate novelty bars etc Milk Flavoured Milk Daily 100% Juice Berri Fruit Boxes Berri Flavoured Mineral Water Orange C (250m! and 500ml) Tea Coffee Milo Assorted specials -changes regularly Assorted beverages- changes regularly, including soft drinks, fruit juices, flavoured/plain milk, water Assorted specials- changes regularly * Available Recess Only * Avail able Lunch Only The similarities and differences between canteen menus are summarised as follows: Sandwiches/Rolls
For the Sandwiches/Rolls category, all four canteens offered similar choices of breads and fillings. STARCAP There were two main differences worth noting: one canteen (S 1) offered Hyfibre white bread as an option for sandwiches and one REGULAR canteen (S 3) offered multi-grain bread as an option for sandwiches. This REGULAR canteen also used no spread (butter or margarine) in the preparation of their sandwiches or rolls. Hot Savouries In the Hot Savouries category, REGULAR canteens offered approximately four times more items for sale (n=45) thah STARCAP canteens (n=ll). The foods in this category are generally high in fat, especially saturated fat, and foods consumed from this category contributed 5.5g or 63% of total saturated fat intake for REGULAR students. STARCAP students consumed slightly more saturated fat from foods in this category at 5. 7g, however saturated fat resulting from the consumption of hot savoury items contributed less to their total intake of saturated
fat at 51%. 49 Hot Meals For the Hot Meals category, REGULAR canteens again offered for sale a great many more items (n=14) than STARCAP canteens (n=4). These foods were not major purchases with the students in this study; only two students from REGULAR canteens recalled consuming items from this category (spaghetti bolognaise and a baked potato), while STARCAP students consumed no Hot Meal items. Salads/Fresh Fruit Each canteen offered a range of items for sale in the Salads/Fresh Fruit category, with REGULAR canteens offering twice as many items (n=8) as STARCAP canteens (n=4). No students in this study recalled consuming any items from this category. This is of concern because these items are generally low in fat (if not accompanied with high-fat dressings) and are excellent sources of vitamins, minerals and dietary fibre which are essential for growth, maintaining health and to protect against disease (Jones, 1997c, p. 215) Cakes/Pastries In the Cakes/Pastries
category, REGULAR canteens offered for sale a wide range of commercially prepared items, while STARCAP canteens offered only a 50 few choices. One STARCAP canteen (S 2 ) did include an assortment of cakes on their menu, but limited the sale of these items to Fridays. This canteen also offered Paris buns and cinnamon buns for sale every day, but these items were only available at recess. Despite the STARCAP canteens restrictions on the sale of cake and pastry items, more STARCAP students (17%) recorded consuming items from this category than REGULAR students (12%). Ice Confection/Dairy All canteens included on their menus a range of ice cream and frozen confection products in the Ice Confection/Dairy category. The sale of ice confection products was restricted to lunchtime in all but one REGULAR canteen (S 4). These items proved very popular with STARCAP students, who consumed 34.43mg or 14% of their total calcium intake from the consumption of these products compared to
REGULAR students who consumed only 5.67mg or 4% of their total calcium intake from ice confection products purchased from the canteen. In addition, one STARCAP canteen (S 1) and one REGULAR canteen (S 3) also offered yoghurts for sale and both STARCAP canteens included a dairy food product (Yo Go) on their menus. No student in this study recalled consuming a yoghurt or dairy food item from the canteen. 51 Confectionery In the Confectionery category, REGULAR canteens offered a wide selection of items including chocolate novelty bars, boiled lollies and jelly-type sweets while one STARCAP canteen (S 2 ) offered three confectionery items for sale and the other STARCAP canteen (S 1) did not include any confectionery items on its menu. Consequently, REGULAR students consumed a great deal more sugar than STARCAP students from the Confectionery category, obtaining 10.32g or 16.4% of total sugar intake from the consumption of canteen-derived confectionery items compared to STARCAP
students, who consumed 3.54g or 0.04% oftotal sugar from this category Beverages All canteens offered a range of beverages for sale including flavoured milks, water, fruit drinks and fruit juice.· In addition, one REGULAR canteen (S 3) included hot drinks on their menu while the other REGULAR canteen (S 4) included a range of carbonated soft drink beverages in various serve sizes and flavours. Consequently, the consumption of soft drinks purchased from the canteen accounted for 20. 78g or 47% of total sugar intake for REGULAR students. 52 Daily Specials All canteens featured Daily Specials on their menus. STARCAP canteens offered a range of specials for each weekday and REGULAR canteens offered promotional specials usually comprising of meal deals, eg, Mrs Macs Giant Sausage Roll and 600ml Coke. No students in this study recalled consuming any items from this category. Who Purchased Items from the Canteen? More REGULAR students (64%) purchased food items from the canteen
than STARCAP students (53%). The gender, number and percentage of students who purchased items from the canteen are compared to students who made no canteen purchases or recalled consuming no food items during school-time in Table 5. Table 5. Gender, number and percentage of students who purchased items from each canteen or consumed no food or beverage items. STARCAP: REGULAR: n female n male Total n % n female n male Total n % Canteen Purchases 18 16 34 53 26 16 42 64 No Canteen Purchases 18 10 28 44 11 9 20 31 2 3 2 1 3 5 No Food Intake 53 Canteen Food as a Source of Nutrients - How Does Each Canteen Compare? For both canteen types, independent samples t tests compared Female and Male mean nutrient intakes. Table 6 shows that for Females, there was a significant difference for canteen-derived calcium intake. Table 6. Mean nutrient intakes for female students 5TARCAP n =18 REGULAR n =23 x ±50 x ±so t p Protein (g) 14.2 ± 10.9
9.4 ± 10.6 1.421 NS Carbohydrate (g) 58.0 ± 36.3 65.3 ± 44.9 2.337 NS Monounsaturated Fat (g) 6.8 ± 7.2 4.4 ± 4.8 1.252 NS Polyunsaturated Fat (g) 1.6 ± 2.1 1.8 ± 2.0 -.356 NS Saturated Fat (g) 10.9 ± 9.8 6.4 ± 8.2 1.621 NS Total Fat (g) 29.0 ± 18.8 13.6 ± 14.3 1.410 NS 1736.1 ±12098 .575 NS Energy (kJ) Fibre (g) Folate (ug) Calcium (mg) Iron (mg) * 1966.4 ±13477 1.7 ± 25.6 ± 2.1 1.8 ± 1.9 -.151 NS 16.3 19.5 ± 20.2 1.040 NS 118.6 ± 1532 2.192 p<.05 1.2 .245 274.7 ± 2701 1.1 ± 1.2 1.0 ± NS Equal variances were not assumed in this t-test For male students, Table 7 shows that there were no statistically significant differences between mean intakes at the two types of canteens for any of the nutrients analysed in this study. 54 Table 7. Mean nutrient intakes for male students 5TARCAP n =16 REGULAR n =15 x ± SD x±SD t p Protein (g) 15.5 ± 19.4 19.4 ± 14.7 -.626 NS Carbohydrate
(g) 61.4 ± 52.1 90.6 ± 66.8 -1.361 NS Monounsaturated Fat (g) 7.5 ± 9.8 8.9 ± 7.7 -.461 NS Polyunsaturated Fat (g) 1.8 ± 2.7 4.1 ± 5.6 -1.451 NS Saturated Fat (g) 11.5 ± 14.7 11.1 ± 10.8 .099 NS Total Fat (g) 22.9 ± 28.2 25.9 ± 21.1 -.327 NS 2790.1 ±18955 -.913 NS Energy (kJ) Fibre (g) Folate (ug) Calcium (mg) Iron (mg) * 2121.1 ±21654 2.1 ± 2.1 4.4 ± 5.1 -1.666 NS 28.0 ± 25.7 44.7 ± 53.3 -1.128 NS 136.9 ± 1540 1.244 NS 1.4 -1.742 NS 257.5 ± 3535 1.1 ± 1.2 2.0 ± Equal variances were not assumed in this t-test The variability of intakes illustrated in Tables 6 and 7 is due to a number of reasons. Firstly, there were differences between the food items each canteen offered for sale from which students could select. Secondly, this study had a small sample size which would have increased variability, and thirdly, what students consumed was, typically, highly variable between individuals. To demonstrate the
extent of this variability, the following two recalls are presented in Table 8. 55 Table 8. Example food recalls from REGULAR canteen Student: ID/1 0 Name of food or drink: Before School Started: Croissant (medium) Student: ID/31 Amount of food or drink: Canteen/ Home Name of food or drink: Amount of food or drink: Canteen/ Home Before School Started: 1 c Morning Recess: Morning Recess: Piece of Pizza (medium) 1 Chicken and Corn Roll 1 Sun Fruit Lollies 55g Lunch: Giant Sausage Roll 1 1 Sauce Portion 1 Sprite Lemonade 600ml 1 c c c c c c Lunch: Bucket Potato Wedges 1 Pineapple Juice Box 1 c c The nutrient analysis of canteen food intakes revealed that all sub-groups in this study obtained over one-third of the recommendation that carbohydrates contribute at least 55% to total energy intake. For the remainder of the nutrients analysed in this study however, all sub-groups fell short of meeting one-third of the dietary recommendations, with the exception
of REGULAR Male students who obtained 38% of the RDI for protein from canteen food consumption. Table 9 illustrates the percentage of RDis and National Targets obtained from canteen food consumption for each sub-group. 56 Table 9. Percentages of RDis and National Targets obtained from canteen food consumption for each sub-group STARCAP REGULAR Females Males Females Males Protein 29 30 19 38 Carbohydrates 49 48 62 53 Total Fat 37 37 27 33 Energy (kJ) 21 18 18 24 Fibre 6 7 6 15 Folate 13 10 14 24 Calcium 27 21 12 11 Iron 9 10 9 17 Overall, REGULAR Males obtained the highest percentage contributions to dietary recommendations from canteen-derived foods for each nutrient except calcium. This indicates that the canteen-derived foods consumed by this subgroup best assisted their nutritional needs It must be remembered that for the students in this study, canteen food consumption accounted for 75% of total school-time food intake, with 25%
being derived from foods brought from home. Therefore, the benchmark percentage that canteen foods could be expected to contribute to the RDis and Targets for the nutrients analysed in this study is approximately 23%. 57 Nutrient Intakes- How Do They Measure Up to the RDis and National Targets? Mean nutrient intakes resulting from canteen-derived food consumption are presented in this section, along with the main food items that contributed to each nutrient. Macronutrients Protein All students, except REGULAR Female canteen users, approached one-third of the RDI for this age group for protein (44-55g F and 42-60g M) as shown in Figure 2. REGULAR Males exceeded one-third of the RDI at 198g (38%) 60 r-------------~----------------------. 100% 80% 40 60% 40% 20 20% 0 0% Starcap Regular Regular Starcap Females Males llllllg 14.2 9.4 15.5 19.4 -+-% ofRDI 29% 19% 30% 38% Figure 2. Mean canteen-derived protein intake and % of RDI 58 The foods that made a
substantial contribution to protein were generally high in fat, such as beef pies ·and sausage rolls. For example, for STARCAP Females and Males, pies and sausage rolls together contributed 5.2g (367%) and 41g (27.3%) respectively to protein intake, while for REGULAR Males, these two foods contributed 8.01g (404%) to this nutrient Other good sources of protein, such as cereals, pulses, nuts and vegetables were consumed in small amounts by few students in this study, eg bread for sandwiches and rolls or salad in a hamburger. Carbohydrates Figure 3 shows that all students came close to meeting the Target recommendation that 55% of total energy be derived from carbohydrates (Wahlqvist & Kouris-Blazos, 1997, p. 510) REGULAR Females exceeded this recommendation, obtaining 62% of total energy from canteen-derived carbohydrate consumption. 400.0 - - - - - - - - - - - - - - - - - - - - - - - 100% 300.0 80% 60% 200.0 40% 100.0 0.0 20% Starcap Regular Starcap 0% Males
Females --+--- % of Target Regular 58.0 65.3 61.4 90.6 49% 62% 48% 53% Figure 3. Mean canteen-derived carbohydrate intake and% of Target set for carbohydrate as a proportion of total energy 59 For STARCAP Female and Male students, ice confection products and flavoured milk beverages combined contributed 24.1g (420%) and 232g (377%) respectively to carbohydrate intake, while for REGULAR Female and Male students, soft drinks accounted for 20.4g (317%) and 212g (240%) respectively to the intake of this nutrient. Total Fat Figure 4 shows that all sub-groups exceeded the upper limit of 30% set for the contribution of fat to total energy (Wahlqvist & Kouris-Blazos, 1997, p. 510), except REGULAR Female students, who obtained 27% of total energy from canteen-derived fat consumption. 100.--------------------------------------100% 80 80% 60 60% 40 40% 20 20% 0 0% Females Males lllllllg 20.9 13.6 22.9 25.9 -+- % of Target 37% 27% 37% 33% Figure 4. Mean
canteen-derived total fat intake and% of Target set for total fat as a proportion of total energy 60 For STARCAP Female and Male students, sausage rolls were the single food item that contributed most to total fat intake at 8.9g (414%) and 108g (473%) respectively. Similarly, for REGULAR Male students, sausage rolls accounted for 7.9g (295%) of total fat intake while for REGULAR Female students, commercially prepared cakes were the single food item that contributed most to this nutrient at 2.8g (209%) It is recommended that not more than 10% of total energy be derived from saturated fat (Wahlqvist & Kouris-Blazos, 1997), however for STARCAP Female and Male students, the percentage of saturated fat to total energy intake was twice that recommended at 21.2% and 208% respectively REGULAR students proportion of total energy derived from saturated fat was lower at 13.7% for Females and 140% for Males As expected, sausage rolls were the single food item that contributed most to
saturated fat for all sub-groups except REGULAR Female canteens, for whom the main contributor was commercially prepared cakes. For all sub-groups, the proportion of total energy from polyunsaturated and monounsaturated fats were below the lower limits recommended. The current recommendation is that polyunsaturated fat should contribute " . about 7% of energy (but not exceed 10%) [while] . monounsaturated fat should be increased to 15% to 20% of energy" (Wahlqvist & Kouris-Blazos, 1997, p. 51 0). Figure 5 illustrates the percentages of monounsaturated, polyunsaturated and saturated fats to total energy for each sub-group. 61 Starcap Females 13.3% Regular Females 9.4% 21.2% 13.7% Iii Polyunsaturated Fat Starcap Males 13.3% Regular Males ·. 121% 20.8% 0 Saturated Fat 14.9% Figure 5. Percentage of canteen-derived monounsaturated, polyunsaturated and saturated fat to total energy intake Dietary Fibre STARCAP Female and Male students fibre intakes were
extremely low as illustrated in Figure 6, with sausage rolls contributing almost half of fibre intake at 0.83g (469%) and lOlg (486%) respectively REGULAR students fibre intakes were also low and potato wedges were the single food item that contributed most to fibre intake, accounting for 0.47g (257%) of fibre intake for Females and 2.14g (452%) for Males The low fibre intakes were due to minimal consumption of grain products, fruits, vegetables and pulses, which are all good food sources of dietary fibre. 62 35.------~--~---~-------~~-~---~"~~-~------~--~100% 30 25 20 15 10 5 0 80% 60% 40% 20% 0% Females 1.7 --+--% ofRDI 6% Males 1.8 6% 2.1 4.4 7% 15% Figure 6. Mean canteen-derived fibre intake and % of recommended intake Uncertainty surrounds recommendations for the intake of dietary fibre, with some disparity between international health authorities. In Australia, broad guidelines are aimed "at increasing the consumption of starchy foods and wholegrain
cereal products" (Jones, 1997c, p. 220) For the purpose of this study, if the recommendation for adolescent fibre intake were set at 20g, individual nutrient analyses revealed that only three students obtained one-third of this amount ·from canteen-derived foods. The three students were all REGULAR Males and their intakes, respectively, were: two buckets of potato wedges and one and-a-half vegemite sandwiches; one bucket of potato wedges and one pineapple juice; one croissant, one piece of pizza, one chicken and com roll, 55g jelly-based sweets, one sausage roll and one 600mllemonade. Apart from supplying over one-third of 20g of dietary fibre, these three intakes were similar in that their mean weight (743g ± 330g) was higher than the combined sample mean weight (488g ± 346g), reflecting that thesy three students did consume more than most students. The fat and sugar 63 components of these three males canteen food selections, however, can be seen to be somewhat less
than ideal. Vitamins Figure 7 shows that all sub-groups fell short of meeting one-third of the 200ug RDI for folate from canteen food consumption and again, REGULAR Males came the closest to meeting one-third of this nutrient at 48.2ug (240%) For STARCAP Female and Male students, ice confection products and flavoured milk beverages combined contributed 10.79ug (431 %) and 943ug (337%) respectively to folate intake. Potato wedges were the single food item that contributed most to folate intake for REGULAR Female and Male students at 2.07ug (106%) and 942ug (195%) respectively 200.-·-------------------------------------100% 100 00% 100 60% 40% oo m 0 0% Females IBBug ~%ofRDI 25.6 13% Males 19.5 10% 27.9 14% 48.2 24% Figure .7 Mean canteen-derived folate intake and %of RDI 64 Minerals Calcium There was a statistically significant difference between STARCAP and REGULAR Female students mean calcium intakes and Figure 8 shows that STARCAP students came closer
to obtaining one-third of the RDI for calcium, (1 OOOmg F and 1200mg M), while REGULAR students obtained approximately 10% of the RDI for this nutrient from canteen-derived foods. For STARCAP Females and Males, flavoured milk beverages and ice confection products were the main contributors to this nutrient, giving 195.75mg (765%) and 19874mg (772%) respectively to total calcium intake. Similarly, for REGULAR Females and Males, these foods were also main contributors to calcium intake, accounting for 41.02mg (335%) and 460mg (328%) respectively of calcium intake .-------------------------------------- 100% 80% 60% 40% 20% Regular Regular Starcap 0% Males Females lill!llilllllmg 274.7 118.6 257.5 136.9 ---+--- % of RDI 27% 12% 21% 11% Figure 8. Mean canteen-derived calcium intake and % of RDI 65 Mean intakes for iron were similar for all sub-groups in that they were extremely low. REGULAR Male students intake was double that of all other sub-groups as illustrated
in Figure 9, but despite this, no sub-group approached one-third of the 10-13mg RDI for iron from canteen food consumption. ~--------------------------------------~100% 80% 60% 40% Regular Starcap Females Regular 20% 0% Males lllllllilmg 1.1 1.0 -+-% ofRDI 9% 9% 1.1 10% 2.0 17% Figure 9. Mean canteen-derived iron intake and % of RDI Pies and sausage rolls combined were a main source of iron for all sub-groups except REGULAR Female students. These foods contributed 053mg (469%) and 0.46mg (407%) to total iron intake for Female and Male STARCAP students respectively and 0.71mg (343%) for REGULAR Male students For REGULAR Female students, Egg and Bacon Muffins were the single food item that contributed most to the intake of this nutrient, accounting for 0.15mg (15.3%) oftotal iron intake 66 Absorption rates of iron differ, depending, in part, on whether the iron is haem or non-haem, with estimations that approximately 25.5% of haem and 140% of non-haem iron is
absorbed (Cobiac & Baghurst, 1993, p. S4) Of the canteenderived iron consumed by the students in this study, approximately half was haem iron. Individual nutrient analyses revealed that only seven students in this study obtained one-third of the RDI for iron from canteen-derived foods. The seven students comprised three STARCAP students (two Females and one Male) and four REGULAR students (one Female and three Males). These intakes included food items such as: one egg and bacon burger and one hamburger; one pie and one sausage roll; one chicken and mayonnaise roll and one sausage roll. The seven intakes shared two similarities. Firstly, they were similar in that their mean weight (827g ± 313g) was relatively higher than the combined sample mean weight (488g ± 346g), reflecting a larger volume of foods consumed. Secondly, while these intakes provided one-third of the RDI for iron, they were also high in saturated fat which consequently contributed approximately 17.9% to total
energy intake (almost twice that recommended) 67 Summary There were marked differences between what was offered for sale at STARCAP and REGULAR canteens, the main difference being that REGULAR canteens offered more items for sale than STARCAP canteens. STARCAP canteens restricted the sale of ice confection products to lunchtimes, restricted the sale of a small range of cakes to recess and did not include soft drinks on their menus. One REGULAR canteen (S 3) also restricted the sale of ice confection products to lunchtime only. The other REGULAR canteen (S 4) placed no restriction on the sale of these items and soft drinks were offered for sale at this canteen. Proportionately more REGULAR students (65%) recalled consuming foods from the canteen than STARCAP students (53%). As expected, there was a great deal of variability within each sub-groups mean intake for the nutrients analysed in this study. The variability was due to differences between what each canteen offered for
sale and subsequently the foods students had to select from and, typically, individual differences between what each student chose to consume from the canteen. For the nutrients analysed in this study, all sub-groups met the recommendation that 55% of total energy be derived from carbohydrates. However, the recommendation that complex carbohydrate supply 45% of total energy and refined carbohydrate supply the remaining 10% of total energy was not met. (Wahlqvist & Kouris-Blazos, 1997, p. 510) For the remainder of nutrients, all 68 sub-groups fell short of meeting one-third of current dietary recommendations, with the exception of REGULAR Male students, who exceeded one-third of the RDI for protein. All sub-groups, except REGULAR Females, exceeded the 30% contribution of fat to total energy. More specifically, intakes of saturated fat greatly surpassed current recommendations, particularly for STARCAP students. Overall, the results revealed that REGULAR Males came the
closest to obtaining one-third of nutrient intake from canteen-derived foods. 69 CHAPTERS Discussion Introduction In order to discuss each research question, this chapter is divided into four sections, beginning with the canteen food consumption patterns exhibited by the students in this study, followed by an evaluation of canteen usage. Each sub-groups mean nutrient intake is discussed with regard to the National Health and Medical Research Councils (1991) Recommended Dietary Intakes (RDis) and the Goals and Targets for Australias Health in the Year 2000 and Beyond (1993). Canteen Food Consumption Patterns Discussion regarding the differences between consumption patterns is provided under each food categorys sub-heading, as well as possible short and longterm nutritional implications resulting from the food choices made by the students in this study. In addition, strategies employed by each canteen to provide a foodservice in accordance with current dietary recommendations
are discussed. 70 Although there were distinct differences between what each canteen offered for sale, Figure 10 shows that consumption patterns were not that dissimilar, except for the Ice Confection/Dairy category and the Confectionery category. Sandwiches/Rolls Hot Snacks Hot Meals Salads/Fresh Fruit •starcap Iii Regular Cakes/Pastries Ice Confection/Dairy Confectionery Beverages Daily Specials 0% 10% 20% 30% 40% 50% 60% 70% 80% Percentage of Items Purchased Figure 10. Percentage of canteen purchases from each food category Sandwiches/Rolls One STARCAP canteen offered Hyfibre white bread as an option in the preparation of sandwiches which is one way to try to increase fibre in the students diets. This is encouraging with regard to the possible protective effects of dietary fibre against diseases of affluence (Jones, 1997c, p. 215) One REGULAR canteen used no spread (margarine or butter) in the preparation of sandwiches or rolls. In tenns of reducing the
consumption of visible fat and 71 consequently the contribution of fat as a proportion of total energy, again this is encouragmg. Although these canteens employed strategies to provide a foodservice in accordance with current dietary recommendations m the Sandwiches/Rolls category, no STARCAP students recalled consuming a sandwich and for the REGULAR canteen that used no spread, only one student recalled consuming a sandwich. It is difficult to determine why sandwiches and rolls were not popular choices with the students in the study due to the numerous factors that influence food choice behaviour. It could be that on the day of data collection, the weather was cooler and so students preferences were directed toward hot foods. Sandwiches and rolls should be promoted by school canteens, particularly those with salad-based fillings, in order to increase both fibre and vegetable intake, which were alarmingly low for the students in this study. If the CSIRO 12345+ Food &
Nutrition Plan (Baghurst, Hertzler, Record & Spurr, 1992) recommendation that 3 serves of fruits and 4 serves of vegetables be consumed daily is to be achieved by the students in this study, school canteens need to offer and promote fresh fruits and vegetables and thus make a more positive impact on the short and long-term health of students. 72 Hot Savouries Despite the marked difference between the number of items offered for sale in the Hot Savouries category between STARCAP (n=ll) and REGULAR (n=45) canteens, this category was popular with all sub-groups with 47% of STARCAP students and 61% of REGULAR students recalling consumption of one or more hot savoury item. Although there was a range of items offered for sale in this category, students limited their choice to relatively few items with pies, sausage rolls, potato wedges and pizza being main choices. While foods consumed from this category accounted for approximately half of total fibre and iron intake, they also
contributed over half of saturated fat intake for all sub-groups except REGULAR Females. The popularity of this category is of concern because over-consumption of high-fat foods could have detrimental effects on both the short and long-term health of the students in this study; namely overweight, obesity and increased risk of cardiovascular disease (Tilston, Neale, Gregson & Douglas, 1992; National Health Priority Areas, 1996; Church, 1997; Douglas, 1999; Booth et al; 2001). For example, sausage rolls were a frequently occurring food choice for all sub-groups and Figure 11 shows the contribution sausage rolls made to total saturated fat intake. 73 10 ~·---------------·---~-------------~100% 8 80% 6 60% 4 40% 2 20% 0 0% Males Females --+- % of total saturated fat 4.5 0.70 5.5 4.0 40% 11% 48% 36% intake Figure 11. Contribution of consumption of sausage rolls to saturated fat intake Many studies have demonstrated that adolescents prefer high-fat foods
like pies, sausage rolls and pizza (Seaman, Bower & Fleming, 1997; Douglas, 1998; Brady, Lindquist, Herd & Goran, 2000). However, current recommendations suggest that these items should form a small portion of a nutritionally balanced diet and be consumed only occasionally. In accordance with this recommendation and because of the role that many believe school canteens should play in reinforcing nutrition lessons taught in classrooms (McBride, 1992; Magarey & Boulton, 1995; Church, 1997; Douglas, 1998; Cholin, 1999; Huon, Wardle & Szabo, 1999; Marshall et al; 2000), one way to reduce the intake of saturated fat for the students in this study could be to limit the sale of foods like pies, sausage rolls and pizza to special occasions such as the last day of term or to special events on the school calendar. The concern presently is that regular inclusion of high fat foods on canteen menus may be sending a message that frequent consumption of these foods is acceptable or
even normal. 74 As previously stated, the food items included in the Hot Savouries category were generally high in fat, so that while there was a wide choice available, particularly for REGULAR students, the choice was between one high-fat item and another. In terms of reducing fat intake, apart from restricting the sale of high fat savoury items to special occasions, canteens could replace less healthy for healthier choices such as bread-based products (toasted focaccia rolls and sandwiches), burritos or enchiladas with bean fillings, com on the cob or pizza made with reduced-fat cheese and increased vegetable toppings (Health in Schools, 1997, p. 17) Hot Meals All canteens included a range of items in the Hot Meals category, with REGULAR canteens again offering more choice (n=14) than STARCAP canteens (n=4). A number of items in this category were more nutritious with regard to increasing complex carbohydrate, fibre, vitamin and mineral intake compared to those in the Hot
Savouries category and examples include hot soups, pastabased dishes, baked and stuffed potatoes. However, only two REGULAR students recalled consuming foods from this category (one 250g serve of spaghetti bolognaise and one-half plain baked potato), while no STARCAP students recalled consuming any items from this category. To explain why this category was not popular is difficult within the constraints ofthis study. It could be that Hot Meal items are not as convenient to 75 consume as those in the Hot Savouries category. Meals like baked potatoes and pasta usually require utensils (knife and fork or spoon) and are difficult to consume without being seated. The amount of table seating available in most Perth metropolitan high schools is minimal or non-existent and during recess and lunchtimes many students walk, participate in sporting activities (such as kicking a football) and generally stand in groups with peers while eating. The lack of amenities at school sites for
students to sit and eat, coupled with the mobile nature of playground activities, could be factors that make consuming meals unappealing compared to the convenience of eating a pie, sausage roll or other savoury snack on the run. In fact, in studies that have focused on factors that influence the food choices of adolescents, convenience was a strong determinant of food choice (Huon, Wardle & Szabo, 1999; Neumark-Sztainer, Story, Perry & Casey, 1999). Salads/Fresh Fruits Despite comparable Salads/Fresh Fruit items being offered for sale at each canteen, no students in this study recalled consuming any foods from this category. The low fruit and vegetable consumption recalled by the students in this study mirrors analyses of larger Australian studies with similar-aged adolescents (National Dietary Survey of Schoolchildren aged 10-15 Years, 1985; The Adelaide Nutrition Study; 1995) where consumption of fruits and vegetables was markedly lower than recommended. 76 The low
fruit and vegetable consumption demonstrated by the students in this study is of major concern because "fruit and vegetable consumption during childhood is strongly predictive of consumption in adulthood" (Huon & Wardle, 1999, p. 157) The importance of including fresh fruits and vegetables in the diet cannot be over-emphasised in light of current investigations about the possible protective features of phytochemical components. When questioned about why it is difficult for adolescents to increase consumption of fruit and vegetables, Neumark-Sztainer, Story, Perry and Caseys (1999) focus-group investigation with 12-14 year-old students listed the following reasons to explain why they are not popular food choices for this age group: taste (junk food tastes better), promotion (fruit and vegetables are not as visible as other foods such as meal deals), convenience (fruits need to be peeled) and visual appearance (fruit looks bruised). In order to promote the consumption of
fruit, the canteens in this study could adopt the suggestion offered by participants in the focus-group investigation who stated that adolescents could be encouraged to ponsume more fruit at school by making it more accessible and convenient. For example, fruit could be peeled, cut and prepacked for serving. Whilst this preparation may reduce the dietary fibre content (and, possibly, the vitamin content), it is a better alternative to no school-time fruit intake. 77 Cakes/Pastries There were distinct differences between canteens as to what was offered for sale in the Cakes/Pastries category. REGULAR canteens again offered an extensive range of commercially prepared cake and pastry items which varied from day to day, while STARCAP canteens offered a limited range. STARCAP canteens placed restrictions on the sale of cake and pastry items to recess, while no restrictions were in place for REGULAR canteens. Despite restricted selling times and less cake and pastry choices offered
by STARCAP canteens, more STARCAP students (17%) recalled consuming items from this category than REGULAR students (12%). The popularity of cakes and pastries, particularly with STARCAP students, could be due to preferences for sweet-tasting foods, which Nestle et al. state are both "innate and universal" (1998, p. S53) Douglass (1998) investigation into 12 year-old childrens food preferences supports this partiality toward sweet-flavoured cakes, with 66% of students indicating a preference for doughnuts compared to apples (p. 16) The cake and pastry items consumed by students in this study contributed approximately 10% to the intake of most nutrients, except for REGULAR females who derived 22.8% of saturated fat from this category The reason for this was because of the nutritional difference between the types of cakes and pastries offered for sale: STARCAP canteens offered lower-fat items such as muffins and iCed buns, whereas REGULAR canteens offered higher-fat items,
such as caramel slice, croissants and Danish pastries. 78 Ice ·Confections/Dairy The Ice Confections/Dairy category was the category where the most difference was exhibited between the food choices patterns of STARCAP and REGULAR students. Upon consultation with REGULAR canteen managers, it was determined that the two REGULAR canteens offered a varied range of items that changed frequently, whereas STARCAP canteens offered a limited choice of items for sale. The two STARCAP canteens and one REGULAR canteen placed a restriction on the sale of ice confection products to lunchtimes, while the other REGULAR canteen sold these items at all times. Like the Cakes/Pastries category, despite restricted selling times and less choice offered by STARCAP canteens, more STARCAP students (65%) recalled consuming items from this category than REGULAR students (16%). While the innate preference for sweet-flavourec,l foods offers an explanation as to why the students in this study chose to
consume foods like ice confection products, it does not explain why four times as many STARCAP students consumed items from this category compared to REGULAR students. Another explanation could be that REGULAR students had a more extensive range of alternative sweetflavoured foods to select from, such as confectionery items, which displaced the consumption of ice confection products. 79 For STARCAP Females, the consumption of ice confection items contributed approximately 20% of carbohydrate, folate and calcium intake. However, due to the high fat content of ice cream products, these items also contributed approximately 20% to saturated fat intake for this sub-group. The Ice Confections/Dairy category contains food items which are important sources of calcium, such as yoghurts and (to a lesser degree) ice cream. Y oghurts are a lower-fat source of calcium than ice cream products, however no students in this study recalled purchasing yoghurt from the canteen. Frozen yoghurt was
also offered for sale at one STARCAP canteen and again, no students in this study recalled consuming this item. Given the popularity of ice confection products and the nutritional benefits of yoghurt, it could be advantageous for canteens to make frozen yoghurt the only ice confection item available for sale. According to Neumark-Sztainer, Story, Perry & Caseys focus-group investigation, adolescents stated that "the way to get them to eat better is to make he.althful foods the only option because they will pick the high-fat or high-sugar option if they are given an option" (1999, p. 932). Confectionery Again REGULAR canteens offered a far more extensive range of items in the Confectionery category than STARCAP canteens. This category was very 80 popular with REGULAR students: 42% recalled consuming confectionery items from this category compared to 6% of STARCAP students. As a result, REGULAR students sugar intake was markedly higher than STARCAP
students. Like the Cakes/Pastries category, there were differences between the types of confectionery items offered for sale. REGULAR canteens included chocolate novelty bars on their menus which, apart from contributing to sugar and energy intake, also contributed to fat intake. One STARCAP canteen offered no confectionery items for sale and the other STARCAP canteen included three confectionery items on its menu. These three items were sugarbased jelly sweets which, although high in refined sugar, contain no fat The concern with confectionery is two-fold: it can displace more nutrient-dense foods in the diet and there is a direct link between foods with high-sugar content and the incidence of dental caries (Jones, 1997a, p. 203) The consumption of confectionery items from the canteen contributed minimal amounts of nutrients for the students in this study, except REGULAR Females, for which items in this category contributed approximately 10% of carbohydrate and calcium intake.
This is of concern because there are many more nutrient-dense food sources that can supply carbohydrate and calcium, which were not consumed by this sub-group so that items like confectionery supplied these nutrients, virtually by default. Q•1 01. Beverages There were two main differences between what was offered for sale in the Beverages category - one REGULAR canteen included hot drinks on its menu and the other REGULAR canteen offered soft drinks for sale. Apart from these differences, beverage items offered for sale were similar for all canteens. Beverages were frequent consumption choices for all students in this study: 74% of STARCAP students and 68% of REGULAR students recalled consuming one or more items from this category. While sugar is not a nutrient that has been included for analysis in this study, it is interesting to note that for those REGULAR students who had access to soft drinks, the consumption of these items accounted for 47% of total sugar intake. Like
confectionery, the concern is two-fold: the displacement of other more nutrient-dense foods and the increased incidence of dental caries. For STARCAP Female and Male students, items consumed in the Beverages category contributed 59.6% and 691% to calcium intake whereas for REGULAR students, consumption of beverage items contributed only 28.9% to the intake of this nutrient for Females and 38.1% for Males The difference in calcium intakes can be attributed to the difference in amounts of flavoured milk beverages consumed by STARCAP students (n=ll) compared to REGULAR students (n=3). 82 While the contribution that flavoured milk beverages made to STARCAP Female and Male calcium intake is encouraging, these sub-groups also obtained 20.3% and 33.0% respectively of saturated fat from flavoured milk beverages compared to REGULAR Female and Male students, who obtained only 4.6% and 8.8% respectively from the consumption of these items Given the difference in the number of flavoured milk
beverages consumed between STARCAP and REGULAR students, the increased amount of saturated fat derived from these items is to be expected. Seventy-three percent of flavoured milk beverages consumed by STARCAP students were whole milk varieties (Supershakes) and only 27% were reducedfat (Masters or Brownes Choc Milk or Ice Coffee). An effective way to reduce the amount of saturated fat consumed by students, while maintaining calcium intake, would be to offer only reduced-fat flavoured milk beverages for sale which would be an acceptable strategy for this adolescent age group. Daily Specials All canteens included Daily Specials on their menus. One STARCAP canteen (S 1) offered a range of sandwiches, rolls and salads for each weekday. The remainder of canteens, however, promoted mostly high-fat foods in this category, such as pies, pasties and sausage rolls. Daily Specials are often marketed as nieal deals which frequently include a beverage. 83 The promotion of high fat foods
at reduced retail pnces is of paramount concern for a number. of reasons First and foremost, as the visibility of these food items is increased at the canteen, the visibility of more healthful foods is subsequently decreased. Consequently, when faced with a plethora of less healthy items at the canteen service counter, the task of choosing healthy foods is made more difficult for students. Reducing the price of high fat foods and including a beverage (often a soft drink in the case of one REGULAR canteen) also adds to the difficulty for students to make better food choices at the canteen, due to the seemingly increased expense of eating healthier foods compared to meal deals. Instead of promoting less-healthful foods, canteens should promote food items that encourage healthy food choices and preferences. Marketing strategies that reinforce what is taught in classrooms would be beneficial for both dietary intervention and education. For example, canteens could implement weekly
promotions based on each of the nutrients that are typically borderline for adolescents, such as fibre, folate, qalcium and iron. Alternatively, canteens could focus marketing strategies around health-related messages such as eat less fat and eat more fruit and vegetables. By changing the environment so that appropriate foods are available, canteens could play an effective role in improving "dietary habits in order to produce a healthful diet and to prevent diet-related disease" (Brady, Lindquist, Herd, & Goran, 2000, p. 366) 84 Canteen Usage The school canteen was a very popular food source for the students in this study and accounted for 75% of all food consumed during school-time; 53% of STARCAP students and 64% of REGULAR students recalled consuming one or more food items from the school canteen. This trend is similar to other analyses (Tilston, Neale, Gregson & Douglas, 1992; Ruxton, Kirk, Belton & Holmes, 1993) where over 50% of participating
students also utilised the canteen during school-time. Of concern are the 3% of STARCAP students and 5% of REGULAR students who recalled consuming no food at all during schooltime, particularly with regard to possible detrimental effects on physical and cognitive development. Given the frequency with which the students in this study used the canteen, school canteens have the potential to provide students with a substantial proportion of daily nutrients. In addition, canteens enjoy unique placement as the sole foodservice provider within education sites. They therefore have an obligation to be a source of both dietary intervention and education (McBride, 1992; Magarey & Boulton, 1995; Church, 1997; Douglas, 1998; Cholin, 1999; Huon, Wardle & Szabo, 1999; Marshall et al; 2000). This is particularly pertinent with regard to mounting evidence regarding the importance of developing sound lifelong eating behaviours during adolescence and therefore the prevention of diet related
diseases (Douglas, 1998; Cholin, 1999; Huon, Wardle & Szabo, 1999; Neumark-Sztainer, Story, Perry & Casey 1999; Brady, 2000; Livingstone & Robson, 2000). 85 Nutrient Intakes- How Do They Measure Up to the RDis and National Targets? Mean nutrient intakes derived from canteen food consumption are discussed in this section. A summary is provided for each nutrients function in relation to adolescent growth and development. The main food items that contributed to each nutrient are identified and suggestions are offered as to how canteens can offer a foodservice which is consistent with current dietary recommendations. Macronutrients Protein Food sources of protein differ in their concentration and can be categorised into two groups: animal-derived and plant-derived. Animal-derived protein is considered high quality because its indispensable amino acid content closely matches human requirements and is more readily digested than plant-derived protein, which is
considered low quality. Adolescents have slightly higher protein requirements than adults because the turnover of this nutrient is increased during this stage in the lifecycle to accommodate rapid growth spurts and the synthesis of new tissues (Read, 1997, p. 190) It is important to note that while the RDI for protein is intended to cover the needs of 97.5% of the Australian population, if the dietary protein source is 86 predominately of low quality, further allowance may have to be made (NHMRC, 1991). All sub-groups in this study approached one-third of the RDI for protein. REGULAR Males exceeded one-third of the RDI, obtaining 38% of their protein requirement from canteen-derived foods. Female students protein intakes were lower than the Males, which is consistent with Brady, Lindquist, Herd & Gorans observation that females generally have lower protein intakes than males (2000, p. 361) The canteen foods that contributed to protein were mostly from animal-derived
foods. The main contributors were sausage rolls, pies, flavoured milk beverages and pizza and while SERVE does not distinguish between animal and plant sources of protein, in terms of assessing amino acid quality it would be reasonable to say that the students in this study obtained proportionately more high quality protein than low quality protein. While protein intakes approached one-third of the RDI, the main foods that contributed to the intake of this nutrient were also high in fat. Consequently, to reduce fat intake and maintain protein intake, canteens could offer and promote food items that supply protein in the diet and are low in fat. Sources of high quality protein include lean beef, lean chicken, fish, eggs, milk and cheese. Food item suggestions for canteens include: lean steak burgers and sandwiches served on a variety of breads such as Turkish, French, mixed grain, focaccia or bagels; smoothies and icy poles made with fresh fmits and yoghurt; reduced-fat 87 milk
beverages; and pizza with pita or Lebanese bread bases and low-fat toppings. Sources of plant protein include cereal products, pulses, rice, nuts and vegetables. Food items that would be suitable for canteen menus include: salad-based sandwiches and rolls served on assorted breads; burritos, tacos and nachos with legume and vegetable-based fillings; and trail mix packages of dried fruits and nuts. Carbohydrates Carbohydrate is the main source of dietary energy for the body and food sources are wide and varied. For the purpose of this study, food sources of carbohydrate are referred to as unrefined (complex), refined (sugar) and, associated with carbohydrate, dietary fibre. This section focuses on carbohydrates that supply energy, while dietary fibre is discussed separately. The Target 2000 recommendation is that 55% of total energy be derived from carbohydrate, with unrefined carbohydrates contributing 45% and refined carbohydrates contributing less than 10% of total energy intake
(Wahlqvist & Kouris-Blazos, 1997, p. 510) All sub-groups in this study came close to obtaining 55% of their total energy from the carbohydrate content of canteen-derived foods, with REGULAR Females exceeding this recommendation at 62%. These proportions may appear to be encouraging, however, carbohydrate intake was mostly in the 88 form of refined sugars with few students in this study consuming any complex carbohydrate food sources. The main food items that contributed to carbohydrate intake for STARCAP students were ice confection products and flavoured milk beverages, while for REGULAR students, soft drinks were the single food item that contributed most to carbohydrate intake. This is of some concern because not only are these foods relatively nutrient-deficient, but they can also be the vehicle for the consumption of extra fat in the diet. Furthermore, refined carbohydrate foods can displace more nutrient-dense foods and because they "consist of simple, easily
digestible sugars [they are] great precipitators of dental caries" (Tilston, Neale, Gregson & Douglas, 1992, p. 104) Of central importance is the promotion of complex carbohydrate food sources for the students in this study. Not only are complex carbohydrate foods usually low in fat, but they may also help in the prevention of a number of healthrelated diseases such as those associated with overweight and obesity. This is due, in part, to the high satiety (feeling of fullness) value associated with the consumption of complex carbohydrate, as well as the regulatory processes involved in the ingestion, digestion, absorption and transport of complex carbohydrates (Read & Kouris-Blazos, 1997). Good food sources of complex carbohydrates include cereal products, root vegetables and pulses. In order to increase the consumption of these types of foods, canteens could encourage the sale of foods that already feature on their 89 menus, but which were not popular food choices
with the students in this study, such as pasta-based dishes, baked potatoes, sandwiches and rolls. In addition, further suggestions include: fruit loaves, muffins and cakes made from wholemeal flour or with added bran; oat-based or wheatmeal-based cookies; and hot soups containing pumpkin, sweet-potato and potato. Total Fat While fat is an essential nutrient, the functions of which include the supply of energy, essential fatty acids and as a vehicle for fat soluble vitamins (Jones, 1997b, p. 213), there are numerous health-related concerns surrounding excess consumption of dietary fat. Many studies have suggested "a positive association between high fat consumption and frequency of obesity" (Anderson, 1996, p. 14), with overweight children and adolescents at increased risk of becoming overweight as adults and "experiencing the chronic health problems associated with adult obesity" (Booth, Wake, Armstrong, Chey, Hesketh & Mathur, 2001, p. 162) In addition,
it has been estimated that approximately one-third of cancers that occur in Western countries can be attributed to diet (Archer, 1996; Law, 2000). The consumption of dietary fat has been tentatively associated as a contributing factor to higher incidences of some cancers, including colorectal and breast cancer (Archei, 1996; NHPA, 1997; Law, 2000). 90 All sub-groups in this study exceeded the 30% upper limit set for the contribution of fat to total energy, with sausage rolls as the main contributor to this nutrient, except for REGULAR Female students, for whom commercial cakes contributed the most to this nutrient. The high fat intake which resulted from canteen-derived food consumption is similar to other studies (Tilston et al, 1992; Magarey & Bolton, 1995; Church, 1997; Riley & Dean, 1997) in that the proportion of dietary fat to total energy exceeded current recommendations. As well, the saturated fat contributed more than 10% to total fat, a proportion which is
considered as the supper limit for saturated fat as a contributor to total energy. For STARCAP students, the contribution of saturated fat to total energy was over 20%; twice that of the <1 0% recommended. Similarly, for REGULAR students the contribution saturated fat made to total energy was also too high at approximately 15%. For saturated fat specifically, one main concern is the effect it has of increasing low-density lipoprotein (LDL) cholesterol and therefore the possible risk of cardiovascular diseases (Ball, 1997b, p. 389) Current recommendations also advise that monounsaturated fat should contribute 15 to 20% of total energy and polyunsaturated fat should contribute 7 to 10% of total energy (Wahlqvist & Kouris-Blazos, 1997, p. 510) For all sub-groups in this study, the proportionate intake of both polyunsaturated and monounsaturated fats were below the lower limits recommended. This is of concern due to the association between polyunsaturated fat and the lowering
effect it has on LDLs and consequently, the possible prevention of 91 cardiovascular diseases (Ball, 1997a, p. 375) Likewise, the positive health effects of monounsaturated fats in the diet are well established (Saxelby, 1999). As stated earlier, one way to reduce the amount of fat that canteen-derived food supplied would be to remove items that are high in fat, such as pies and sausage rolls from canteen menus or to offer them for sale only on special occasions. By changing what is available for sale to more healthful food choices, several studies have demonstrated a significant decrease in the amount of fat consumed (Huon, Wardle & Szabo, 1999; Johnson, 2000). Dietary Fibre All sub-groups mean dietary fibre intakes were extremely low in this study- a result that mirrors other studies where fibre intakes of children and adolescents have been compared to dietary recommendations (Tilston, Neale, Gregson & Douglas; 1992, Magarey & Boultol)., 1995; Huon & Wardle,
1999; Johnson, 2000). Students low fibre intakes can be attributed to the low canteen-derived consumption of foods like fruits, vegetables, grains and legumes, which are all good sources of fibre. It has been proposed that diseases of affluence are related to dietary fibre deficiencies and research evidence is accumulating that supports the notion that "fibre is one of several interacting features of diets that may be protective against disease" (Jones, 1997c, p. 216) More specifically, high dietary fibre 92 intake has been associated with "lower incidence of certain chronic disorders, such as cardiovascular diseases and large bowel cancer" (Gallaher & Schneeman, 1996, p. 87) In light of this, the low mean fibre intake of students in this study is likely to lead to increases in the incidence of these diseases in Australia. Of even more concern are the types of foods which contributed to fibre intake, with sausage rolls and potato wedges being main
contributors. Processed foods such as sausage rolls are very high in fat, contain too little fibre and displace other more nutrient-dense foods in the diet. It is a direct reflection on the nutrient quality of canteen foods perse that high fat and processed food items became the major contributors to students school-time dietary fibre intakes. Encouragingly, one STARCAP canteen attempted to promote dietary fibre intake by offering Hyfibre white bread in the preparation of sandwiches. While no STARCAP students in this study recalled consuming a sandwich from the canteen, this type of initiative is to. be commended Offering Hyfibre white bread as the only option and increasing the promotion of food items containing this product would be one way to increase students school-time fibre intake. 93 Vitamins The functions of folate are numerous and include assisting in the synthesis of DNA and cell membranes and in the metabolism of protein and fat. Folate also plays a role in
protecting against neural tube birth defects, heart disease and nerve damage (Wahlqvist, 1997, p. 237) During adolescence- a time in the life cycle characterised by rapid growth spurts and development - folate is essential for cell division and protein synthesis; processes that are "critical to growing tissues and the replacement of red blood cells" (Ball, 1997b, p. 435) All sub-groups mean folate intakes were low in this study, except for REGULAR Males who obtained 48.3ug (24%) of the 200ug RDI for folate from canteen food consumption. The resulting low folate intakes by the students in this study were due to the kinds of foods consumed. Good sources of folate include" . leafy vegetables, citrus fruits and nuts" (Wahlqvist, 1997, p 236); foods that very few students in this study consumed and only in small amounts. Apart from the good food sources already mentioned, folate occurs widely in a variety of foods and one way to increase the school-time intake of this
nutrient would be to promote diets which feature a variety of fresh foods. Encouraging adolescents to consume a variety of foods is particularly pertinent in light of the relatively narrow food choice patterns exhibited by the students in this study. In fact, food variety has been cited as "crucial for optimal health 94 and a nutritionally adequate diet, [the benefits of which include] some protection against macro vascular disease and possibly even cancer" (Walhqvist & Kouris-Blazos, 1997, p. 521) Promoting a variety of foods and limiting the sale of low-nutrient foods at school canteens may be a way to increase students intake of folate. For example, a 165g Mrs Mac Sausage Roll and 300ml Masters Reduced-Fat Chocolate Milk provides 27ug of folate, whereas a chicken and salad sandwich, a 200ml tub of low fat yoghurt and 300ml orange drink provides 69ug, or approximately one-third of the RDI for folate. Minerals Calcium Calcium plays an integral role in
metabolism and cellular processes and is essential for skeletal development. During adolescence, approximately 40% of peak bone mass is accumulated and according to Weaver: Bone mineral density is a predictor of bone strength [and] building . peak bone is an important strategy to reducing risk of osteoporosis later in life. Therefore, the opportunity to greatly influence bone-mass acquisition must occur before late adolescence (2000, p. 515) There was a statistically significant difference between Female STARCAP and REGULAR students mean canteen-derived calcium intakes. This was due to 95 STARCAP Females consuming more calcium-dense foods such as flavoured milk beverages and ice confection items than REGULAR Females. The results of this study agree with Johnsons assertion that "only children with a source of milk in their diets come close to meeting calcium recommendations" (2000, p. 298). It appears that for REGULAR students, particularly Females, soft drinks
displaced more nutrient-dense beverages such as milk-based drinks. The trend for carbonated beverages to displace important nutrients in adolescent diets has been observed in other studies (Douglas, 1998; Johnson, 2000; Weaver, 2000; Wildey, 2000) and is of concern because "the roles of micronutrients provided by milk [that] are required for growth and bone formation at this stage in life" (Douglas, 1998, p. 17) are being minimised Figure 12 illustrates the variation between the types ofbeverages purchased by the sub-groups in this study. Of particular note is the high soft drink consumption by REGULAR Female canteen users. 12 "0 Q) (f) 10 ro .c: ~ ::I 0. 8 IIl Flavoured Milk (f) Q) 0> ~ Q) Ill Soft Drinks 6 D Fruit Drinks D Bottled Water > Q) CD 0 4 (f) Q) 0. .::- 2 0 Starcap Females Regular Females Starcap Males Regular Males Figure 12. Canteen-derived types and number of beverages purchased by students 96 Because "milk
and dairy products provide the most important source of calcium in childrens diets" (Johnson, 2000, p. 298), an obvious way to increase calcium intake for REGULAR students in this study would be to remove soft drinks from canteen menus. This strategy could affect nutrient intakes two-fold - decrease the displacement of milk and other more nutrient-dense foods and reduce refined sugar intakes. For STARCAP Females and Males, while flavoured milk beverages and ice confection products contributed 76.5% and 772% respectively to total calcium intake, the high contribution these items made to saturated fat intake for STARCAP students has already been discussed, with the recommendation that reduced-fat milk beverages be offered on canteen menus and frozen yoghurt confections be promoted in place of ice confections. "Iron is an essential mineral, vital for carrying oxygen to all body tissues as well as removal of carbon dioxide from the tissues for excretion from the body via the
lungs" (Cobiac & Baghurst, 1993, p. S3) During adolescence, iron requirements are increased due to growth spurts which "create peaks of iron requirements . as a consequence of rapid expansion of the blood volume as well as gain in body mass" (NHMRC, 1991, p. 21) 97 Mean iron intakes were similar for all students in this study in that they were extremely low. This result mirrors similar studies where it has been found that adolescents "aged between 12-15 years had lowest average iron intakes [with females in particular] at very high risk of developing iron deficiency" (Cobiac & Baghurst, 1993, p. SlO) If the low canteen-derived iron intakes are indicative of usual iron intake for the students in this study, then concern surrounds the possibility of developing iron deficiency which can adversely affect "behaviour, cognitive function and motor development" (Cobiac & Baghurst, 1993, p. S5) for this age group Only seven students in this
study obtained one-third of the RDI for iron from canteen-derived foods. These intakes were similar in that they were characterised by higher weights of foods consumed than the mean sample weight and also comprised of at least two substantial food items. Concern surrounds individual students consuming a combination of food items like one pie and one sausage roll, or one h.amburger and one egg and bacon muffin during one school-time day. Depending on what else is consumed outside of school time, these combinations of foods may be supplying too much fat (especially saturated fat) to total energy for the students concerned. Good food sources of haem iron include red meat and chicken and good sources of non-haem iron include eggs, wholemeal bread and fortified cereals (Read & Kouris-Blazos, 1997, p. 302) Accordingly, canteens could offer and promote foods that are good sources of iron, without also being high in fat. 98 Examples include: steak and chicken sandwiches, rolls and
burgers served on a variety of breads with salad-based fillings; pasta dishes with meat sauce such as cannelloni, bolognaise, ravioli and lasagne; beef and chicken kebabs; souvlakia skewers; and meat-based dishes such as satay beef or tandoori chicken served in pita pockets. Summary Despite differences between what each canteen offered for sale, consumption patterns were remarkably similar for all sub-groups with sausage rolls, potato wedges, ice confections and flavoured milk beverages being popular choices. In addition, REGULAR students who had access to soft drinks and confectionery items frequently consumed these foods; 48% of REGULAR students recalled consuming one or more confectionery item and 70% recalled consuming one or more soft drink beverage. The consumption of these types of foods may be expected and even acceptable, if canteen foods were to form a minute proportion of total daily food intake. However, this is not the case with the canteens in this study being
responsible for providing 75% of students total school-time nutrient intake. The only positive impact the STARCAP program had was for STARCAP Female students in this study, for which there was a statistically significant difference for the intake of calcium between STARCAP and REGULAR Females. It appears that for 99 REGULAR Females, the consumption of soft drinks probably displaced the nutrients contained in.flavoured milk beverages and fruit drinks Of concern are the high proportions that saturated fat made to total energy for STARCAP students, which were approximately twice that of REGULAR students. Despite STARCAP canteens offering a range of healthful items for sale on their menus, they also included a limited number of commercially prepared hot savoury items, such as sausage rolls and beef pies. Sausage rolls were very popular choices for STARCAP students, for which this item alone contributed nearly half of saturated fat intake. The companson with current dietary
recommendations revealed that the canteen foods consumed by students in this study fell well short of meeting guidelines. These results are similar to other studies where dietary analyses have concluded that the eating patterns of children and adolescents are characterised by high fat and sugar intake, and low fibre, low complex carbohydrate and low selected mip.eral intake (Magarey & Boulton, 1995; Church, 1997; Douglas, 1998; Huon & Wardle, 1999; Huon, Wardle & Szabo, 1999; Brady, Lindquist, Herd, & Goran, 2000; Johnson, 2000). This is disturbing because "continued consumption of foods high in fat and sugar will have a detrimental effect on the health of. children" (Douglas, 1999, p 185) both in the short and long term. The results indicate that for the students who participated in this study, the STARCAP programs aim to "increase the availability . and sales of healthier 100 food choices" (WASCA Inc, 2000, p. 2) was effective when
companng STARCAP and REGULAR Female students one-day mean intake of calcium. The STARCAP canteens in this study provided a foodservice in accordance with current dietary recommendations more so than REGULAR canteens by way of offering fewer food items high in refined sugar and fat (such as soft drinks, cakes and pastries, confectionery and savoury items). However, the STARCAP students displayed a partiality to select from the limited range of high fat, commercially prepared food items over the more healthful options that were offered for sale. It appears, therefore, that in order to support students to make nutritious food choices at the canteen, healthful food options should be the only food options available for sale. 101 CHAPTER6 Summary and Recommendations This study was concerned with assessmg whether the Star Canteen Accreditation Program (STARCAP) better met the National Health and Medical Research Councils (1991) Recommended Dietary Intakes and the Goals and Targets
for Australias Health in the Year 2000 and Beyond (1993) compared to REGULAR canteens. Results conclude that the food choices made by students from REGULAR canteens contributed more to protein, (for which REGULAR Male students exceeded one-third of the RDI) and fat, (for which REGULAR Female students approached the upper limit of the Target that this nutrient not provide more than 30% of total energy). For the remainder of the nutrients analysed in this study, however, no sub-groups obtained one-third of the RDis or Targets from either STARCAP or REGULAR canteen food consumption. The examination of food items offered for sale at each canteen revealed that REGULAR canteens featured considerably more food items on their menus and that STARCAP canteens employed the practice of restricting the sale of certain food items, such as ice confections, cakes and pastries more so than REGULAR canteens. While STARCAP canteens offered a number of healthier food choices on their menus, all
students in this study exhibited similar food consumption 102 patterns, with sausage rolls, potato wedges, ice confections and flavoured milk beverages being popular choices. The recommendations in this section are presented to address nutrient concerns that are relevant to the students in this study. Reduce Fat Intake to Less Than 30% of Total Energy Intake There are a number of changes that school canteens could implement to meet this recommendation, the simplest being the replacement of high fat foods that are presently offered for sale with organoleptically attractive lower fat foods. However, care needs to be taken so that organoleptic acceptance is not compromised as taste has been identified as an important determining factor in food choice behaviour (Huon, Wardle & Szabo, 1999; Neumark-Sztainer, Story, Perry & Casey, 1999). There have been attempts by school canteens to replace popular, high fat food items with lower fat varieties, most notably Munja meat pies.
According to canteen management opinion, students did not like the taste of this food item and consequently it was removed from the canteen menu. Despite entrenched taste preferences for less than healthy items, the sale of high fat foods (including chocolate-based confectionery, high fat cake and pastry items and meal deals) could be restricted to special occasions on the school calendar to reinforce dietary recommendations that these foods as suitable for occasional consumption only. By providing a more 103 positive food environment, students may be encouraged towards healthier selections (Nestle et al., 1998) Reduce Saturated Fat Intake to Less Than 10% of Total Energy Intake One main contributor to the intake of this nutrient, particularly for STARCAP students, was the consumption of whole-milk flavoured beverages (Supershakes ). The removal of this item from canteen menus would be one simple way to reduce saturated fat intake. Milk is, however, an important
contributor to a number of nutrients. Therefore, it is recommended that wholemilk beverages be replaced with reduced or low-fat milk beverages Although reduced and low-fat milks would not be appropriate for young children, for adolescents who consume milk as a recreational item, reduced and low-fat varieties would be beneficial in maintaining the intake of nutrients provided by this food. Increase Folate Intake to One-Third ofthe 200ug RDI Folate occurs in a wide variety of foods, particularly green leafy vegetables, fortified breakfast cereals, citrus fruits and nuts. Canteen menus which include a variety of folate-rich foods would be an effective way to help students to obtain a higher intake of this nutrient, particularly in light of the limited canteen food consumption patterns exhibited by the students in this study. 104 Canteens could encourage students to eat a wider variety of folate-rich foods by including them in the preparation of food items. For example, carbohydrate
rich products can incorporate fortified cereals and nuts; salad rolls, sandwiches and burgers can be served with dark green lettuce varieties such as rocket and watercress. Increase Fibre Intake A number of items offered by school canteens, such as sandwiches and rolls pasta-based dishes, soups and salads are good sources of dietary fibre. Whilst they were not popular choices with the students in this study, there may be factors that make these choices unappealing in terms of perceived convenience. Therefore, for meals that require seating, canteens could play a role to ensure these amenities are provided to students. Canteens could also present these foods as practically as possible for students to consume on the run. For example, some fruits and vegetables could be peeled, cut and prepacked for sale. Although cutting and peeling reduces the dietary fibre (and vitamin) content to some extent, food preparation techniques such as soaking in minimal water and preparing these items
close to serving time can aid in nutrient retention. Ultimately, to increase the fibre intake of students, the inclusion of fibre-rich foods such as cereals, legumes, vegetables, fruits, nuts, seeds, breads and baked goods produced with wholemeal, mixed grain, wheatmeal and bran could help students to obtain the health-related benefits that.fiqre offers 105 Increase Calcium Intake For REGULAR students who had access to soft drinks in this study, it appears that these items displaced flavoured milk beverages and were accountable for lower calcium intakes compared to STARCAP students. Because soft drinks are nutrient-poor, it may be better if they were not offered for sale by school canteens. Similarly, while ice confection items contributed to students calcium intake, these items also contributed to fat and refined sugar intake. A more nutritious option would be frozen yoghurt because of its lower fat and higher calcium content compared to ice cream. Cheese is also an
excellent source of calcium and therefore it is recommended that food items which include fresh, reduced or low-fat cheese be considered for inclusion on canteen menus. Examples are numerous and include pasta and vegetable-based dishes such as ricotta macaroni, tomato and cottage cheese cannelloni, feta and zucchini moussaka and baked stuffed potatoes. Similarly, a variety of breadbased dishes which feature low-fat cheese as an ingredient include suggestions such as ham and pineapple pizzettas, focaccia melts, and open and club sandwiches. Increase Iron Intake To address the low iron intakes demonstrated by the students in this study, the promotion of good food sources of iron such as lean meat and lean chicken, fish~ eggs, fortified breakfast cereal, legumes and dried fruit is of paramotmt 106 priority. Accordingly, canteens could offer a range of food items that may assist students to obtain adequate amounts of this nutrient such as steak sandwiches and burgers with
salad-based fillings served on a variety of breads, packaged dried fruits and nuts, frittatas, chicken drumsticks, sweet n sour pork spare ribs, shaved beef open sandwiches, kebabs, chicken Hawaiian pita rolls, lean beef and lean chicken stir-fry and noodles, and meat-based dishes such as satay, tandoori, moussaka, cannelloni, bolognaise, ravioli and lasagne. Summary Australias 7000 school canteens "feed over one million students [and] . collectively, this comprises Australias largest take-away food outlet" (Nutrition Australia, 2000). Due to societal changes, school canteens are increasingly being relied upon as a main supplier of food for school-aged children; for the students in this study, 75% of foods consumed at school were sourced from the school canteen. Given this, it is fundamentally important that school canteens implement dietary intervention strategies that provide students with nutritious food which, in tum, will enhance general well- being and assist in the
prevention of diet-related diseases. Due to their location within educational sites, school canteens have an obligation to reinforce health-related education programs taught in schools and the wider community if they are to play a positive role in influencing the health status of students. 107 References Antine, S.A (1997) American Health Foundation releases study suggesting teenagers and young adults arent getting enough fiber. [on-line] Available WWW: http://www.kidsourcecom/kidsource/content2/news/ Fiber/html. [03/04/00] Archer, M.C (1996) Cancer and Diet In EE Ziegler, & LJ Filer (Ed), Present Knowledge in Nutrition. (Chapter 48) Washington DC: International Life Sciences Institute. Australia New Zealand Food Authority. (2000) AUSNUT - A new nutritional CD database launched today. [on-line] Available WWW: http://www.anzfagovau/documents/mr02 OOasp [14/08/00] Australian Bureau of Statistics. (1995) National nutrition survey: Foods eaten. Canberra: Australian Government
Publishing Service Australian Bureau of Statistics. (1996) Census of population and housing Canberra: Australian Government Publishing Service. Australian Bureau of Statistics. (1997) National nutrition survey selected highlights Australia 1995. Canberra: Australian Government Publishing Service. Australian Institute of Health and Welfare & Commonwealth Department of Health and Family Services. (1996) First report on national health priority areas 1996. Canberra: Goanna Print Australian Nutrition Foundation In~. (1985) The complete school canteen book. Frenchs Forest, NSW: Reed Books PtyLtd Ball, M. (1997a) Atherosclerotic vascular disease and hypertension In ML Wahlqvist (Ed.), Food and Nutrition: Australasia, Asia and the Pacific (Chapter 37). Australia: Allen and Unwin Pty Ltd Ball, M. (1997b) Diabetes In ML Wahlqvist (Ed), Food and Nutrition: Australasia, Asia and the Pacific. (Chapter 38) Australia: Allen and Unwin Pty Ltd. Baghurst, K.I, Hertzler, AA, Record, SJ, & Spurr,
C (1992) The development of a simple dietary assessment and education tool for use by individuals and nutrition educators. Journal ofNutrition Education, 24, 165-172. 108 Baranowski, T., Darnel, S, Gould, R, Baranowski, J, Leonard, S, Treiber, F, & Mullis, R. (1993) Increasing fmit and vegetable consumption among 41h and 51h grade students: results from focus groups using reciprocal determinism. Journal of Nutrition Education, 25 (3), 115120 Birch, L.L (1993) Children, parents and food British Food Journal, 95 (9), 11-15. Booth, M.L, Wake, M, Armstrong, T, Chey, T, Hesketh, K, & Mathur, S (2001 ). The epidemiology of overweight and obesity among Australian children and adolescents, 1995-97. Australian Journal of Public Health, 25 (2), 162-169. Borja, M.E, Bordi, PL, & Lambert, CU (1996) New lower-fat dessert recipes for the school lunch program are well accepted by children. Journal ofthe American Dietetic Association, 96 (9), 908-910. Brady, L.M, Lindquist, CH, Herd,
SL, & Goran, MI (2000) Comparison of childrens dietary intake patterns with US dietary guidelines. British Journal ofNutrition, 84 (3), 361-367. Carter, P., & Kellett, E (1996) School canteens [on-line] Available WWW: http://WWW.monasheduau/ANF/newsletter/Mar-96/6htm Chambers, E., Godwin, SL, & Vecchio, FA (2000) Cognitive strategies for reporting portion sizes using dietary recall procedures. Journal of the American Dietetic Association, 100 (8), 891-897. Chapman, N., Gordon, AR, & Burgharat, JA (1995) Factors affecting the fat content of National School Lunch program lunches. American Journal of Clinical Nutrition, 95 (61), 199S-204S. Cholin, B. (1999) Encouraging healthy diets in adolescent girls Nutrition and Health (13), 103-108. Church, S. (1997) School food- turning the tide Nutrition & Food Science, 97 (1), 20-22. Cobiac, L., & Baghurst, KI (1993) Iron status and dietary iron intakes of Australians. Food Australia, 45 (4), S1-S23 Commonwealth Department
of Health, Housing & Community Services. (1993). Goals and Targets for Australias Health in the Year 2000 and Beyond. Canberra: Australian Government Publishing Service 109 Domel-Baxter, S., Thompson, WO, Davis, HC, & Johnson, MH (1997) Impact of gender, ethnicity, meal component and time interval between eating and reporting on accuracy of fourth-graders self-reports of school lunch. Journal of the American Dietetic Association, 97 (11), 1293-1298. Douglas, L. (1998) Childrens food choice Nutrition & Food Science, 98 (1), 14-18. Douglas, L. (1999) Contribution of "packed lunches" to the dietary intake of 11-12-year-old children. Nutrition and Food Science, 4 (4), 181-186 Education Department of South Australia/Health Department Foundation South Australia. (1988) The school canteen: an opportunity to improve childrens heath. Noarlunga Centre: The Heath Department Foundation. Gallaher, D.D, & Schneeman, BO (1996) Dietary Fiber In EE Ziegler, & L.J
Filer (Ed), Present Knowledge in Nutrition (Chapter 9). Washington DC: International Life Sciences Institute. Gibbons, K.L, Wertheim, EH, Paxton, SJ, Petrovich, T, & Szmukler, GI (1995). Nutrient intake of adolescents and its relationship to desire for thinness, weight loss behaviours and bulimic tendencies. Australian Journal of Nutrition and Dietetics, 52 (2), 69-7 4.s Gibson, R.S (1993) Nutritional assessment: a laboratory manual New York: Oxford University Press. Guthrie, J. (1996) USDA acts to improve school meals and childrens nutrition. Foodreview, 19 (2), 55-56 Harris, K.J, Paine-Andrews, A, Richter, KP, Lewis, RK, Johnston, JA, James, V., Henke, L, & Fawcett, SB (1997) Reducing elementary school childrens risks for chronic diseases through school lunch modifications, nutrition education and physical activity interventions. Journal ofNutrition Education, 29 (4), 196-202. Health Development Foundation. (1995) South Australian school buying guide. Nutrition Section of the
Health Development Foundation: North Adelaide, South Australia. Heart Foundation of Australia. (1999) Heart, stroke and vascular diseases, Australian facts. Canberra: Australian Institute of Health and Welfare Huck, S., & Cormer, W (1996) Reading statistics and research New York: Harper Collins. 110 Hughes, R., & Clifford, H (2000) Food group composition of Year 1 school students lunchboxes and implications for school-based nutrition interventions. Journal of the HEIA, 7 (4), 27-30 Huon, G.F, Wardle, J, & Szabo, M (1999) Improving childrens eating patterns: intervention programs and underlying principles. Australian Journal ofNutrition and Dietetics, 56 (3), 156-165. Johnson, R.K (2000) Changing eating and physical activity patterns of US children. Proceedings of the Nutrition Society, 59 (2), 295-301 Jones, G.P (1997a) Carbohydrates In ML Wahlqvist (Ed), Food and Nutrition: Australasia, Asia and the Pacific. (Chapter 21) Australia: Allen and Unwin Pty Ltd. Jones, G.P
(1997b) Fats In ML Wahlqvist (Ed), Food and Nutrition: Australasia, Asia and the Pacific. (Chapter 22) Australia: Allen and Unwin Pty Ltd. Jones, G.P (1997c) Dietary fibre and resistant starch In ML Wahlqvist (Ed.), Food and Nutrition: Australasia, Asia and the Pacific (Chapter 23). Australia: Allen and Unwin Pty Ltd Jones, G.P (1997d) Minerals In ML Wahlqvist (Ed), Food and Nutrition: Australasia, Asia and the Pacific. (Chapter 25) Australia: Allen and Unwin Pty Ltd. Kennedy, L. (1996) Whats a health promoting school? [on-line] Published in ANF National, Vol. 1, No 26 October 1996 Available WWW: http://WWW.monasheduau/ANF/newsletter/Oct-96/ho-schoohtm Law, M. (2000) Dietary fat and adult diseases and the implications for childhood nutrition: an epidemiologic approach. The American Journal of Clinical Nutrition, 52 (5s), 1291s-1296s. Livingstone, M.BE, & Robson, PJ (2000) Measurement of dietary intake in children. Proceedings of the Nutrition Society, 59 (2), 279-293 McBride, S.
(1992) The effect of canteen menu on nutritional knowledge, attitudes and behaviour of Year 5 students. Unpublished masters dissertation, Edith Cowan University, Perth, Western Australia. McBride, S., & Browne, J (1993) The school canteen: advocate or adversary in school health promotion? Health Promotion Journal of Australia, 3 (3), 15-19. Magarey, A., & Boulton, J (1995) The Adelaide nutrition study 4 Meal habits and distribution of energy and nutrients throughout the day at . ages 11, 13 and 15 years Australian Journal ofNutrition and Dietetics, . 52 (3), 132-138 111 Magarey, A., Daniels, LA, & Smith A (2001) Fruit and vegetable intakes of Australians aged 2-18 years: and evaluation of the 1995 National Nutrition Survey data. Australian and New Zealand Journal of Public Heath, 25 (2), 155-161. Marshall, B.J, Sheehan, MM, Northfield, JR, Maher, S, Carlisle, R, & St Leger, L.H (2000) School-based health promotion across Australia Journal of School Health, 70 (6),
251-252. Melnik, T.A, Rhoades, SJ, Wales, KR, Cowel, C, &Wolfe, W (1998) Food consumption patterns of elementary schoolchildren in New York City. Journal of the American Dietetic Association, 98 (2), 159-164 Meyer, M.K (2000) Top predictors of middle/junior high school students satisfaction with school foodservice and nutrition programs. Journal of the American Dietetic Association, 100 (1 ), 100-103. Meyer, M.K, & Conklin, MT (1998) Variables affecting high school students perceptions of school foodservice. Journal of the American Dietetic Association, 98 (12), 1424-1428. Miller, M. (1993) Nutrition of school children and its implications for health promotion in schools. Health in Schools (7), 12 National Health and Medical Research Council. (1991) Recommended dietary intakes for use in Australia. Canberra: Australian Government Publishing Service. National Health and Medical Research Council. (1995) Dietary guidelines for children and adolescents. Canberra: Australian
Government Publishing Service. National Heart Foundation (WA Division). (1993) School canteen handbook Subiaco, WA: National Heart Foundation. Nestle, M., Wing, R, Birch, L, DiSogra, L, Drewnowski, A, Arbor, A, Middleton, S., Sigman-Grant, M, Sohal, J, Winston, M, Economos, C (1998). Behavioural and social influences on food choice Nutrition Reviews, 56 (5), 550-560. Neumark-Sztainer, D., Story, M, Perry, C, & Casey, MA (1999) Factors influencing food choices of adolescents: findings from focus-group discussions with adolescents. Journal of the American Dietetic Association, 99 (8), 929-934, 937. Nowak, M. (1998) The weight-conscious adolescent: body image, food intake and weight-related behaviour. Journal of Adolescent Health, 23 (6), 389-398. 112 Nowak, M., & Crawford, D (1998) Getting the message across; adolescents health concerns and views about the importance of food. Australian Journal ofNutrition and Dietetics, 55 (1), 3-8. Available WWW: Nutrition Australia: News
in Nutrition [on line]. http://www.nutritionaustraliaorg [2001, October 25] ODea, J. (1995) Body image and nutritional status among adolescents and adults - a review of the literature. Australian Journal of Nutrition and Dietetics, 52 (2), 56-67. ODea, J., Abraham, S, & Heard, R (1996) Food habits, body image and weight control practices of young male and female adolescents. Australian Journal ofNutrition and Dietetics, 53 (1), 32-38. Owen, S., Schickler, P, & Davies, J (1997) Food choice: how to assess attitudes of pre-adolescent children. Nutrition and Food Science, 97 (1), 5-11. Perth Dental Hospital and Community Dental Services. (May, 1999). [Leaflet]. (Available from Dental Health Education Unit, 43 Mt Hemy Road, Como, 6152, Western Australia). Pirouznia, M. (2001) The association between nutrition knowledge and eating behaviour in male and female adolescents in the US. International Journal ofFood Sciences and Nutrition, 52 (2), 127-132. Read, R.SD (1997) Food energy and
energy expenditure In ML Wahlqvist (Ed.), Food and Nutrition: Australasia, Asia and the Pacific (Chapter 18). Australia: Allen and Unwin Pty Ltd Read, S.D, & Kouris-Blazos, A (1997) Foods, physical activity and sport In M.L Wahlqvist (Ed), Food and Nutrition: Australasia, Asia and the Pacific. (Chapter 30) Australia: Allen and Unwin Pty Ltd Riley, M., & Dean, K (1997) Dietary intake of Australian schoolchildren aged 10 to 15 years in 1985- regional variation by state and territory. Australian Journal ofNutrition and Dietetics, 54 (3), 127-135. Rowling, L., & Rissel, C (2000) Impact of the National Health Promoting School initiative. Journal of School Health, 70 (6), 260 Ruxton, C.HS, Kirk, TR, Belton, NR, & Holmes, MAM (1993) School meals. British Food Journal, 95 (8), 9-12 Saxelby, C. (1999) Nutrition for life: everything you need to lmow about food and nutrition. South Yarra: Hardie Grant Books 113 School canteens- how can I be a catalyst for change? (no date).
[Handout] (Available from Western Australian School Canteen Association (Inc.), PO Box 25, Hillarys, 6923, Western Australia). Seaman, C.EA, Bower, J, & Fleming, M (1997) Nutrition knowledge and lunchtime eating habits of secondary school children in Lothian. Journal of Consumer Studies and Home Economics, 21 (3), 259-269. Sherwood, N.E, & Neumark-Sztainer, D (2001) Internalisation of the sociocultural ideal: Weight related attitudes and dieting behaviours among young adolescent girls. American Journal of Health Promotion, 12 (4), 228-231. St. Leger, L, & Nutbeam, D (2000) Research into health promoting schools Journal of School Health, 70 (6), 257-260). Starcap- participating schools. (2000) [Handout] (Available from Western Australian School Canteen Project, PO Box 25, Hillarys, 6923, Western Australia). Steinbeck, K. (1995) Adolescent eating habits: how they affect nutritional status. Iron Deficiency in Teenagers Seminar [on-line] Available at WWW:
http://WWW.mlacomau/edu/schools/habitscfm Story, M., Hayes, M, & Kalina, B (1996) Availability of foods in high schools: is there cause for concern? Journal of the American Dietetic Association, 96 (2), 123-128. Story, M., Neumark-Sztainer, D, Sherwood, N, Stang, J, & Murray, D (1998). Dieting status and its relationship to eating and physical activity behaviors in a representative sample of US adolescents. Journal ofthe American Dietetic Association, 98 (10), 1127-1132. Strategy grab bag. Health in Schools, 4 (1), 17 Tilston, C.H, Neale, RJ, Gregson, K, & Douglas, CJ (1992) A study of the nutritional composition of primary school childrens packed lunches and school meals. Journal of Consumer Studies and Home Economics, 16 (2), 97-107. Valentini, H., Walker, J, & Riddell, R (1997) The Australian Nutrition Foundation: improving the health of school canteens. Journal of the Home Economics Institute, 4 (1), 8-10. Victorian Dairy Industry Authority. (1978) Canteen managers
handbook Victoria: VDIA. Wahlqvist, M.L (1997) Vitamins and vitamin-like compounds In ML . Wahlqvist (Ed), Food and Nutrition: Australasia, Asia and the Pacific · (Chapter 24). Australia: Allen and Unwin Pty Ltd 114 Wahlqvist, M.L, & Kouris-Blazos, A (1997) Dietary advice and food guidance systems. In ML Wahlqvist (Ed), Food and Nutrition: Australasia, Asia and the Pacific. (Chapter 52) Australia: Allen and Unwin Pty Ltd. Weaver, C.M (2000) Calcium and magnesium requirements of children and adolescents and peak bone mass. The International Journal of Applied and Basic Nutritional Sciences, 16 (7/8), 514:516. Western Australian School Canteen Association (Inc). (WASCA) (2000) Star Canteen Accreditation Program - a guide to reaching the stars. [Brochure]. Perth, Western Australia: Health Department of Western Australia. Williams, H.M, Woodward, DR, Ball, PJ, Cumming, FJ, Hornsby, H, & Boon, J.A (1993) Food perceptions and food consumption among Tasmanian high school
students. Australian Journal of Nutrition and Dietetics, 50 (4), 156-163. Woolfolk, A.E (1998) Educational psychology, Allyn and Bacon. ih Ed. Needham Heights: Worsfold, D., & Griffith, C (1992) The quality of schoolchildrens packed lunches. British Food Journal, 94 (4), 12-16 Young, I. (1993) Healthy eating policies in schools Journal, 52 (1), 3-9. Health Education 115 APPENDIX A Date:------------------- The Principal Address: ---------------- Dear Principal I am writing to formally introduce myself and to seek your approval to undertake research at your school about what foods students consume while at school. My name is Jenny Kora and I am an Honours student at Edith Cowan University. I am currently emolled in the Bachelor of Education course and my major area of study is home economics. The aim of the research project is to determine the nutrient profile of students canteen food purchases and to compare this to the National Health and Medical Research Councils
Recommended Dietary Intakes (1992). I am therefore requesting access to two Year 8 home economics classes for approximately 15 minutes each. During this time I aim to elicit food recall information from the students by requesting them to list all food items consumed while at school for that day on a simple form. If possible, I would like to do this exercise with each class immediately after lunch wherever timetables permit, to promote food recall accuracy. I would be grateful if you would agree to participate in this study and I can assure you that the students anonymity will be protected as no school will be mentioned in a way that can be identified. You are most welcome to contact me to discuss the research project as follows: Telephone: E-mail: (08) 9371 7583 mcmilesv@bigpond.com Alternatively, you can speak to my supervisor, Dr Delia Quinn, whose contact details are as follows: Telephone: E-mail: (08) 9370 6345 d.quinn@cowaneduau . /2 116 Page2 For your information I have
enclosed a copy of the food recall instrument that the students will be requested to complete. Also enclosed is a copy of the consent form that I would issue to each student, as well as two copies of this letter. If you are willing to participate in the study, please keep one copy of this letter for your records and sign and return the other copy in the stamped and addressed envelope provided. Once the proposed study is complete, I will forward to you a report on the findings and I look forward to Lakelands Senior High Schools involvement in this study. Yours sincerely Jenny Kora (Miss) Att: Data Collection Form Student Consent Form Stamped and addressed envelope I have read the information above and any questions I have asked have been answered to my satisfaction. I agree to [Schools] participation in this study and understand that the research data gathered for this study may be published provided [School] is not identifiable. Participant Date Researcher Date 117 L j .•
•--ema•e LJ > ; " d ;<· uate or tslrtn l .j; (l, ,, Lunch: Morning Recess: Before School Started: . Name of food or drink: ! r I p I i • • -: ,7 ·=A,. A Amount of food or drink: Where the food or drink came from: C =Canteen H Home :" ,: jJ. " .?(;;;t d ·~··n· · k t . d·] ·y· - ? ~,il::t®. ~-!Lt ~lA··, dj ····r! ···t· ; ·a · .• Wh--~-eytw•·. d········--·I~:d/@· ~:-~·, Y·~- /·()J1l: . • .! ·· •• • • IVIale = ~ ~, z ~ APPENDIXC Procedure for Data Collection Prior to Data Collection Procedure: 1. Write name and date on blackboard. 2. Write a blank food recall sheet on blackboard to be used as a sample for demonstration. 3. Set up food models, including sample one-day school-time food and beverage items. During Data Collection Procedure: 1. Self-introduction. 2. Explain that everyone is going to play a part in a study to determine the types of foods and
drinks Year 8 students typically consume while at school. 3. Hand out student consent forms. Read consent forms aloud to students Ask students to sign consent forms if they agree to participate. Collect signed consent forms. 4. Hand out food recall sheets to students - ask them NOT to write on sheets at this stage. 5. Show students the food models on display. Explain that the models might help students to prompt their memory about the food and drink items they consumed for that day. 6. Show students the sample one-day school-time food intake items, which will consist primarily of the food and beverage items sourced from the school canteen on the day: • Before School Started: 1 x fruit item brought fi·om home • Morning Recess: 1 x main meal item available fi·om school canteen Y, offiiend s banana brought fi·om home • Lunch: 1 x drink item available fiom school canteen 1 x main meal item available fiwn school canteen 1 x snack available fi·om school canteen 7.
Demonstrate how to complete the food recall sheet by entering the sample one-day school-time food intake items on the blackboard. 8. Stress that the source of food and drinks items must be noted in the right-hand column (C=Canteen, H=Home) as well as any food sharing intake (expressed in terms of bites) and beverage intake (expressed in terms of"gulps"). 9. Ask if there are any questions and answer questions that arise. 10. Instruct students to complete their food recall sheets. Supervise students while they complete their food recall sheets and assist where .·necessary 11. · Check each food recall sheet before collection and thank students for their time and cooperation. 119 APPENDIXD CONSENT FORM • You are being invited to take part in a study about what students eat and drink while they are at school. • You will be asked to remember all the food and drink you have consumed today up until the end of lunchtime and to write each item on a simple form. •
The information you provide is confidential and anonymous and there are no right or wrong answers, so the information you provide will not affect your school marks or grades. • The most important thing is to try to remember everything you ate and drank today, and to be honest about the information you are providing. Thank you. I agree to participate in the study, providing I can withdraw at any time. I agree that results can be published provided that neither myself nor the school can be identified. Signed: . Date: . 120
 Just like you draw up a plan when you’re going to war, building a house, or even going on vacation, you need to draw up a plan for your business. This tutorial will help you to clearly see where you are and make it possible to understand where you’re going.