Datasheet
Year, pagecount:2018, 3 page(s)
Language:English
Downloads:2
Uploaded:April 05, 2018
Size:576 KB
Institution:
-
Comments:
Attachment:-
Download in PDF:Please log in!
Comments
No comments yet. You can be the first!Most popular documents in this category


Content extract
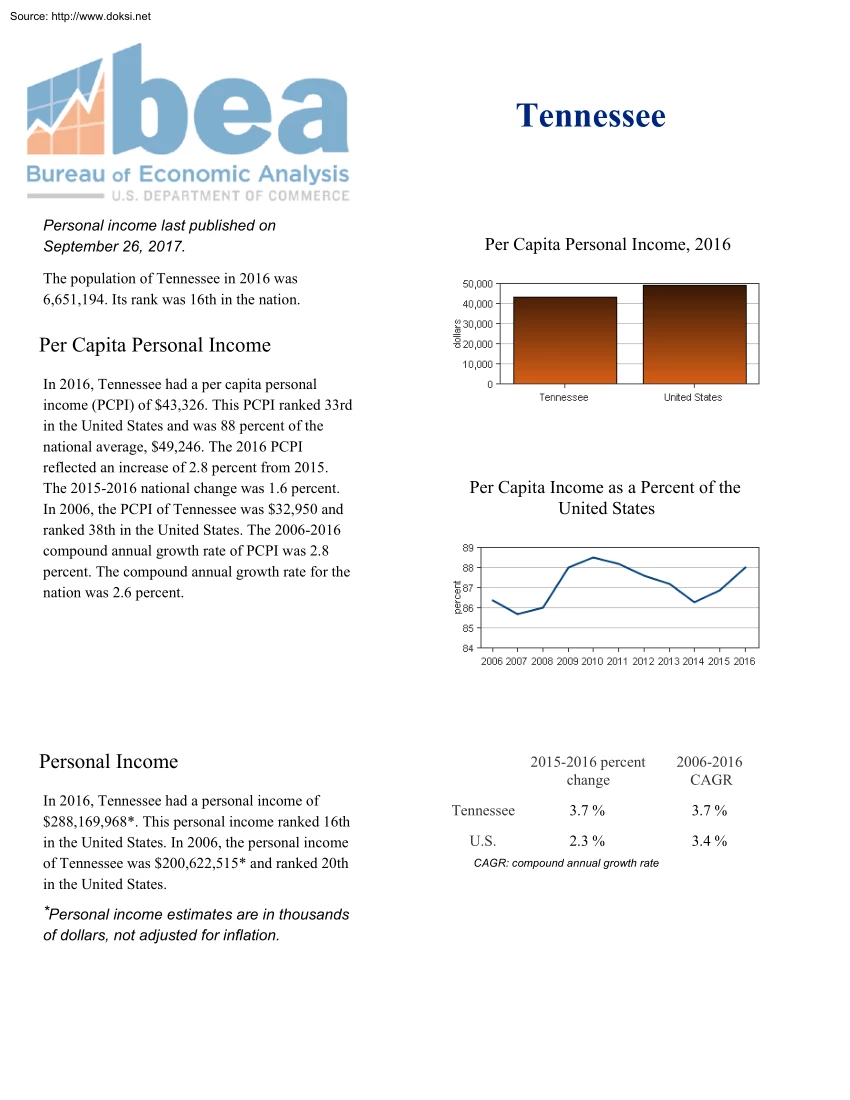
Source: http://www.doksinet Tennessee Personal income last published on September 26, 2017. Per Capita Personal Income, 2016 The population of Tennessee in 2016 was 6,651,194. Its rank was 16th in the nation Per Capita Personal Income In 2016, Tennessee had a per capita personal income (PCPI) of $43,326. This PCPI ranked 33rd in the United States and was 88 percent of the national average, $49,246. The 2016 PCPI reflected an increase of 2.8 percent from 2015 The 2015-2016 national change was 1.6 percent In 2006, the PCPI of Tennessee was $32,950 and ranked 38th in the United States. The 2006-2016 compound annual growth rate of PCPI was 2.8 percent. The compound annual growth rate for the nation was 2.6 percent Per Capita Income as a Percent of the United States Personal Income In 2016, Tennessee had a personal income of $288,169,968*. This personal income ranked 16th in the United States. In 2006, the personal income of Tennessee was $200,622,515* and ranked 20th in the United
States. *Personal income estimates are in thousands of dollars, not adjusted for inflation. 2015-2016 percent change 2006-2016 CAGR Tennessee 3.7 % 3.7 % U.S 2.3 % 3.4 % CAGR: compound annual growth rate Source: http://www.doksinet Components of Personal Income Personal income includes net earnings by place of residence; dividends, interest, and rent; and personal current transfer receipts received by the residents of Tennessee. 2015-2016 percent change 2006-2016 CAGR Tennessee U.S Tennessee U.S Net earnings 4.5 % 2.5 % Net earnings 3.2 % 2.8 % Dividends, interest, and rent 2.3 % 1.2 % Dividends, interest, and rent 3.9 % 3.7 % Personal current transfer receipts 2.1 % 3.1 % Personal current transfer receipts 5.4 % 5.5 % CAGR: compound annual growth rate Percent Contribution to Personal Income Tennessee 2006 2016 Net earnings by place of residence Dividends, interest, and rent Personal current transfer receipts United States Source:
http://www.doksinet GDP last published on November 21, 2017. Gross Domestic Product (GDP) by State In 2016, Tennessee current-dollar GDP was $331.9 billion and ranked 18th in the United States In 2006, Tennessee GDP was $239.0 billion and ranked 19th in the United States In 2016, Tennessee real GDP grew 2.9 percent; the 2015-2016 national change was 15 percent The 2006-2016 compound annual growth rate for Tennessee real GDP was 1.2 percent; the compound annual growth rate for the nation was 12 percent. GDP by State for Industries In 2016, the largest industry in Tennessee was finance, insurance, real estate, rental, and leasing. This industry accounted for 16.5 percent of Tennessee GDP and had 26 percent real growth The second largest industry was government, which accounted for 11.3 percent of Tennessee GDP and had 07 percent real growth The largest contributor to real GDP growth in Tennessee was finance, insurance, real estate, rental, and leasing. This industry accounted for 0.43
percentage point of the total growth in real GDP The second largest contributor was durable goods manufacturing. This industry accounted for 041 percentage point of the total growth in real GDP* * The industry contributions, or sum thereof, may be larger than 100 percent (and the percentage points larger than the percent change) because growing and declining industries offset one another. Top Five State Industries as a percent of Total GDP, 2016 Tennessee United States Durable goods manufacturing manufacturing Educational services, health care, and social assistance Finance, insurance, real estate, rental, and leasing Government Professional and business services All others