Datasheet
Year, pagecount:2016, 4 page(s)
Language:English
Downloads:3
Uploaded:October 29, 2018
Size:649 KB
Institution:
-
Comments:
Office of Advocacy
Attachment:-
Download in PDF:Please log in!
Comments
No comments yet. You can be the first!Most popular documents in this category


Content extract
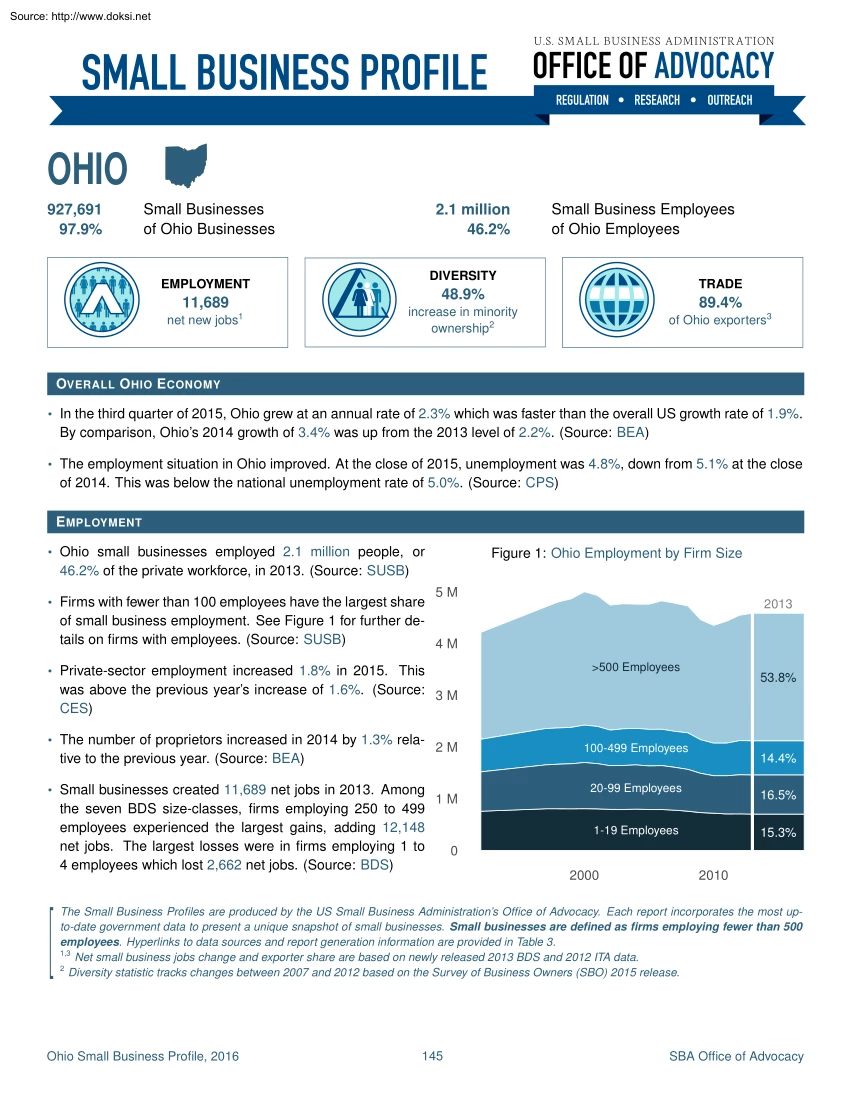
Source: http://www.doksinet OHIO 927,691 97.9% Small Businesses of Ohio Businesses 2.1 million 46.2% DIVERSITY EMPLOYMENT 11,689 net new jobs1 Small Business Employees of Ohio Employees TRADE 48.9% 89.4% increase in minority ownership2 of Ohio exporters3 OVERALL O HIO E CONOMY • In the third quarter of 2015, Ohio grew at an annual rate of 2.3% which was faster than the overall US growth rate of 19% By comparison, Ohio’s 2014 growth of 3.4% was up from the 2013 level of 22% (Source: BEA) • The employment situation in Ohio improved. At the close of 2015, unemployment was 48%, down from 51% at the close of 2014. This was below the national unemployment rate of 50% (Source: CPS) E MPLOYMENT • Ohio small businesses employed 2.1 million people, or Figure 1: Ohio Employment by Firm Size 46.2% of the private workforce, in 2013 (Source: SUSB) • Firms with fewer than 100 employees have the largest share 5M 2013 of small business employment. See Figure 1 for further
details on firms with employees (Source: SUSB) 4M >500 Employees • Private-sector employment increased 1.8% in 2015 This 53.8% was above the previous year’s increase of 1.6% (Source: 3 M CES) • The number of proprietors increased in 2014 by 1.3% rela- tive to the previous year. (Source: BEA) • Small businesses created 11,689 net jobs in 2013. Among the seven BDS size-classes, firms employing 250 to 499 employees experienced the largest gains, adding 12,148 net jobs. The largest losses were in firms employing 1 to 4 employees which lost 2,662 net jobs. (Source: BDS) [ 2M 1M 100-499 Employees 14.4% 20-99 Employees 16.5% 1-19 Employees 15.3% 0 2000 2010 The Small Business Profiles are produced by the US Small Business Administration’s Office of Advocacy. Each report incorporates the most upto-date government data to present a unique snapshot of small businesses Small businesses are defined as firms employing fewer than 500 employees. Hyperlinks to data
sources and report generation information are provided in Table 3 1,3 Net small business jobs change and exporter share are based on newly released 2013 BDS and 2012 ITA data. 2 Diversity statistic tracks changes between 2007 and 2012 based on the Survey of Business Owners (SBO) 2015 release. Ohio Small Business Profile, 2016 145 SBA Office of Advocacy Source: http://www.doksinet I NCOME AND F INANCE • The number of banks reported in the Call Reports between June 2014 and June 2015 declined. (Source: FDIC) • In 2014, 142,036 loans under $100,000 (and valued at $2.3 billion) were issued by Ohio lending institutions reporting under the Community Reinvestment Act. (Source: FFIEC) • The median income4 for individuals who were self-employed at their own incorporated businesses was $45,450 in 2014. For individuals self-employed at their own unincorporated firms, this figure was $21,577. (Source: ACS) 4 Median income represents earnings from all sources. Unincorporated
self-employment income includes unpaid family workers, a very small [ percent of the unincorporated self-employed. B USINESS OWNER D EMOGRAPHICS Figure 2: Ohio Changes in Business Ownership by Demographic Group African American-owned Asian-owned Hawaiian/Pacific Islander-owned Hispanic-owned Native American/Alaskan-owned Minority-owned Nonminority-owned Figure 3: Ohio Self-Employment within Demographic Group 55.8% 19.1% 5.5% 9.8% 64.7% 9.9% 5.3% 53.9% 48.9% -2.8% Female Male Minority Veteran • Figure 2 displays the change in overall firm ownership for each demographic group from 2007 to 2012 based on the Survey of Business Owners (SBO) for Ohio, released in December 2015. • Figure 3 displays the percent of each demographic group identified as self-employed according to the 2014 American Community Survey (ACS) 5-year estimates. B USINESS T URNOVER • In the second quarter of 2014, 5,062 establishments Figure 4: Ohio Private Startup and Exit Rates
started up5 in Ohio and 5,386 exited.6 Startups generated 19,824 new jobs while exits caused 22,950 job losses (Source: BDM) • Figure 4 displays startup and exit rates from 2005 to 2015. exit rate startup rate 2009 2012 2.5% Each series is smoothed across multiple quarters to high2.4% light long-run trends. (Source: BDM) [ 5 STARTUPS are counted when business establishments hire at least one employee for the first time. The BLS terms these births, as distinct from the BLS openings category which includes seasonal re-openings. 6 EXITS occur when establishments go from having at least one employee to having none, and then remain closed for at least a year. The BLS terms these events deaths, as distinct from the closings category which includes seasonal shutterings. Ohio Small Business Profile, 2016 2.3% 2.2% 2.1% 2006 146 2015 SBA Office of Advocacy Source: http://www.doksinet I NTERNATIONAL T RADE • A total of 16,452 companies exported goods from Ohio in 2013. Among
these, 14,707, or 894%, were small firms; they generated 24.3% of Ohio’s total known export value (Source: ITA) S MALL B USINESSES BY I NDUSTRY Table 1: Ohio Small Firms by Industry, 2013 (sorted by small employer firms) 1 – 499 1 – 19 Nonemployer Total Small Employees Employees Firms Firms Other Services (except Public Administration) 24,507 22,708 108,800 133,307 Professional, Scientific, and Technical Services 21,341 19,469 93,971 115,312 Retail Trade 19,984 17,860 67,765 87,749 Health Care and Social Assistance 19,615 16,055 68,153 87,768 Construction 19,113 17,601 89,148 108,261 Accommodation and Food Services 16,528 12,682 10,331 26,859 Manufacturing 11,992 8,312 13,185 25,177 Administrative, Support, and Waste Management 10,739 9,331 65,910 76,649 Wholesale Trade 10,443 8,310 12,902 23,345 Finance and Insurance 7,894 7,204 22,009 29,903 Real Estate and Rental and Leasing 6,802 6,281 78,192 84,994
Transportation and Warehousing 5,332 4,517 36,338 41,670 Arts, Entertainment, and Recreation 3,466 2,931 37,282 40,748 Educational Services 2,572 1,863 21,256 23,828 Information 1,536 1,201 8,952 10,488 Mining, Quarrying, and Oil and Gas Extraction 533 464 4,084 4,617 Agriculture, Forestry, Fishing and Hunting 267 251 6,641 6,908 Utilities 144 94 621 765 182,808 157,134 745,540 928,348 Industry Total [ Totals for Tables 1 and 2 differ from SUSB’s statewide tallies due to firms with establishments in more than one industry and the omission of industry classifications not reported by NES. (Source: NES and SUSB) s Indicates samples deemed too small to represent the population according to SUSB. Ohio Small Business Profile, 2016 147 SBA Office of Advocacy Source: http://www.doksinet S MALL B USINESS E MPLOYMENT BY I NDUSTRY Table 2: Ohio Employment by Industry and Firm Size, 2013 (sorted by small firm employment) Small Business Employment
Industry Health Care and Social Assistance Manufacturing Accommodation and Food Services Retail Trade Other Services (except Public Administration) Professional, Scientific, and Technical Services Construction Wholesale Trade Administrative, Support, and Waste Management Finance and Insurance Transportation and Warehousing Educational Services Arts, Entertainment, and Recreation Real Estate and Rental and Leasing Information Mining, Quarrying, and Oil and Gas Extraction Utilities Agriculture, Forestry, Fishing and Hunting Total 349,305 291,007 265,229 184,846 174,754 154,323 139,288 132,573 130,141 59,787 54,810 54,014 42,437 39,117 22,562 5,710 3,158 1,134 2,104,195 Figure 5: Ohio County-Level Job Changes, 2015 (CEW) Total Private Employment Small Business Employment Share 815,279 632,722 453,078 553,457 205,485 234,066 165,294 224,287 369,007 252,885 158,169 118,207 62,858 62,925 86,491 10,943 24,064 1,295 4,430,512 42.8% 46.0% 58.5% 33.4% 85.0% 65.9% 84.3% 59.1% 35.3% 23.6%
34.7% 45.7% 67.5% 62.2% 26.1% 52.2% 13.1% 87.6% 47.5% Table 3: Abbreviations and Resources ACS BEA BDM BDS BLS CES CEW CPS FDIC FFIEC ITA NES SBO SUSB American Community Survey, US Census Bureau Bureau of Economic Analysis Business Employment Dynamics, BLS Business Dynamics Statistics, US Census Bureau Bureau of Labor Statistics, US Department of Labor Current Employment Statistics, BLS Census of Employment and Wages, BLS Current Population Survey, BLS Federal Deposit Insurance Corporation Federal Financial Institutions Examination Council International Trade Administration Nonemployer Statistics, US Census Bureau Survey of Business Owners, US Census Bureau Statistics of US Businesses, US Census Bureau All profiles, source data, methodology notes, and county-level employment statistics are available at http://go.usagov/cfKMd Job Change −5.6% to 0% 3% to 4.8% 0% to 3% 4.8% to 29% Ohio Small Business Profile, 2016 148 SBA Office of Advocacy